Fibonacci Apex

Apex Fibonacci

Precision in Every Level

Automatic or manual Fibonacci ranges. Multi-timeframe price levels. Custom retracement zones and optional alerts for MetaTrader 5.

Apex Fibonacci is an interactive Fibonacci analysis indicator designed to make price retracements and extensions easier to examine on the chart. It combines a rolling automatic range, manual A/B anchors, selectable Fibonacci levels, multi-timeframe overlays, colored retracement bands, and price-interaction notifications within one floating workspace.

The indicator does not select trade entries for you. Instead, it provides configurable reference levels and a consistent visual framework for analyzing a price movement.

1. Choose Your Fibonacci Range

Apex Fibonacci offers two range selection methods. Switch between them from the Setup tab without opening a separate drawing tool.

Mode How the range is defined Typical use
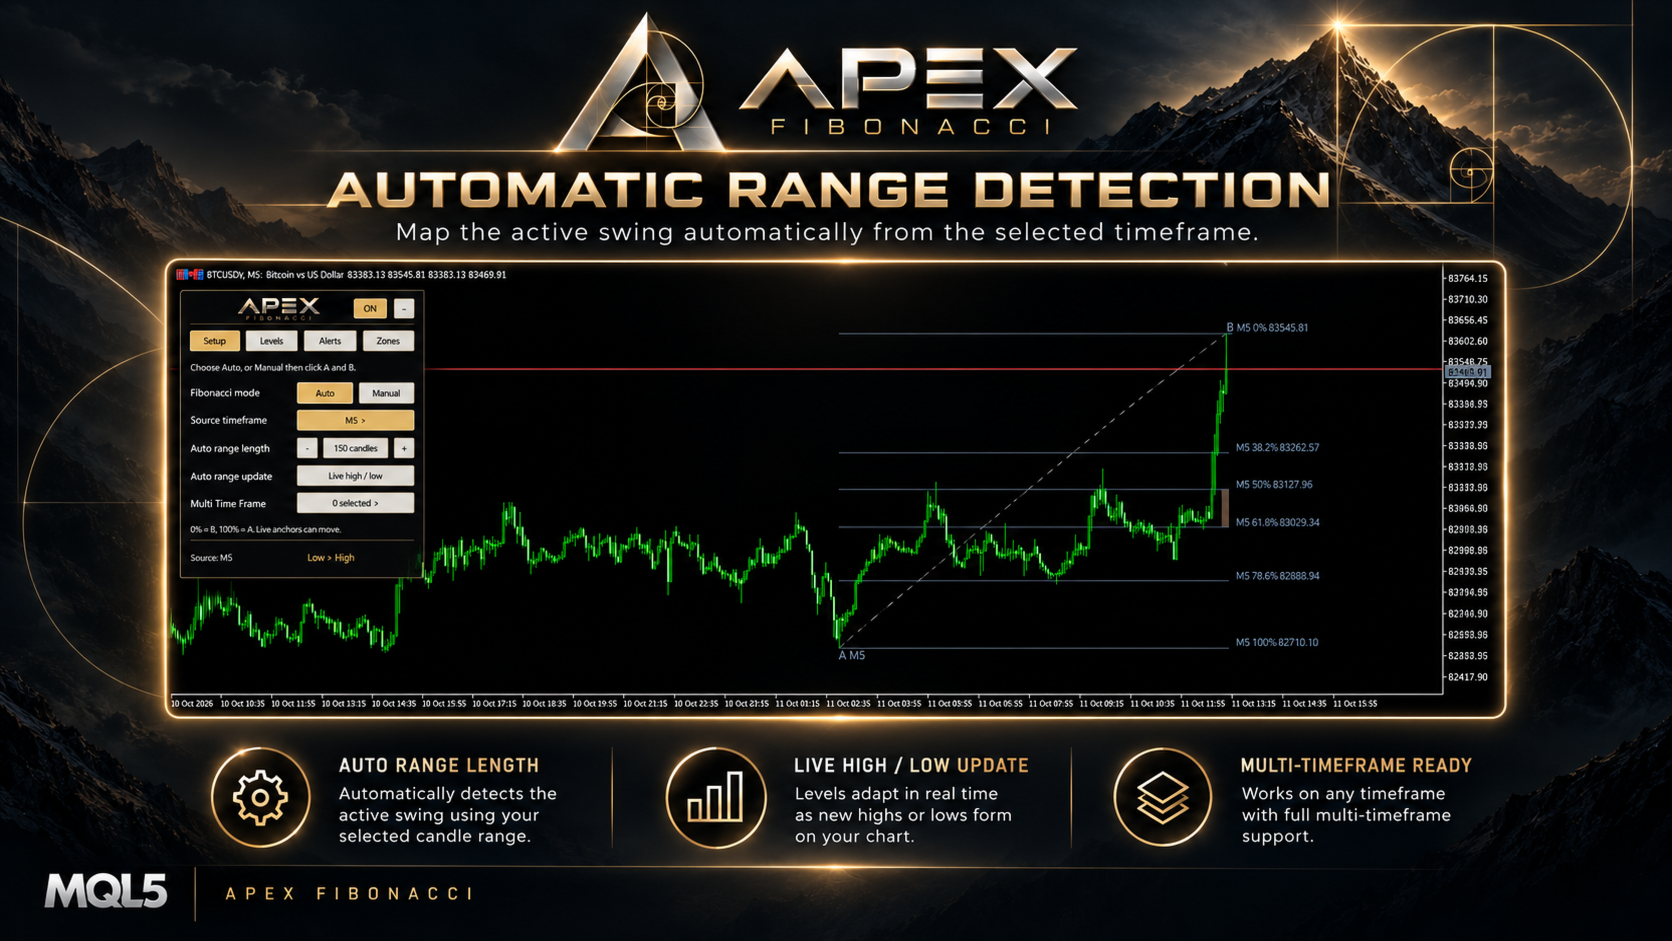
Auto Highest high and lowest low within a selected lookback window Following a developing price range
Manual Two chart points chosen by the trader: A and B Measuring a particular swing or price movement

In both modes, the Fibonacci scale is measured backward from the end of the selected movement: 0% is point B and 100% is point A. The price direction determines whether levels are measured down from a bullish high or up from a bearish low.

2. Auto Mode: A Rolling Price Range

In Auto mode, the indicator scans the selected source timeframe for its highest and lowest prices. Their chronological order defines the direction of the A-to-B movement: low-to-high for a bullish movement, or high-to-low for a bearish movement.

Adjustable lookback: Choose from 25 to 500 source candles. Use the controls in Setup to change the number of candles included in the calculation.

Live high / low: The initial mode includes the developing source candle. The range can update as a new high or low appears, so its anchor points and projected levels may move.

Closed candles: This alternative calculates the range from completed source candles only. It excludes the still-forming source candle from the range scan and updates as new candles close.

Source timeframe: Follow the current chart period, or select a fixed timeframe from the source-timeframe menu. The chosen source timeframe determines which candles are scanned; it is separate from the optional multi-timeframe overlays.

If enough history is not available, or the highest and lowest points do not define a valid movement, the indicator waits rather than displaying an unsupported range.

3. Manual Mode: Place A and B Directly on the Chart

Manual mode is useful for examining a move that you want to define yourself, rather than using the rolling highest/lowest window.

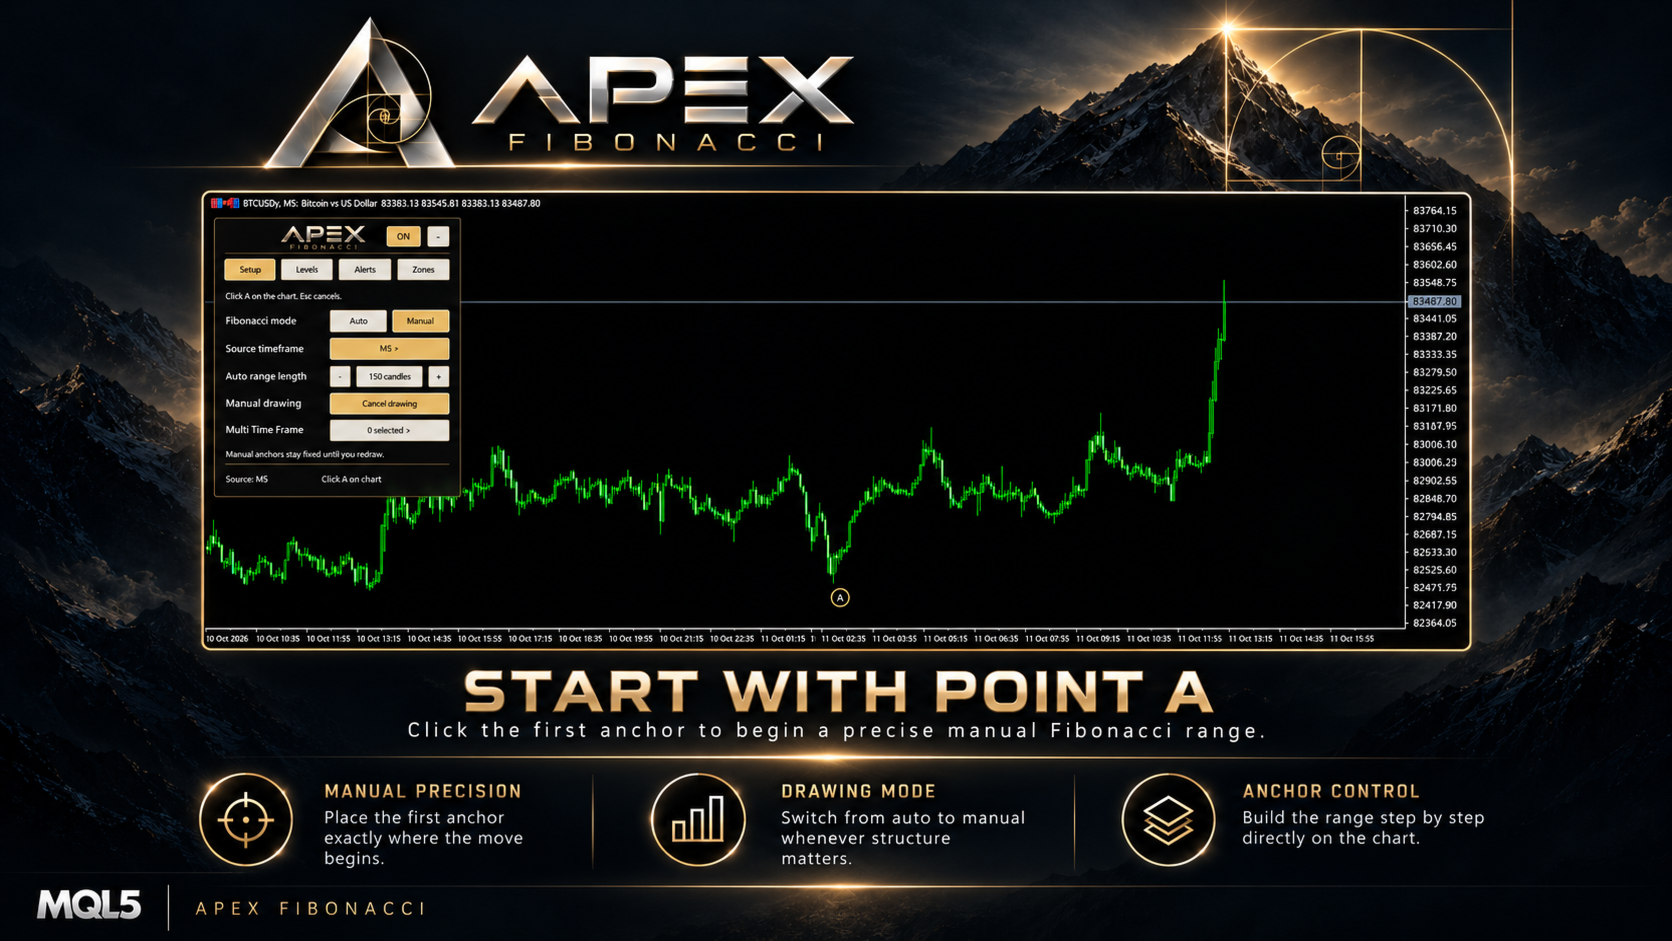
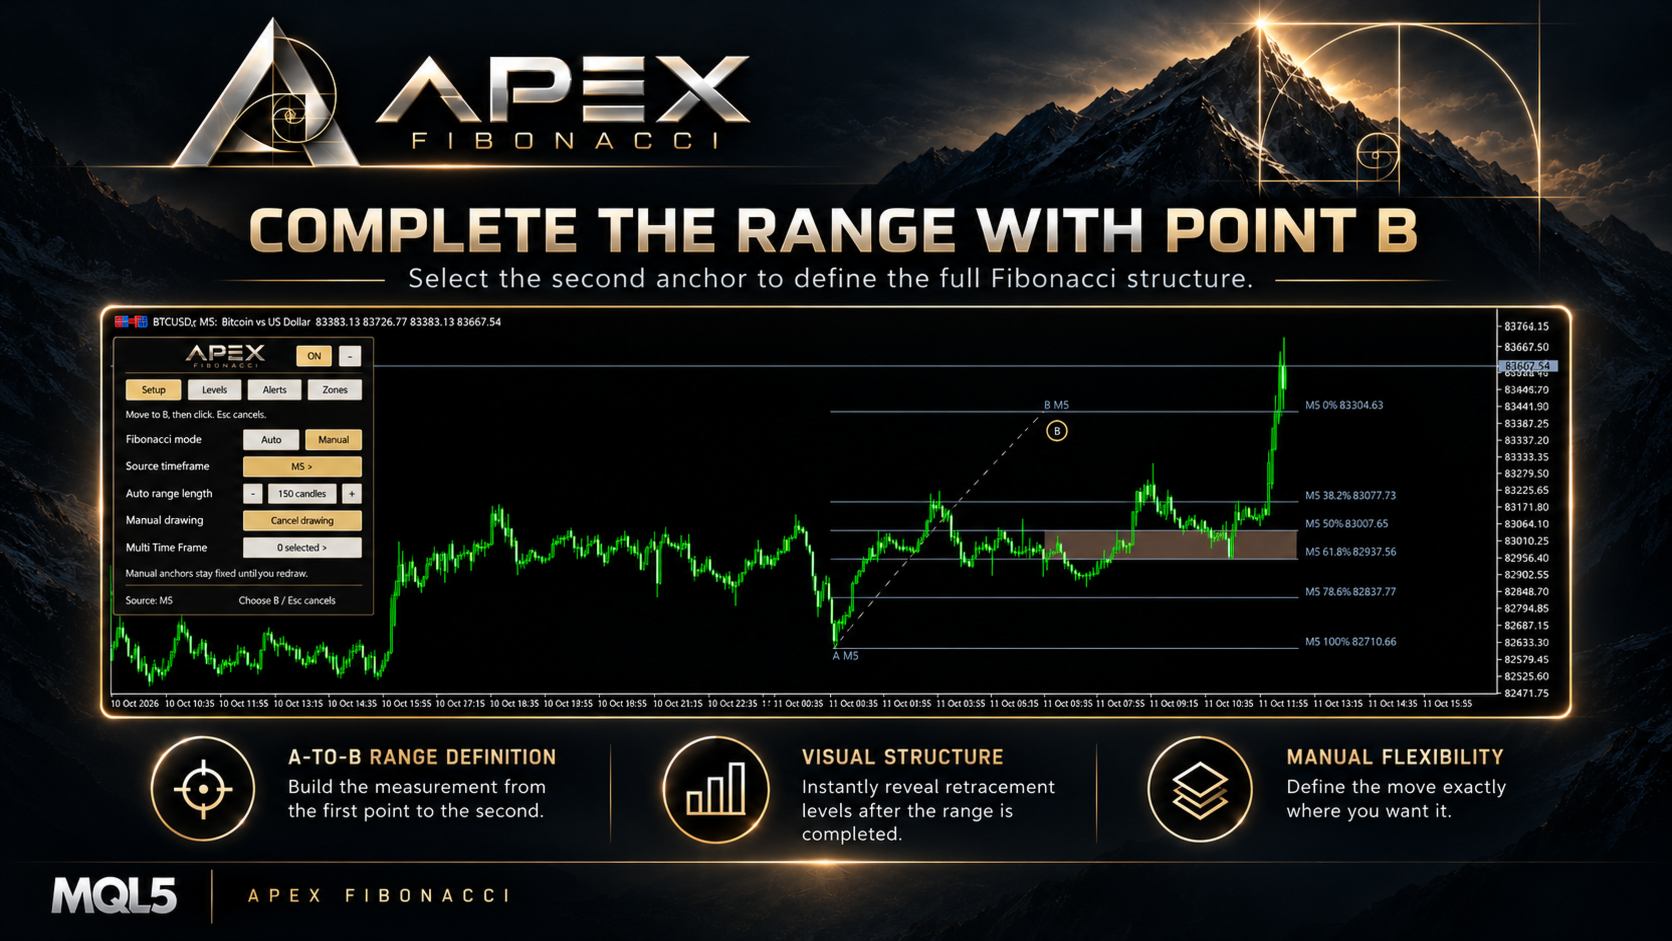
  1. Open the Setup tab and choose Manual.
  2. Click on the chart to place A, the beginning of your chosen price movement.
  3. Move the pointer to preview the second anchor, then click to place B.
  4. Review the Fibonacci lines drawn from your selected prices. Use Redraw A / B when you want to define another movement.

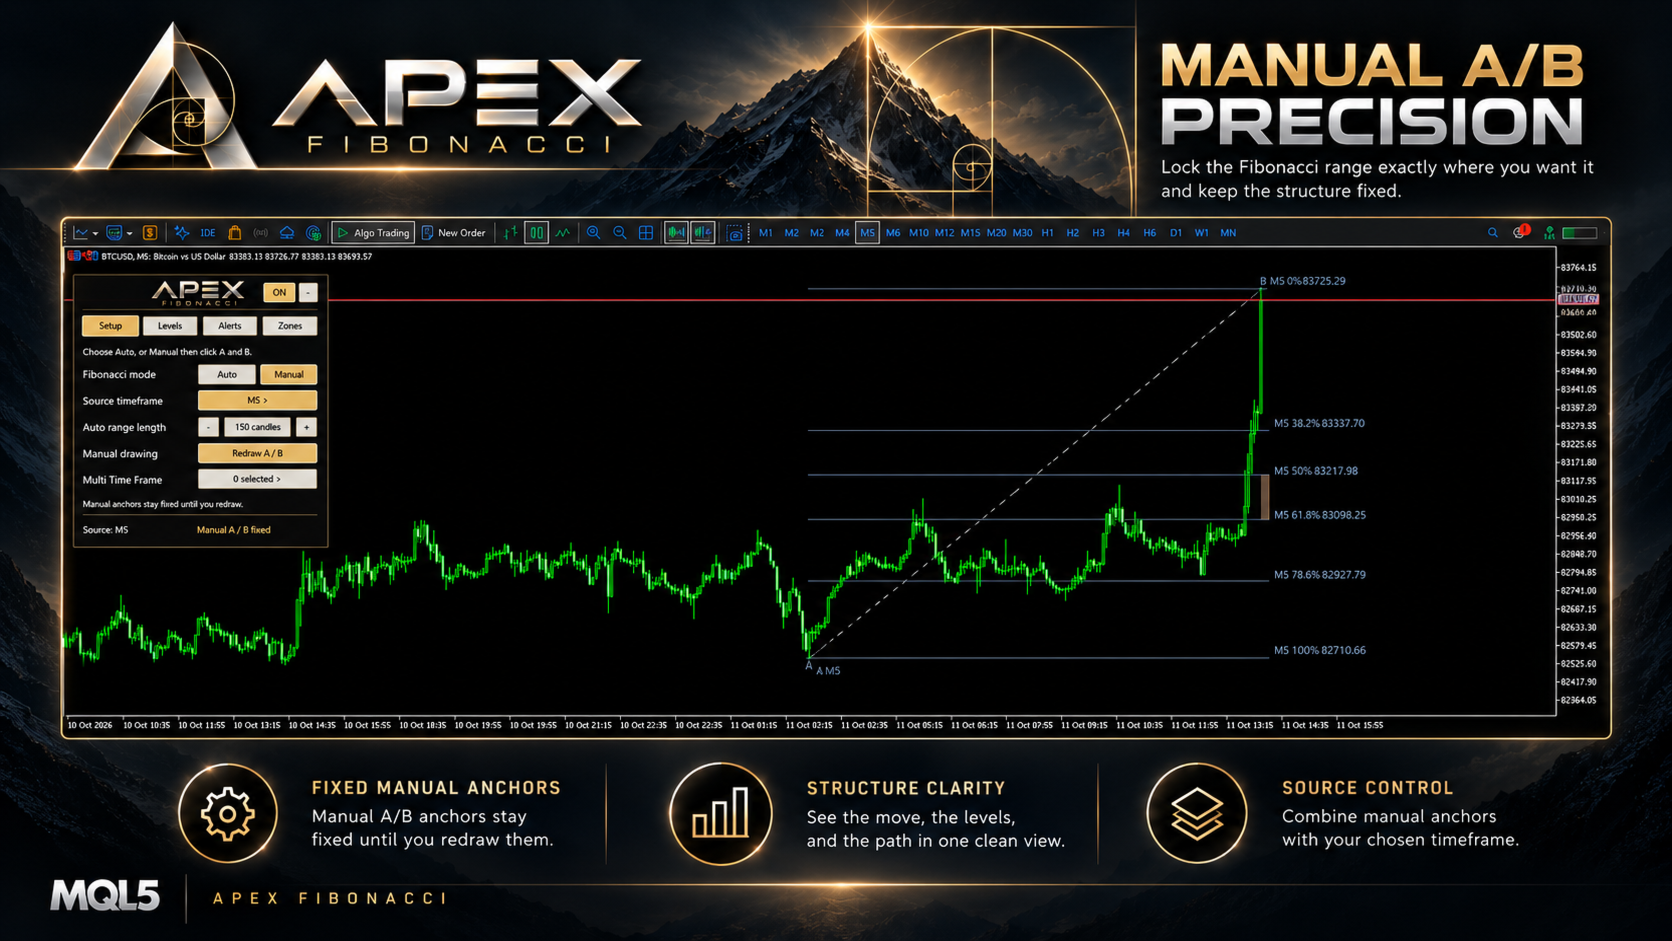
Flexible drawing: The two points are read from chart time and price coordinates. A higher B price creates a bullish range; a lower B price creates a bearish range. The points do not have to be clicked from left to right, but they must have different prices.

Cancel safely: Press Esc during selection to cancel the unfinished drawing. A small chart-side A/B guide follows the selection process.

Fixed anchors: Once the manual drawing is complete, its A and B price coordinates remain fixed until you redraw or change the mode. The manual source timeframe is retained for that selection.

4. Multi-Timeframe Fibonacci on One Chart

Open Multi Time Frame in Setup to select additional Fibonacci overlays. The selector supports the 21 native MetaTrader 5 timeframes, from M1 through MN1, and includes Select All and Cancel All controls.

Independent timeframe selection: Add or remove timeframe overlays with one click. The visible selection remains associated with the selected timeframes even when you change the chart period.

One symbol, several perspectives: Each selected timeframe uses the current chart symbol and its own available candle history to calculate its automatic range. Selected levels appear on the same chart for comparison with the main Fibonacci range.

Clearer overlays: The main range uses its selected line color, while additional timeframe lines are drawn with a muted, dashed appearance. Labels identify their timeframes when there is enough chart space.

Only the timeframes you select are displayed. Additional overlays start disabled on a fresh installation, and duplicate automatic overlays are avoided when they match the main automatic source timeframe.

5. Retracement Levels and Extensions

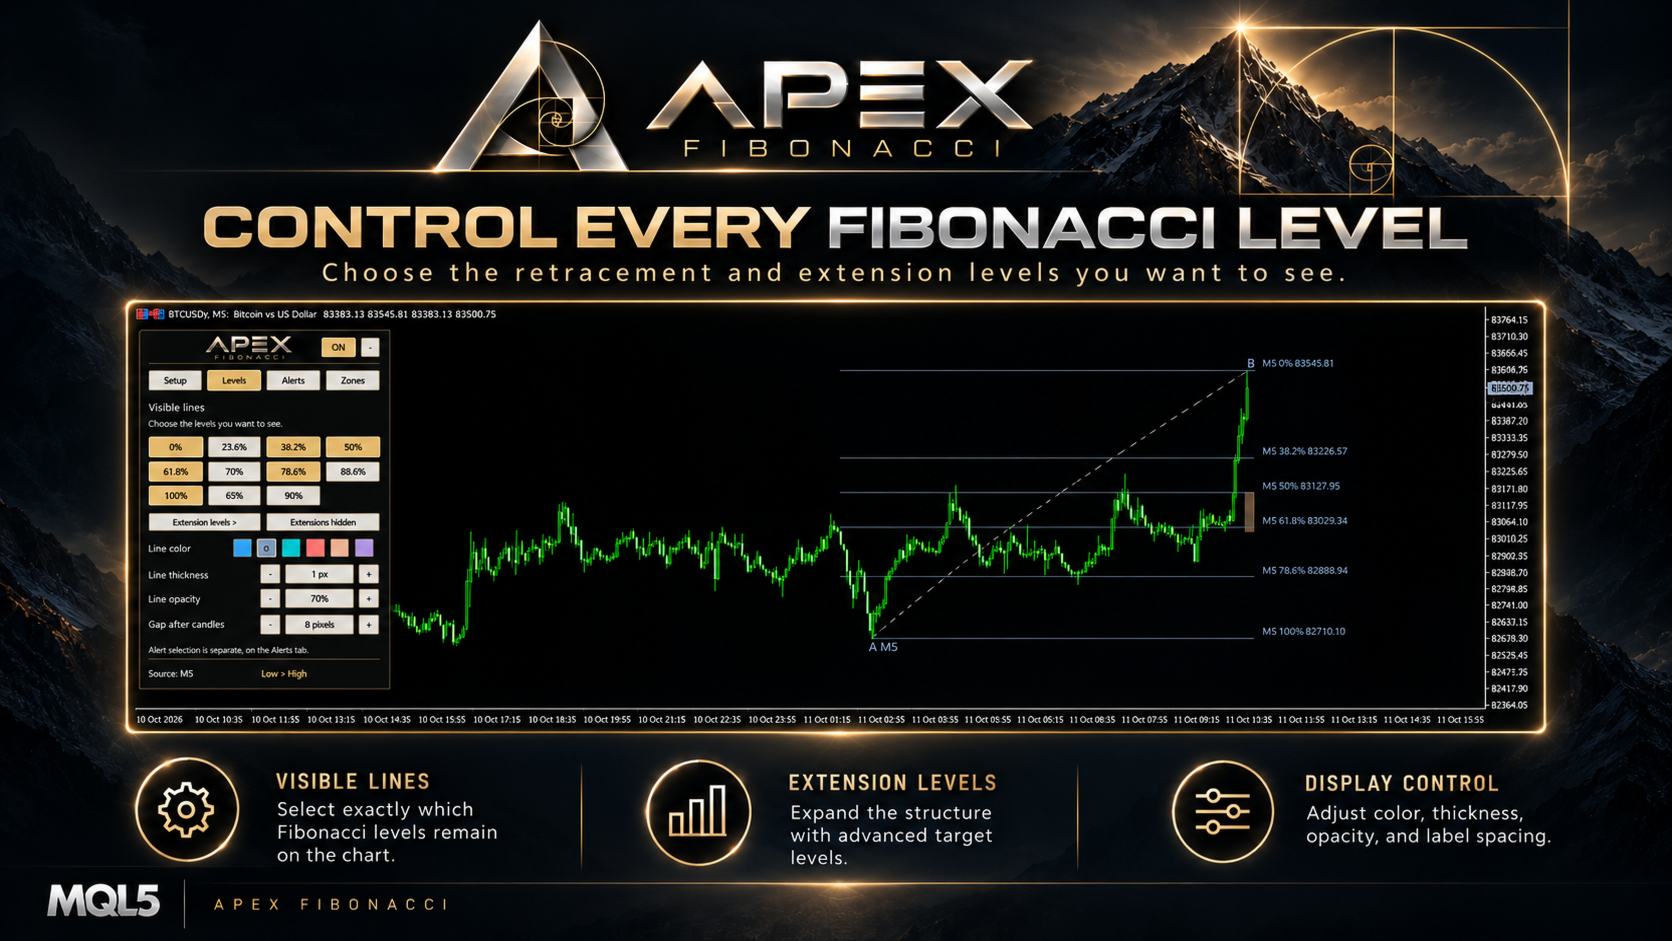
The Levels tab controls which Fibonacci lines appear on the chart. It provides 20 available level positions, with separate controls for the main retracement page and the extension page.

Retracement levels: 0%, 23.6%, 38.2%, 50%, 61.8%, 70%, 78.6%, 88.6%, and 100%, plus two customizable percentages.

Custom retracements: Configure two additional values between 0% and 100% through the indicator Inputs. Their initial values are 65% and 90%. Enable or disable them from the Levels tab.

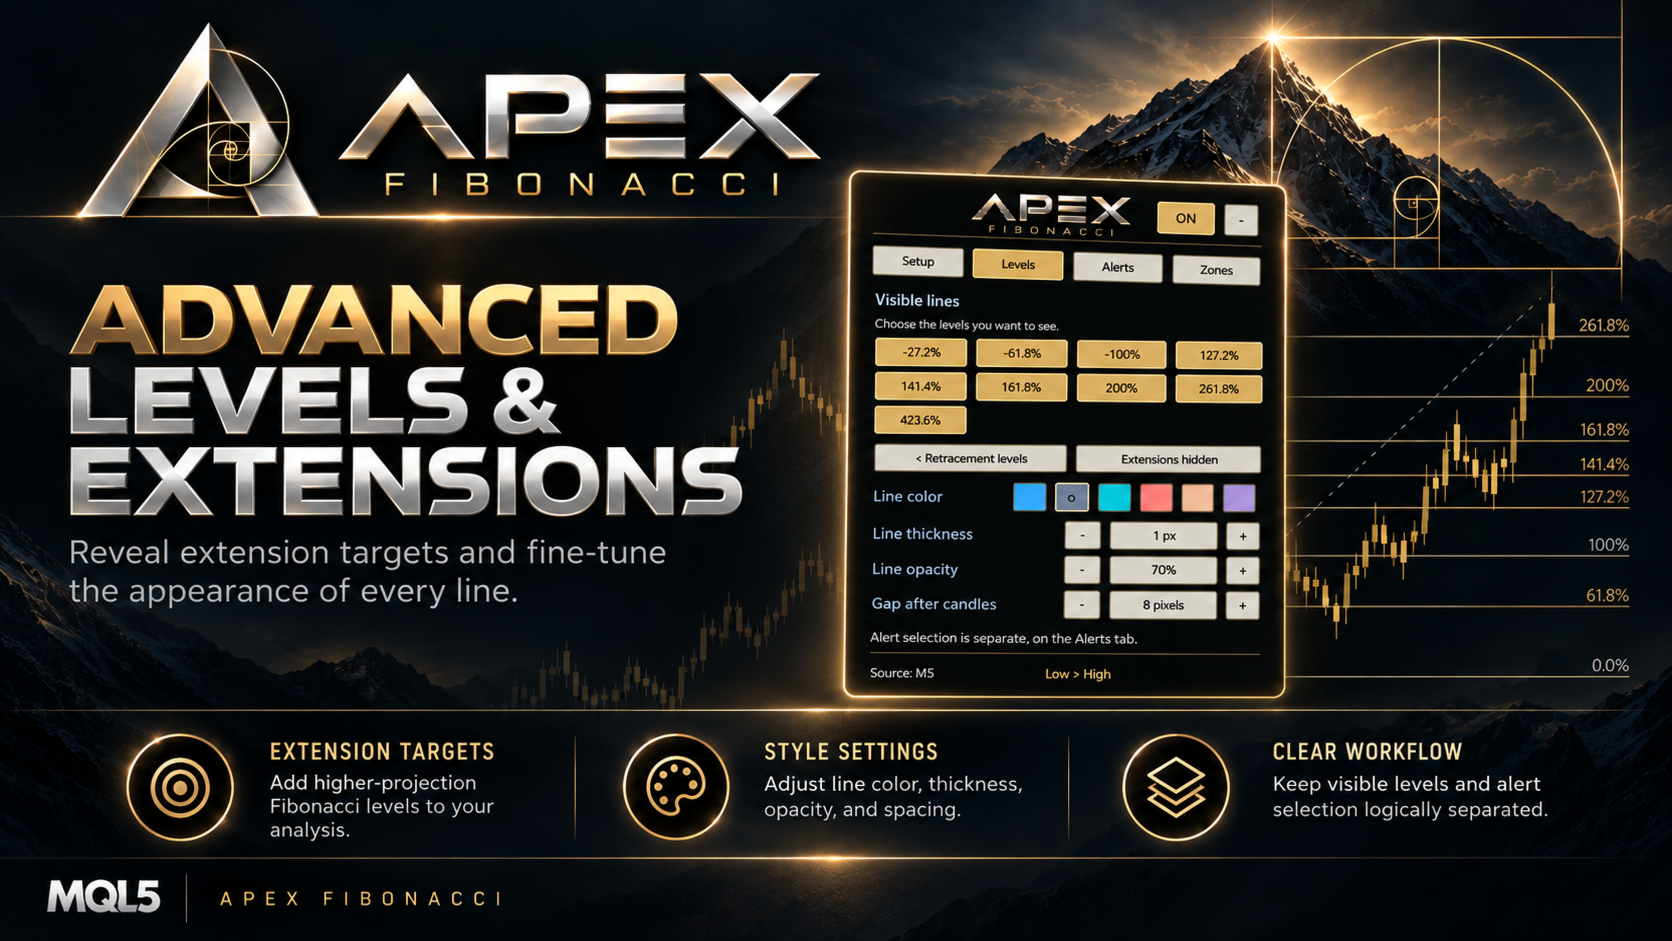
Optional extensions: Turn on extension drawing to use -27.2%, -61.8%, -100%, 127.2%, 141.4%, 161.8%, 200%, 261.8%, and 423.6%. Extension visibility is disabled initially.

No duplicate lines: If a custom percentage matches another enabled level, the same price level is not drawn twice.

Choose visible lines according to the structure you are analyzing. The lines displayed in Levels and the percentages selected for alerts are controlled independently.

6. Four Customizable Retracement Zones

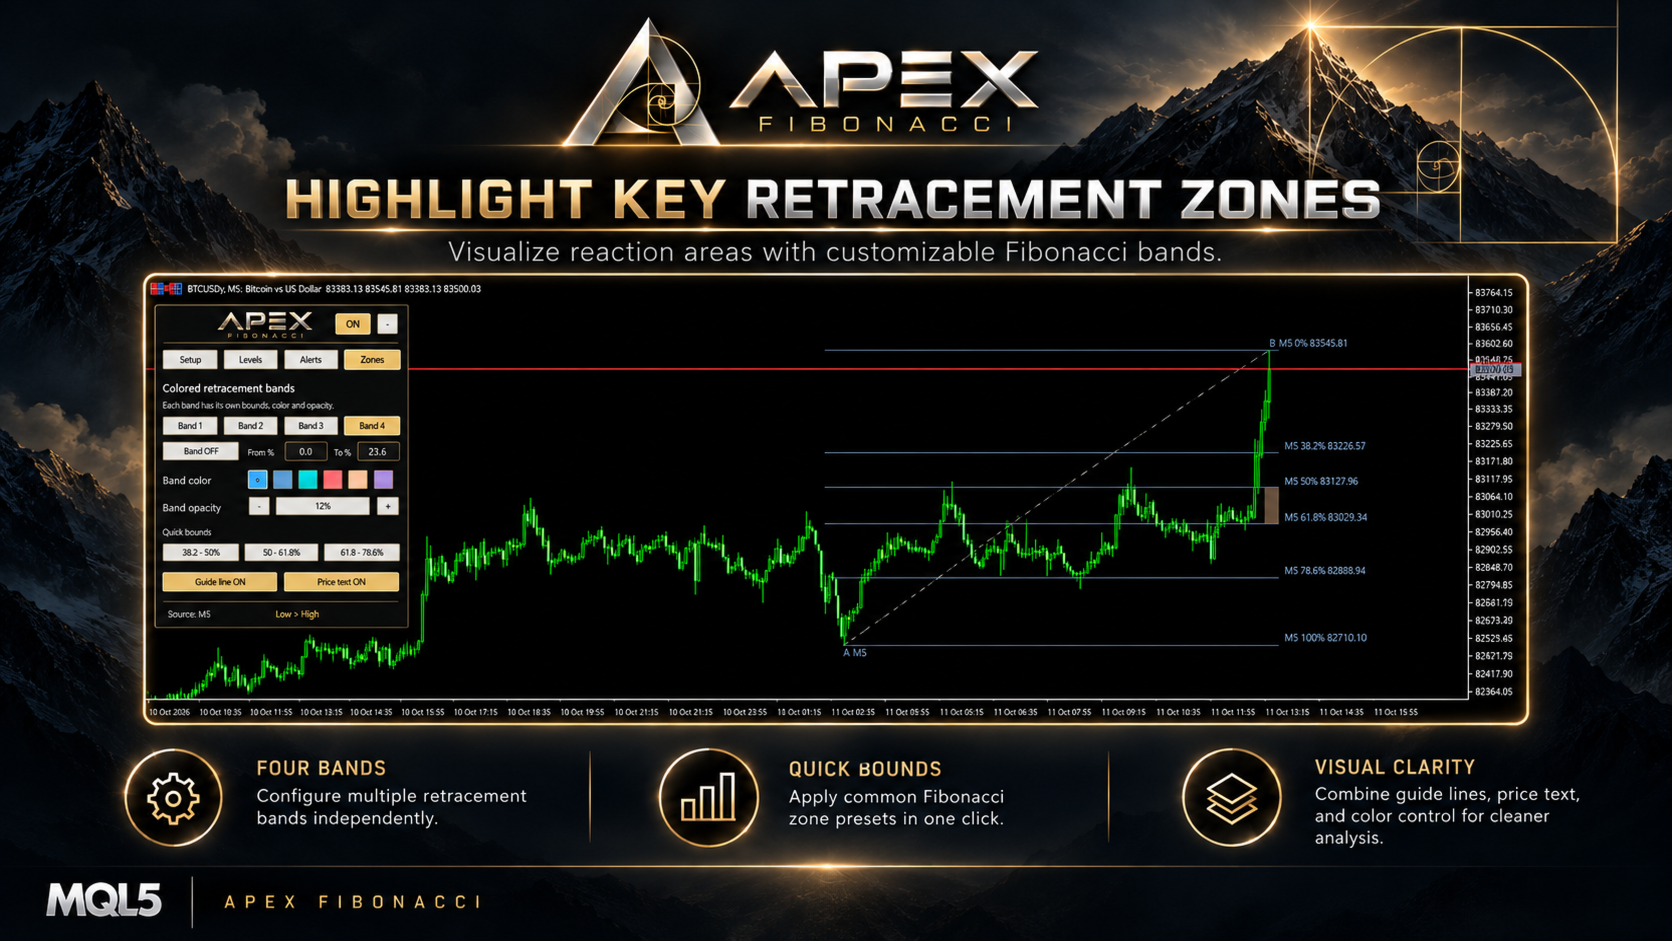
The Zones tab provides up to four independent colored retracement bands around the main Fibonacci range. They help distinguish selected intervals visually without changing the underlying level calculations.

Initial band: Band 1 starts enabled at 61.8% to 78.6%. Bands 2, 3, and 4 start disabled and can be turned on as required.

Editable boundaries: Set the From and To percentages for each band. Zone boundaries accept values from 0% to 100%, and the two limits must be different.

Quick presets: Apply 38.2%-50%, 50%-61.8%, or 61.8%-78.6% to the selected band with one button.

Independent appearance: Select each band's color, opacity, and visibility separately. The filled bands are drawn for the main Fibonacci range; they are not separate filled zones for every additional timeframe.

Use the same tab to show or hide the A-to-B guide line and the price values beside Fibonacci percentage labels.

7. Price Alerts with Separate Level Selection

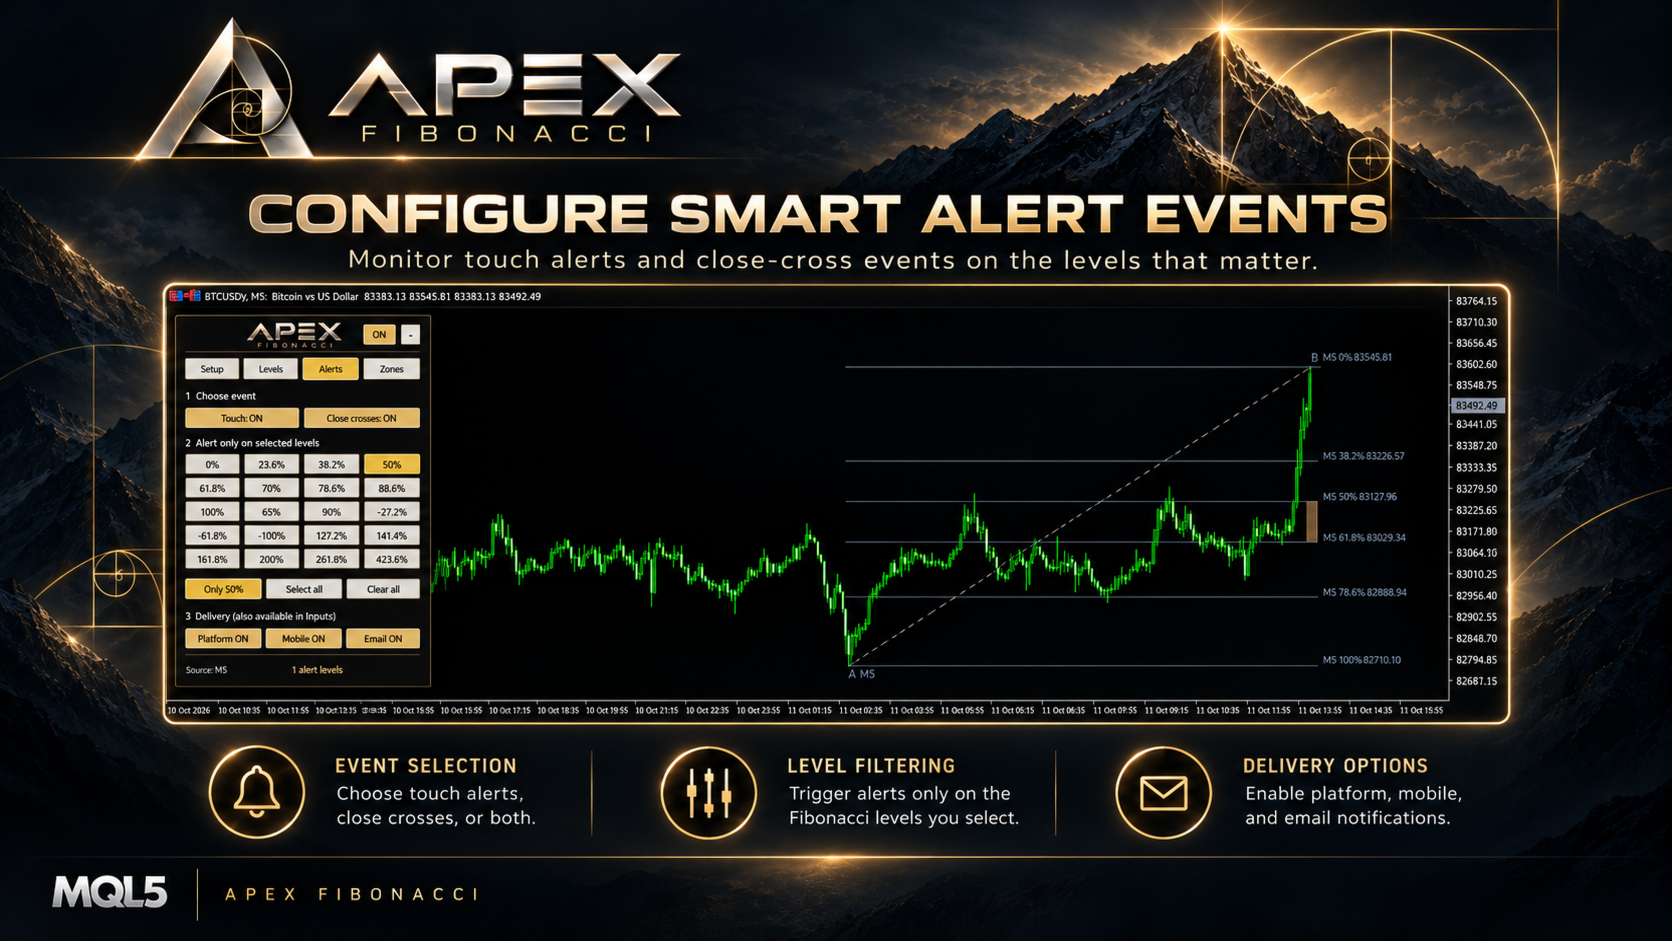
The Alerts tab lets you select which Fibonacci percentages should be monitored for price interaction, regardless of whether those particular lines are currently visible.

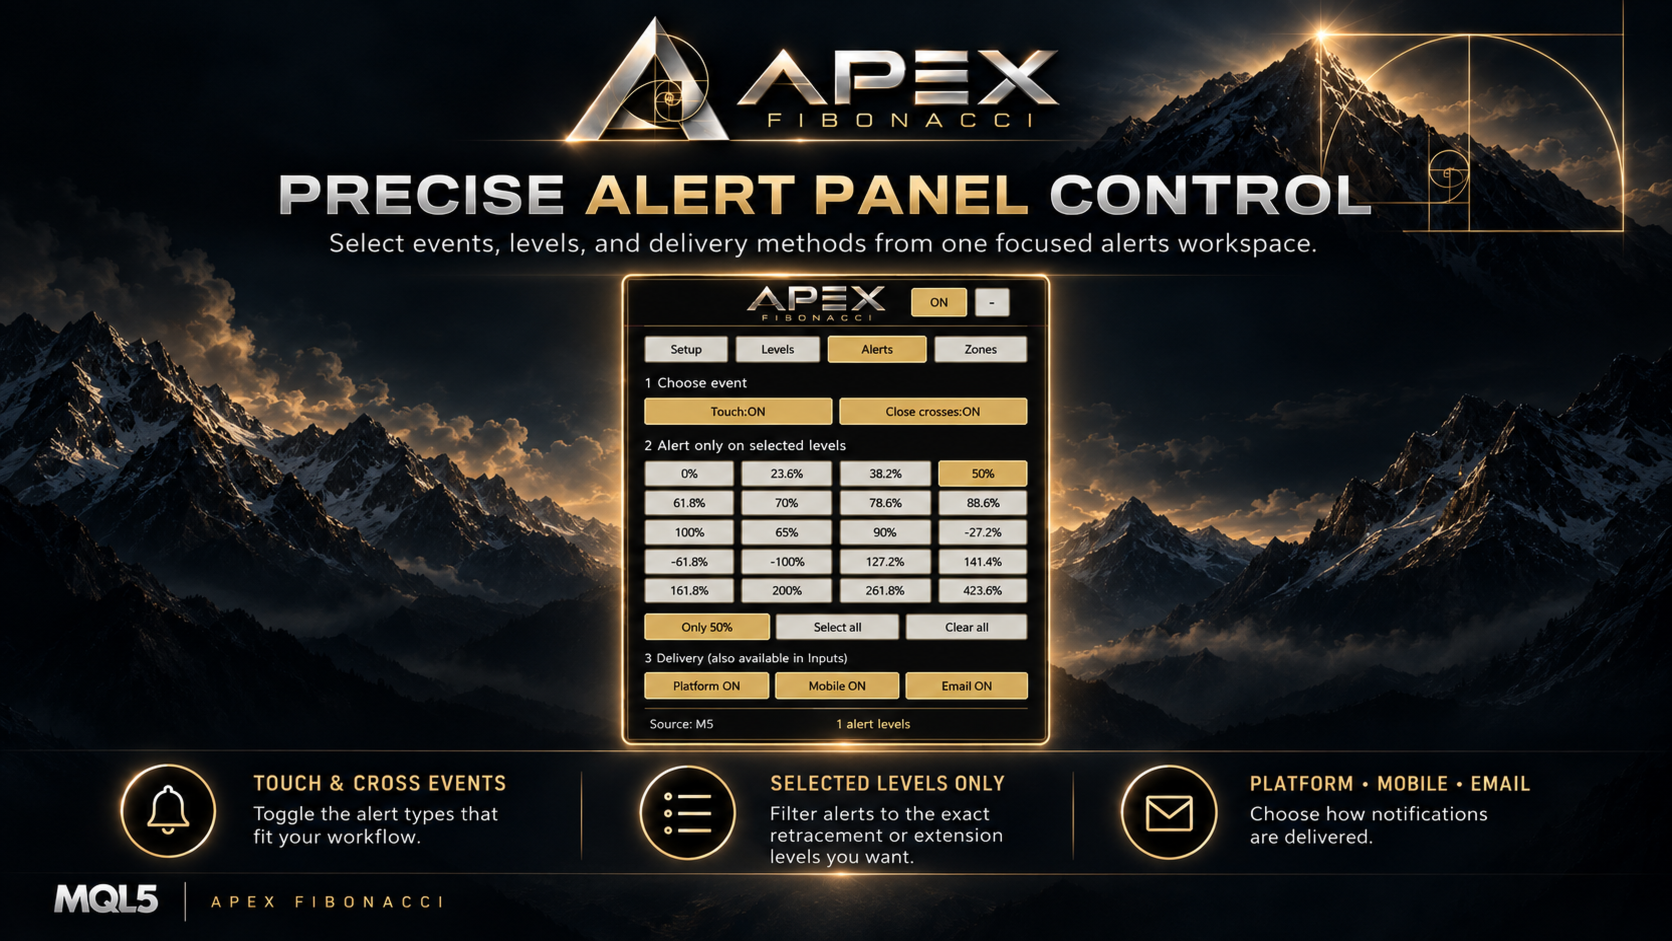
Touch alerts: Receive a notification when price first reaches a monitored level under the indicator's current range-state logic.

Closed-candle cross alerts: Monitor upward or downward crossings confirmed by the closing prices of consecutive source candles. A moving Fibonacci line by itself does not count as a completed candle cross.

Level selection: Select individual percentages or use Only 50%, Select all, and Clear all. Active source and selected multi-timeframe calculations can be monitored.

Delivery options: Choose platform popup alerts, mobile push notifications, and email from the panel. An optional sound file is available in the indicator Inputs. Mobile and email delivery require prior configuration in MetaTrader 5.

Initial state: Touch and cross alerts are disabled by default. The initial 50% alert-level selection does not send notifications unless an event type is enabled. Historical events are not replayed as new alerts when the indicator is attached.

8. A Floating Panel Organized into Four Tabs

Setup: Switch Auto/Manual mode, select the source timeframe, change the auto lookback, choose Live or Closed Candles, and open the multi-timeframe selector.

Levels: Control retracement and extension visibility, line color, thickness, opacity, and the gap after the most recent visible candle.

Alerts: Enable touch or closed-candle cross events, choose monitored levels, and select notification delivery methods.

Zones: Enable and edit four retracement bands, use quick range presets, and switch the guide line or price labels on and off.

The expanded panel can be repositioned by dragging its header. It can also be collapsed into a compact logo and reopened by clicking it. Panel sizing adapts to the chart area and the terminal display scale.

Chart labels are positioned near the most recent visible candles. When there is insufficient space, overlapping or out-of-view labels may be omitted rather than moved to an incorrect price position; the corresponding line tooltip retains the level and price information.

9. Personalize the Chart Display

Line styling: Set thickness from 1 to 5 pixels, line opacity from 0% to 100%, and choose a color from the available palette. Additional timeframe overlays use their own muted presentation.

Zone appearance: Change each band's opacity, color, and range independently. The main A/B guide and price display can be toggled.

10. Practical Ways to Use Apex Fibonacci

Follow a developing movement: Choose Auto mode and a source timeframe, set the lookback period, and compare how the range behaves in Live mode and Closed Candles mode.

Measure a specific swing: Select Manual mode, place A and B around the movement you want to study, and highlight the retracement interval that matters to your analysis.

Compare timeframes: Keep the main Fibonacci range visible, then add selected higher or lower timeframe overlays to observe where levels are near each other.

Monitor a reference level: Enable a selected alert percentage, choose touch or closed-candle cross events, and activate the preferred notification method.

11. Quick Start

  1. Attach Apex Fibonacci to a MetaTrader 5 chart.
  2. In Setup, choose Auto or Manual and select the timeframe or A/B anchors.
  3. Open Levels to select the percentages and optional extensions to display.
  4. Use Zones to highlight one or more retracement intervals.
  5. Open Multi Time Frame when you want to compare additional periods.
  6. Configure Alerts only if you want notifications for chosen price interactions.

12. Important Information

Apex Fibonacci is a visual price-analysis indicator. Its automatic anchors are based on a rolling window of broker price candles and can change when new price extremes occur. Closed Candles mode excludes the current forming source candle, while a finished manual A/B selection remains fixed until it is redrawn.

Fibonacci lines are analytical reference levels, not confirmed support or resistance and not trade signals. The indicator does not open, manage, or close trades. Price alerts report interactions with the configured levels and should not be interpreted as buy or sell instructions.

Calculations and visibility depend on the available broker price history, selected timeframes, chart space, and terminal notification configuration.

Produits recommandés
Free automatic Fibonacci is an indicator that automatically plots a Fibonacci retracement based on the number of bars you select on the BarsToScan setting in the indicator. The Fibonacci is automatically updated in real time as new highest and lowest values appears amongst the selected bars. You can select which level values to be displayed in the indicator settings. You can also select the color of the levels thus enabling the trader to be able to attach the indicator several times with differe
FREE
Développement de la version précédente de l'indicateur ZigZag WaveSize MT4 ZigZag WaveSize - indicateur standard ZigZag modifié avec ajout d'informations sur la longueur d'onde en points, niveaux et différentes logiques d'alertes Améliorations générales : Adaptation du code pour MetaTrader 5 Travail optimisé avec les objets graphiques Nouveautés : Niveaux horizontaux aux extrêmes Choix du type de niveaux : horizontal/rayons/segments Filtre de niveaux liquides (non percés par le prix) Tampon po
FREE
TrendVision AI
Murtadha Majid Jeyad Al-Khuzaie
TrendVision AI – Smart Trend Channels & Price Forecasting for MetaTrader 5 Discover market structure and explore potential future price direction with TrendVision AI, an advanced technical indicator for MetaTrader 5 that combines automatic trendline analysis with a machine-learning-based price forecasting model. How Does TrendVision AI Work? TrendVision AI analyzes historical candlestick data within a configurable lookback window. It automatically draws two trendlines directly on the chart:
FREE
PZ Penta O MT5
PZ TRADING SLU
3.8 (5)
The Penta-O is a 6-point retracement harmonacci pattern which usually precedes big market movements. Penta-O patterns can expand and repaint quite a bit. To make things easier this indicator implements a twist: it waits for a donchian breakout in the right direction before signaling the trade. The end result is an otherwise repainting indicator with a very reliable trading signal. The donchian breakout period is entered as an input. [ Installation Guide | Update Guide | Troubleshooting | FAQ | A
FREE
Donchian Breakout And Rsi
Mattia Impicciatore
4.5 (2)
Description générale Cet indicateur est une version améliorée du Canal Donchian classique, enrichie de fonctionnalités pratiques pour le trading réel. En plus des trois lignes standard (supérieure, inférieure et ligne médiane), le système détecte les cassures et les affiche visuellement avec des flèches sur le graphique, en montrant uniquement la ligne opposée à la direction actuelle de la tendance pour une lecture plus claire. L’indicateur comprend : Signaux visuels : flèches colorées lors des
FREE
The indicator highlights the points that a professional trader sees in ordinary indicators. VisualVol visually displays different volatility indicators on a single scale and a common align. Highlights the excess of volume indicators in color. At the same time, Tick and Real Volume, Actual range, ATR, candle size and return (open-close difference) can be displayed. Thanks to VisualVol, you will see the market periods and the right time for different trading operations. This version is intended f
FREE
MACD Enhanced
Nikita Berdnikov
4 (4)
Introducing the MACD  Enhanced – an advanced MACD (Moving Average Convergence Divergence) indicator that provides traders with extended capabilities for trend and momentum analysis in financial markets. The indicator uses the difference between the fast and slow exponential moving averages to determine momentum, direction, and strength of the trend, creating clear visual signals for potential entry and exit points. Attention! To achieve the best results, it is recommended to adapt the indicator
FREE
Auto Fibonacci displays the 38.2, 61.8, and 78.6 Fib levels directly on the chart, helping traders who use these key retracement zones consistently for trade planning or confluence. Drawing Fibonacci levels manually over and over again can take time, especially when done with wick-to-wick precision. Auto Fibonacci removes that friction by detecting the latest trend leg and placing the main Fibonacci levels automatically. Key Benefits Shows only the major Fibonacci levels to keep the chart clean
FREE
L'indicateur de cadre temporel Wormhole pour MetaTrader 5 (MT5) n'est pas simplement un autre outil de trading, c'est votre avantage concurrentiel sur les marchés financiers. Conçu pour les traders novices et professionnels, le Wormhole transforme la manière dont vous analysez les données et prenez des décisions, vous assurant ainsi de toujours être un pas en avant. Pourquoi vous avez besoin de l'indicateur Wormhole (gratuit) Surpassez la concurrence : La possibilité d'afficher deux cadres tempo
FREE
Automatic fibonacci with alerts is an indicator that automatically plots a fibonacci retracement based on the number of bars you select on the BarsToScan setting in the indicator. The fibonacci is automatically updated in real time as new highest and lowest values appear amongst the selected bars. You can select which level values to be displayed in the indicator settings. You can also select the color of the levels thus enabling the trader to be able to attach the indicator several times with d
FREE
Indicator Description 4 Hull MA Color + Envelopes is a powerful trend-following indicator for MetaTrader 5 that combines four Hull Moving Averages (HMA) with Moving Average Envelopes to clearly identify market direction, trend strength, and potential reversal or pullback zones. This indicator is designed to reduce noise, react quickly to price movement, and provide a clean visual structure for professional trading.   Key Features   4 Hull Moving Averages (20, 50, 100, 200) Automatic color change
FREE
Are you tired of drawing trendlines every time you're analyzing charts? Or perhaps you would like more consistency in your technical analysis. Then this is for you. This indicator will draw trend lines automatically when dropped on a chart. How it works Works similar to standard deviation channel found on mt4 and mt5. It has 2 parameters: 1. Starting Bar 2. Number of bars for calculation The   starting bar   is the bar which drawing of the trend lines will begin, while the   number of bars for c
FREE
TV MACD Pro + SNR Support/Resistance is a professional trading tool that combines TradingView-style MACD with adaptive Support & Resistance detection. This indicator includes two core modules that can be turned on or off independently. MACD Module: Features authentic TradingView MACD color scheme, teal/red histogram with volume and shrinkage differentiation. Adjustable parameters include Fast EMA (default 12), Slow EMA (default 26), Signal SMA (default 9), and histogram scale. SNR Module: Au
FREE
Intraday Spark Chart Overview Intraday Spark Chart is an MT5 indicator for intraday analysis. It converts the current price change of a symbol into a percentage of the daily opening price and plots the result in a separate subwindow. Every trading day starts again from the zero line, so each day is drawn as a separate segment and the intraday move of the current day can be observed directly. The indicator is a data visualization tool. It does not generate trading signals and does not provide inv
FREE
Donchian Pro
Paulo Henrique Faquineli Garcia
5 (3)
The Donchian Channel Channels are among the most popular tools of technical analysis, as they visually convey to the analyst the limits within which most price movement tends to occur. Channel users know that valuable information can be obtained at any time, whether prices are in the central region of a band or close to one of the border lines. One of the best known techniques to explore these concepts is Bollinger Bands. However, John Bollinger was not the only one to research the application
FREE
Haven Key Levels PDH PDL
Maksim Tarutin
4.92 (12)
L'indicateur   "Haven Key Levels PDH PDL"   aide les traders à visualiser les niveaux clés sur le graphique. Il marque automatiquement les niveaux suivants : DO (Daily Open)   — Niveau d'ouverture du jour. NYM (New York Midnight)   — Niveau de minuit à New York. PDH (Previous Day High)   — Plus haut du jour précédent. PDL (Previous Day Low)   — Plus bas du jour précédent. WO (Weekly Open)   — Niveau d'ouverture de la semaine. MO (Monthly Open)   — Niveau d'ouverture du mois. PWH (Previous Week
FREE
PROMETHEUS TECHNICAN VERSION Free | By THE SONS A gift from The Sons — no strings, no trial, no expiry. Every trader deserves access to professional-grade market intelligence. That belief is why Prometheus Technical Version exists, and why it costs nothing. Consider it our handshake to the trading community. What You're Getting This is not a simplified tool dressed up as a gift. Prometheus Technican Version is a fully built, institutional-quality technical analysis indicator running a dual-model
FREE
1. Overview The ATR Dynamic Stop (CE) is a powerful technical indicator designed to help traders identify and follow market trends. Its core function is to provide a dynamic trailing stop-loss based on price volatility, as measured by the Average True Range (ATR) indicator. The main objectives of the ATR Dynamic Stop are: Profit Optimization: It helps you ride a strong trend by setting a reasonable stop-loss, preventing premature exits due to minor market noise and fluctuations. Risk Management:
FREE
This indicator automatically identifies liquidity levels using swing fractals and tracks when price sweeps through them. Works on any symbol and timeframe with full multi-timeframe support. Features: — Detects swing highs and lows via a fractal method (configurable bars left & right) on a selected timeframe. Active levels are displayed as rays extending to the right; swept levels turn into dashed lines ending at the sweep candle. — Plots Previous Day (PDhigh / PDlow), Previous Week (PWhigh / PWl
FREE
RSI abcd
Francisco Gomes Da Silva
4.33 (3)
Détecteur de Motif ABCD RSI : Stratégie Technique 1. Fonctionnement de l'Indicateur Combine le RSI classique avec la détection automatique de motifs harmoniques ABCD . Composants Clés RSI standard (période ajustable) Marqueurs de sommets et creux (flèches) Motifs ABCD (lignes vertes/rouges) Filtres de surachat (70) et survente (30) 2. Configuration sur MT5 period = 14 ; // Période RSI size = 4 ; // Taille maximale du motif OverBought = 70 ; // Niveau de surachat OverSold = 30 ; // Niveau de surv
FREE
Pivot Points Indicator – a fast, reliable, and fully customizable pivot detection for MetaTrader 5. This indicator uses MetaTrader’s native iHighest and iLowest functions to identify pivot highs and lows by scanning for the highest and lowest prices within a user-defined window of bars. A pivot is confirmed only when the current bar is the absolute maximum or minimum within the selected range, ensuring accurate and timely signals based on robust built-in logic. Key Features No Repainting : Onc
FREE
L'indicateur montre des niveaux ronds sur le graphique. Ils sont également appelés niveaux psychologiques, niveaux de banque ou niveaux des principaux acteurs. À ces niveaux, il y a une véritable lutte entre les haussiers et les baissiers, une accumulation de nombreux ordres, ce qui entraîne une volatilité accrue. L'indicateur s'adapte automatiquement à tout instrument et à toute période. Si le niveau 80 est cassé puis testé, il faut acheter. Si le niveau 20 est cassé puis testé, vendre. L'obje
FREE
Follow The Line MT5
Oliver Gideon Amofa Appiah
4.6 (35)
This indicator obeys the popular maxim that: "THE TREND IS YOUR FRIEND" It paints a GREEN line for BUY and also paints a RED line for SELL. (you can change the colors). It gives alarms and alerts of all kinds. IT DOES NOT REPAINT and can be used for all currency pairs and timeframes. Yes, as easy and simple as that. Even a newbie can use it to make great and reliable trades. NB: For best results, get my other premium indicators for more powerful and reliable signals. Get them here: https://www.m
FREE
This is a buyer and seller aggression indicator that analyzes the shape of each candle and project this data in a histogram form. There are 4 histograms in one. On the front we have two: Upper - Buyer force. Lower - Seller force. At the background we also have two histogram, both with same color. They measure the combined strenght of buyers and sellers. This histograms can be turned off in Input Parameters. It is also possible to have the real or tick volume to help on this force measurement. IN
FREE
MT4 Version Most indicators draw lines. This one draws the battlefield. If you ever bought an EA or indicator based on a perfect equity curve — and then watched it bleed out live — you’re not alone. The problem? Static logic in a dynamic market. Fibonacci Bollinger Bands   adapts. It combines Bollinger structure with customizable Fibonacci levels to mark   zones of control   — where price reacts, pauses, or reverses. No magic. Just logic that follows volatility. Why this tool matters   It
FREE
How it works –   Base-departure detection — algorithmically finds consolidation bases (overlapping range with compressed volatility) followed by displacement departures. Patterns: Drop-Base-Rally, Rally-Base-Drop, Rally-Base-Rally, Drop-Base-Drop — detected structurally, not by candle names. –   Strength score (0–100) — from departure velocity, time-at-base, freshness (each revisit decays the score), higher-timeframe confluence and origin volume. –   Lifecycle — Fresh, Tested (decaying), Broken
FREE
FibRetrace Zones Zones de retracement de Fibonacci du dernier mouvement FibRetrace Zones est le compagnon visuel gratuit de l'Expert Advisor FibRetrace. Il trace les niveaux de retracement de Fibonacci et met en évidence la zone de repli du dernier mouvement, pour que vous voyiez où se situent les entrées avant de trader. La zone est colorée selon la direction : vert pour les configurations haussières, rouge pour les baissières. Fonctionne sur tout symbole et toute unité de temps. FONCTIONNALITÉ
FREE
MSX Hybrid Heiken Scalper
Som Prakash Gehlot
5 (1)
MSX Hybrid Heiken Scalper Overview MSX Hybrid Heiken Scalper is a MetaTrader 5 indicator based on a modified Heiken Ashi methodology with closed-bar smoothing. The indicator is designed to display trend direction through color-coded candles while reducing sensitivity to short-term market fluctuations. All calculations are performed using completed candles, allowing historical values to remain fixed after bar close. Features • Modified Heiken Ashi calculation • Closed-bar processing • Color-code
FREE
LT Donchian Channel
Thiago Duarte
4.86 (7)
Donchian Channel is an indicator created by Richard Donchian. It is formed by taking the highest high and the lowest low of the last specified period in candles. The area between high and low is the channel for the chosen period. Its configuration is simple. It is possible to have the average between the upper and lower lines, plus you have alerts when price hits one side. If you have any questions or find any bugs, please contact me. Enjoy!
FREE
Fibonacci Trend Indicator
Vinoth Durairaj Durairaj
Fibonacci Trend Indicator for MT5 Unlock the power of Fibonacci analysis on your MetaTrader 5 charts! Our   Fibonacci Trend Indicator   automatically plots dynamic support and resistance levels so you can spot trends, reversals, and breakout opportunities at a glance. Features & Advantages Automatic Fibonacci Levels Instantly displays seven key Fibonacci retracement levels based on the highest and lowest prices from your chosen lookback period — no manual work required. Dynamic Trend Adaptatio
FREE
Les acheteurs de ce produit ont également acheté
Trend Sniper X
Sarvarbek Abduvoxobov
4.9 (41)
Trend Sniper X est un indicateur de suivi de tendance multi-unités de temps pour MetaTrader 5 qui aide les traders à identifier la direction de la tendance et les points d'inversion potentiels avec clarté et précision. pour MT4: https://www.mql5.com/en/market/product/193245 Informations sur le prix : Le prix actuel est un prix promotionnel et est susceptible de changer lors des prochaines mises à jour et nouvelles fonctionnalités. Offre bonus : Pour obtenir GRATUITEMENT l'Auto-Trade Assistant E
Smart Trend Trading System — MetaTrader 5 Après votre achat, envoyez-moi un message sur MQL5 pour recevoir GRATUITEMENT Smart Universal Expert Advisor, ainsi que le cours en ligne, le manuel PDF et l’accès au groupe privé. STTS réunit la direction de la tendance, les signaux d’entrée et de sortie, les zones de retournement et les niveaux de prix importants directement sur votre graphique. Suivez le système manuellement ou connectez un EA compatible distinct pour une exécution automatique selon l
Zoryk Gold
Reda El Koutbane
5 (16)
ZORYK — Système avancé de signaux XAUUSD pour MetaTrader 5 Vous connaissez certainement cette sensation. Vous passez du temps à analyser l’or. Vous attendez le bon point d’entrée. Vous ouvrez enfin la position, puis le prix commence immédiatement à évoluer contre vous. Vous fermez trop tôt, déplacez le Stop Loss ou hésitez pendant quelques secondes. Ensuite, le marché atteint exactement l’objectif que vous aviez initialement prévu, mais sans vous dans la position. Le problème n’était pas toujour
SuperScalp Pro
Van Minh Nguyen
4.56 (36)
SuperScalp Pro - Professional Multi-Layer Confluence Scalping System SuperScalp Pro est un indicateur avancé de scalping qui améliore le Supertrend classique grâce à plusieurs filtres intelligents de confirmation. Il aide à identifier des opportunités de Buy/Sell présentant une probabilité plus élevée, tout en réduisant considérablement les faux signaux. Des flèches Buy et Sell claires apparaissent directement sur le graphique, tandis que les niveaux de Stop Loss et Take Profit basés sur l’ATR s
Un nouveau Roi en ville - Indicateur + Gestion des ordres (TP1 + TP2 + TP3) + Envoi optionnel de signaux Telegram INCLUS (GRATUIT) (SYSTÈME COMPLET DE TRADING et DE SIGNAUX) Notre meilleur EA pour l’Or : Gold Slayer Cet indicateur inclut une stratégie avancée, un système de trading avec gestion des ordres personnalisable ainsi qu’un système de retour à la moyenne combinant des extensions d’enveloppes, soutenu par plusieurs filtres intelligents de confirmation comme le RSI afin de détecter des en
SMC Intraday Formula
VividMind Digital Solutions
5 (26)
Commençons par être honnêtes. Aucun indicateur ne vous rendra rentable à lui seul. Si quelqu’un vous dit le contraire, il vous vend un rêve. Tout indicateur qui affiche des flèches parfaites d’achat/vente peut être rendu impeccable — il suffit de zoomer sur la bonne partie de l’historique et de capturer uniquement les trades gagnants. Nous ne faisons pas cela.  SMC Intraday Formula est un outil. Il lit la structure du marché pour vous, identifie les zones de prix à la probabilité la plus élevée
GoldenX Entry MT5
VividMind Digital Solutions
5 (16)
GoldenX Entry est un indicateur MT5 doté d’un algorithme adaptatif Smart Entry Trend, d’un système de scoring des signaux, d’un détecteur de régime de marché et d’un filtre de volatilité. Chaque signal inclut un niveau d’entrée calculé, trois niveaux de Take-Profit (TP1, TP2, TP3) ainsi qu’un niveau de Stop-Loss. Il est construit sur plusieurs couches analytiques conçues pour s’adapter à différentes conditions de marché, combinant un système analytique multicouche avec un optimiseur intégré et u
La légende est de retour : Entry Points Pro 10. La relance de l'indicateur légendaire qui s'est maintenu 3 ans dans le Top-3 du MQL5 Market. Des centaines d'avis enthousiastes (589 sur les deux versions), des milliers de traders l'utilisent chaque jour, 31 000+ téléchargements de la démo   MT4+MT5 . J'ai lu chacun de vos avis publiés en cinq ans — et au lieu de promettre, j'ai intégré les réponses directement dans la version 10. Par un auteur présent sur les marchés depuis 1999, qui tient à l'ho
Gann Made Easy   est un système de trading Forex professionnel et facile à utiliser qui est basé sur les meilleurs principes de trading en utilisant la théorie de mr. WD Gann. L'indicateur fournit des signaux d'ACHAT et de VENTE précis, y compris les niveaux Stop Loss et Take Profit. Vous pouvez échanger même en déplacement en utilisant les notifications PUSH. VEUILLEZ ME CONTACTER APRÈS L'ACHAT POUR RECEVOIR GRATUITEMENT DES INSTRUCTIONS DE TRADING ET D'EXCELLENTS INDICATEURS SUPPLÉMENTAIRES! V
ARIPoint
Temirlan Kdyrkhan
1 (4)
ARIPoint is a powerful trading companion designed to generate high-probability entry signals with dynamic TP/SL/DP levels based on volatility. Built-in performance tracking shows win/loss stats, PP1/PP2 hits, and success rates all updated live. Key Features: Buy/Sell signals with adaptive volatility bands Real-time TP/SL/DP levels based on ATR Built-in MA Filter with optional ATR/StdDev volatility Performance stats panel (Success, Profit/Loss, PP1/PP2) Alerts via popup, sound, push, or email Cu
Gardez votre avantage de trading dans votre ligne de mire ! M5 Sniper est un nouvel indicateur de MeanFX. Il combine des signaux de trading précis avec des niveaux de TP/SL adaptatifs — créant ainsi les meilleures opportunités de trading statistiques possibles ! Le prix augmente tous les 5 achats, le prochain prix est de 69$ Envoyez-moi un message après l’achat pour recevoir des conseils/un guide et un EA bonus Qu’est-ce qui le distingue ? Performance statistique éprouvée sur Gold XAUUSD ( fonct
Neuro Poseidon MT5
Daria Rezueva
4.75 (52)
Neuro Poseidon is a new indicator by Daria Rezueva. It combines precise trading signals with adaptive TP/SL levels - creating best possible trades as a result! Message me and get  Neuro Poseidon Assistant  as a gift to automize your trading process! What makes it stand out? 1. Proven profitability on all assets and timeframes 2. Only confirmed BUY and SELL signals present on the chart 3. Adaptive TP & SL levels generated by the software for each trade 4. Easy to understand - suitable for al
Auto Optimized SpeedAngle est un système de vectorisation du momentum de niveau institutionnel qui élimine l'ajustement de courbe ( curve-fitting ) grâce à une optimisation continue par avancement ( Walk-Forward Optimization , WFO). Plutôt que de s'appuyer sur des entrées statiques qui se dégradent lorsque les régimes de marché changent, l'indicateur recalibre dynamiquement ses paramètres en utilisant une validation hors échantillon ( Out-of-Sample , OOS), garantissant ainsi que les signaux affi
Gold Entry Sniper
Tahir Mehmood
5 (21)
Gold Entry Sniper – Tableau de Bord ATR Multi-Unités de Temps pour Scalping et Swing Trading sur l'Or Gold Entry Sniper est un indicateur avancé pour MetaTrader 5 qui fournit des signaux d'achat/vente précis sur XAUUSD et autres actifs, basé sur la logique de Trailing Stop ATR et l' analyse multi-unités de temps . Caractéristiques et Avantages Clés Analyse Multi-Unités de Temps – Affiche les tendances en M1, M5, M15 sur un seul tableau. Trailing Stop Basé sur l'ATR – Ajuste automatiquement selon
Bonjour à tous les traders ! De nombreux investisseurs individuels utilisent des scripts web lents. Une approche systématique est essentielle pour un trading rentable. L'indicateur Astro AI n'est pas un simple affichage sur un graphique. Il s'agit d'un réseau neuronal sophistiqué composé de deux agents fonctionnant directement dans le terminal. Détails techniques du système : 1. Agent 1 : Analyste (Réseau neuronal graphique – GNN) Le marché n'est pas constitué de barres de prix individuelle
Adaptive Price Action Engine Achetez un indicateur, obtenez l'EA gratuitement Analyse auto-optimisée des tendances et des figures de chandeliers Multi-Timeframe Les marchés évoluent constamment, et tous les modèles de Price Action n’ont pas la même valeur dans toutes les conditions de marché. Adaptive Price Action Engine a été conçu pour s’adapter aux changements du marché en combinant structure de tendance, analyse Multi-Timeframe, figures de chandeliers et optimisation statistique au sein d’un
Welcome to ENTRY IN THE ZONE AND SMC MULTI TIMEFRAME  SPECIAL BENEFIT / FOR OUR MQL5 CUSTOMERS FREE ACCESS TO THE NEW TOOL  — COMING SOON — Learn more on our official website  : https://www.fableedge.net YouTube Channel : 24/7 LIVE SIGNALS  :   https://www.youtube.com/@FableEdgeView Entry In The Zone and SMC Multi Timeframe is a real-time market analysis tool based on Smart Money Concepts (SMC) , designed to analyze market structure, price direction, and key trading zones. It supports both Sing
M1 Sniper MT5
Oleg Rodin
5 (7)
M1 SNIPER   est un système d'indicateurs de trading facile à utiliser. Il s'agit d'un indicateur à flèche conçu pour l'unité de temps M1. Cet indicateur peut être utilisé seul pour le scalping sur l'unité de temps M1 ou intégré à votre système de trading existant. Bien que conçu spécifiquement pour le trading sur l'unité de temps M1, ce système peut également être utilisé avec d'autres unités de temps. Initialement, j'avais conçu cette méthode pour le trading du XAUUSD et du BTCUSD. Cependant, j
Divergence Bomber
Ihor Otkydach
4.89 (94)
Chaque acheteur de cet indicateur reçoit également gratuitement : L’outil exclusif « Bomber Utility », qui accompagne automatiquement chaque opération de trading, fixe les niveaux de Stop Loss et de Take Profit, et clôture les positions selon les règles de la stratégie Des fichiers de configuration (set files) pour adapter l’indicateur à différents actifs Des set files pour configurer le Bomber Utility selon différents modes : « Risque Minimum », « Risque Équilibré » et « Stratégie d’Attente »
Unix Scalper
Issam Kassas
4 (4)
Unix Scalper — MetaTrader 5 Après votre achat, envoyez-moi un message sur MQL5 pour recevoir GRATUITEMENT Smart Universal Expert Advisor, ainsi que le cours en ligne, le manuel PDF et l’accès au groupe privé. Repérez la configuration. Consultez le plan. Choisissez comment intervenir. UNIX Scalper réunit l’analyse du marché, les décisions BUY/SELL/WAIT et les niveaux Entry, Stop Loss, TP1 et TP2 dans un panneau organisé. VISUALISEZ LE SIGNAL ET LE PLAN • Des décisions claires : BUY, SELL ou WAIT.

Scalper Vault   est un système de scalpage professionnel qui vous fournit tout ce dont vous avez besoin pour un scalpage réussi. Cet indicateur est un système de trading complet qui peut être utilisé par les traders de forex et d'options binaires. Le délai recommandé est M5. Le système vous fournit des signaux fléchés précis dans le sens de la tendance. Il vous fournit également des signaux supérieurs et inférieurs et des niveaux de marché Gann. Les indicateurs fournissent tous les types d'alert
Tokyo mt5 Indicator
Vasiliy Strukov
5 (9)
Le Tokyo Indicator offre une vue d'ensemble visuelle et claire de l'orientation de la tendance, des signaux de trading potentiels et des conditions du marché. Sa ligne de tendance en escalier, codée par couleur, distingue les phases haussières (en bleu) des phases baissières (en magenta). Des flèches directionnelles associées mettent en évidence les opportunités d'achat et de vente potentielles lors des changements de tendance. Un tableau de bord intégré regroupe le signal actuel, l'orientation
RelicusRoad Pro MT5
Relicus LLC
4.96 (25)
Arrêtez de deviner vos trades. Sachez quand entrer, où sortir et dans quel sens va le marché, le tout sur un seul graphique. RelicusRoad Pro réunit près de vingt outils dans un seul indicateur, et vous activez ceux qui correspondent à votre façon de trader. Entrées claires. Sorties claires. Un plan sur chaque graphique. Ça vous dit quelque chose ? Vous achetez, et le prix se retourne contre vous une minute plus tard. Vous clôturez trop tôt, puis vous regardez le mouvement continuer sans vous. Ci
FiboSniper Pro
Van Minh Nguyen
5 (3)
FiboSniper Pro – Multi-Filter Fibonacci System with Auto SL/TP and Control Panel FiboSniper Pro est un indicateur technique qui combine des Fibonacci Envelopes dynamiques avec plusieurs filtres de confirmation afin de générer des signaux Buy et Sell sélectionnés. Les niveaux de Fibonacci sont calculés à partir de Moving Average et ATR, puis filtrés par ADX, EMA, RSI, ATR, Volume, Time et la structure des bougies. L’indicateur affiche directement sur le graphique les niveaux automatiques de Stop
Market Structure Order Block Dashboard MT5 est un indicateur MT5 conçu pour les traders qui veulent lire la structure de marché et les principales zones de réaction du prix directement sur le graphique. Il combine BOS, ChoCH, Order Blocks, Fair Value Gaps (FVG), Liquidité, Kill Zones, Volume Profile, et un dashboard compact pour une analyse rapide. Cet indicateur s'adresse aux traders qui utilisent la structure de marché, les concepts ICT et Smart Money comme cadre de décision. Il peut aider à r
Présentation       Quantum Breakout PRO   , l'indicateur révolutionnaire MQL5 qui transforme la façon dont vous négociez les zones d'évasion ! Développé par une équipe de traders expérimentés avec une expérience commerciale de plus de 13 ans,       Évasion quantique PRO       est conçu pour propulser votre parcours commercial vers de nouveaux sommets grâce à sa stratégie de zone de discussion innovante et dynamique. Quantum Breakout Indicator vous donnera des flèches de signalisation sur les z
Trend Catcher ind mt5
Ramil Minniakhmetov
5 (18)
INDICATEUR DE DÉTECTEUR DE TENDANCE L'indicateur de détecteur de tendance analyse les mouvements de prix du marché grâce à une combinaison d'indicateurs d'analyse de tendance adaptatifs, propriétaires et personnalisés. Il identifie la véritable direction du marché en filtrant les fluctuations à court terme et en se concentrant sur la force de la dynamique sous-jacente, l'expansion de la volatilité et la structure des prix. Il utilise également une combinaison d'indicateurs personnalisés de lis
Quant Direction MT5
Georgios Kalomoiropoulos
Quant Direction est un outil d'analyse de marché 3D. Il fournit une analyse de marché parfaitement objective, basée sur un algorithme, en calculant des écarts précis en pourcentage sur différents paramètres. Développé à l'aide d'outils de modélisation avancés basés sur l'IA et soumis à des tests rigoureux, cet algorithme analyse le marché avec une précision inégalée. Vous pouvez analyser n'importe quelle paire de devises ou instrument financier sur la plateforme. Que vous pratiquiez le trading à
Volatility Master for MetaTrader is a real-time dashboard tool that scans up to  50 symbols  to identify high-volatility , trending markets instantly. With bullish/bearish signals, customizable alerts, and a user-friendly interface, it helps you avoid range-bound conditions and focus on high-probability trades. Clarity leads to confidence. Trade confidently and protect your capital effectively with this powerful dashboard. We don't offer free or bonus indicators in exchange of reviews from you.
Quantum TrendPulse
Bogdan Ion Puscasu
5 (26)
Présentation de   Quantum TrendPulse   , l'outil de trading ultime qui combine la puissance de   SuperTrend   ,   RSI   et   Stochastic   dans un seul indicateur complet pour maximiser votre potentiel de trading. Conçu pour les traders qui recherchent précision et efficacité, cet indicateur vous aide à identifier les tendances du marché, les changements de dynamique et les points d'entrée et de sortie optimaux en toute confiance. Caractéristiques principales : Intégration SuperTrend :   suivez f
Plus de l'auteur
Smc Pro ToolKit
Talal N Z Aljarusha
5 (13)
SMC PRO TOOLKIT — SMART MONEY ANALYSIS & STRUCTURED TRADE PLANNING SMC Pro ToolKit is a professional Smart Money Concepts analysis workspace for MetaTrader 5. It combines market structure, multi-timeframe analysis, institutional price zones, setup evaluation, confirmation tools, volume context, alerts, and risk planning inside one organized chart environment. One workspace. Multiple layers of confirmation. One structured trading plan. OPEN COMPLETE USER GUIDE MULTI-CONDITION SETUP ENGINE At


Fibo Nova
Talal N Z Aljarusha
‖ Fibo Nova ‖ Fibonacci Strategy Indicator Turn Fibonacci into a Complete Trading Plan Fibo Nova transforms structured Fibonacci opportunities into a clear visual setup — from Entry Zone and Stop Loss to TP1, TP2 and TP3. ENTRY Automatically highlighted Fibonacci Entry Zone RISK Clear Stop Loss reference and invalidation TARGETS TP1 • TP2 • TP3 mapped directly on the chart Stronger Zones. More Than Fibonacci. Fibo Nova combines Fibonacci precision, market structure and setup quality insid

Volume Profile Horizon Where Volume Concentrates. Manual ranges. Daily volume profiles. Multiple market periods on one MetaTrader 5 chart. Volume Profile Horizon is an interactive fixed-range volume analysis indicator for MetaTrader 5. It converts available broker tick-volume data into a horizontal distribution across price levels, helping traders examine where estimated market activity was concentrated within a chosen period. Instead of applying a single profile to an entire chart, you decide p
FREE
Smc Pro Chart
Talal N Z Aljarusha
SMC Pro Chart Clear Structure. Key Zones. Your Chart, Your Way. Smart Money Concepts analysis for MetaTrader 5. Bring market structure and key price areas together in one organized workspace. SMC Pro Chart combines automated analytical drawings with flexible visual controls, helping you examine price action through a clear, personalized chart layout. Market Structure at a Glance Follow Break of Structure ( BOS ) and Change of Character ( CHoCH ) directly on the chart. Distinguish bullish and bea
Filtrer:
Aucun avis
Répondre à l'avis