Candlestick Confluence Detector

  • Indicadores
  • Ibe Hyginus Ugwoke
    Ibe Hyginus Ugwoke
    • MQL4/MQL5 Developer | Custom EAs & Indicators em  Independent / Self-employed
    • Nigéria
    • 275
    I’m an MQL4/MQL5 developer and active trader. I build and personally test the trading tools I develop, which gives me a practical understanding of edge cases, signal timing, and the differences between backtest and live behaviour.
  • Versão: 1.0
  • Ativações: 5
Candlestick Confluence Detector

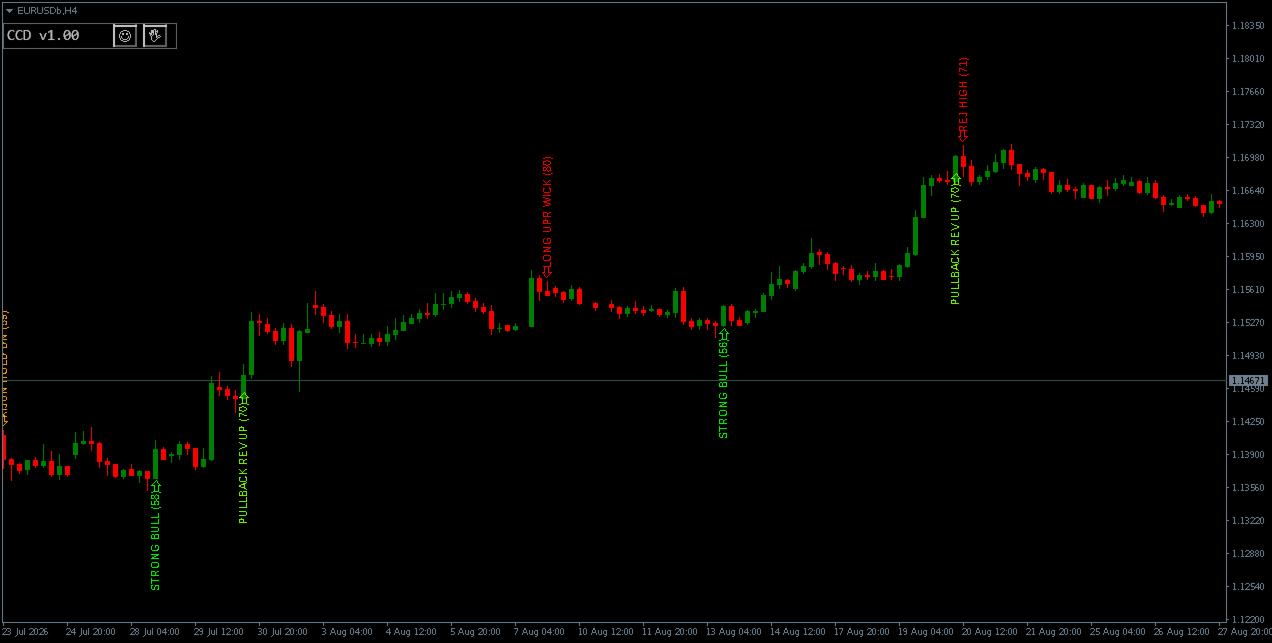
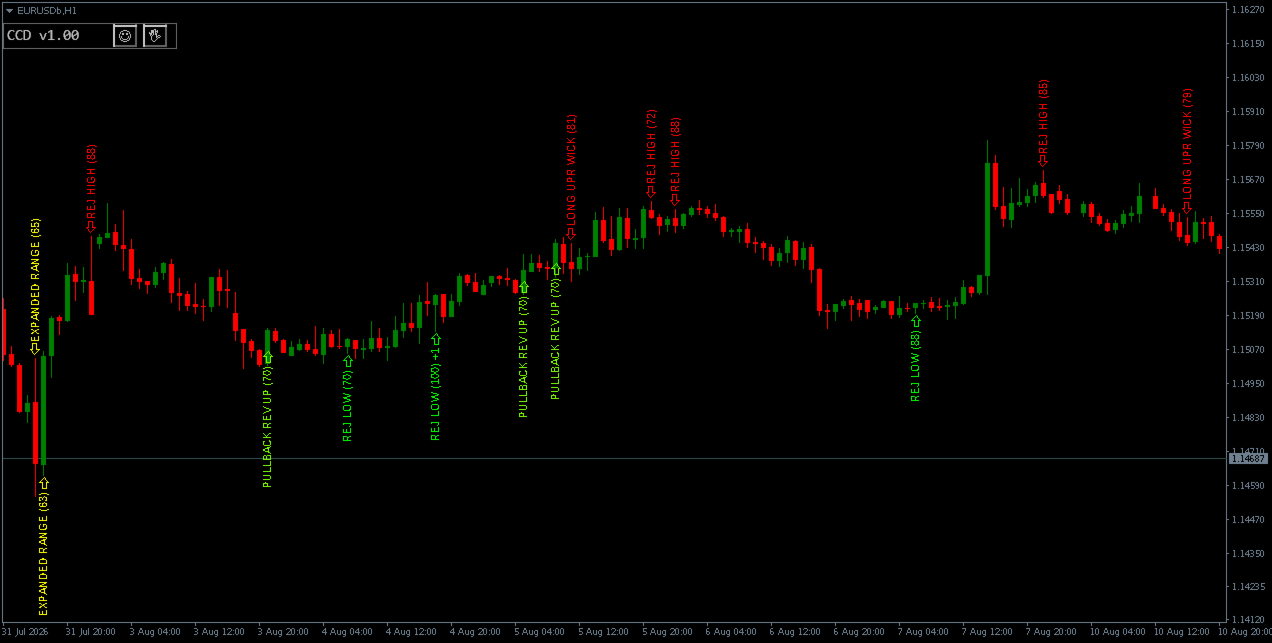
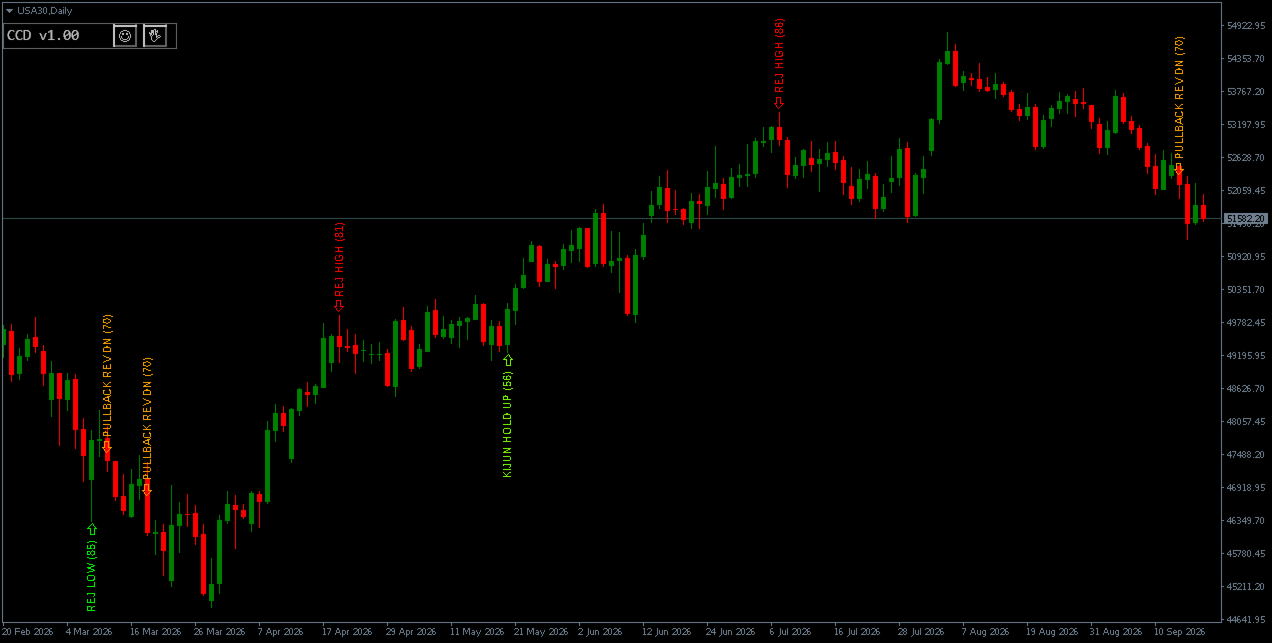
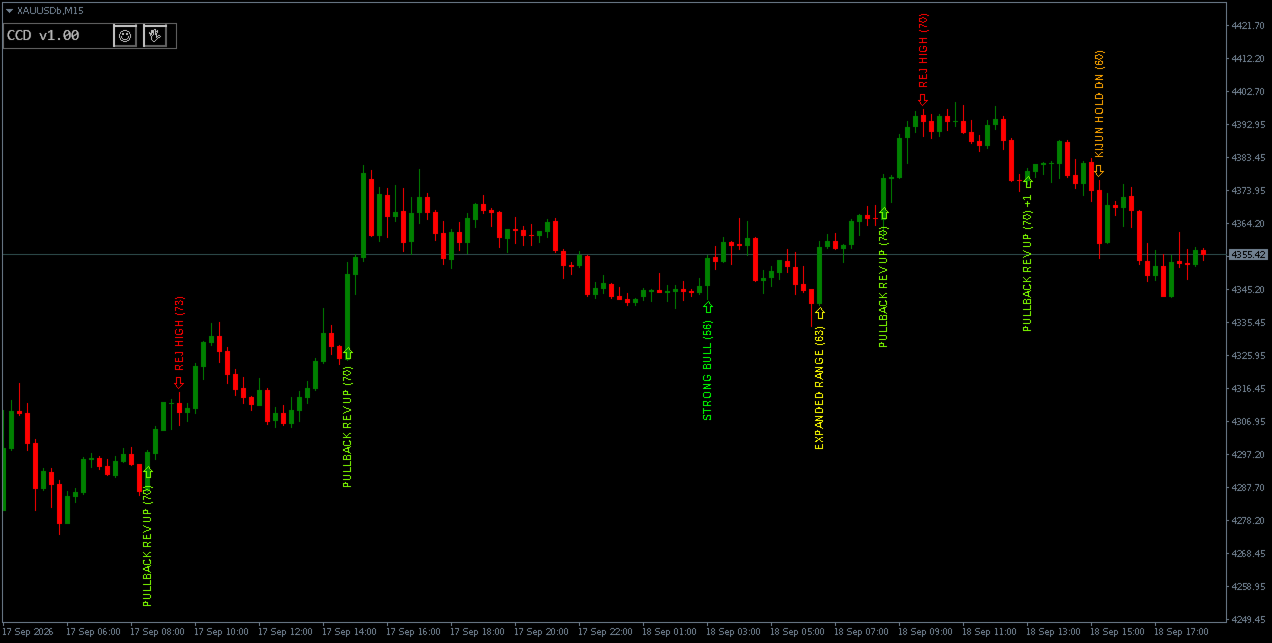
Candlestick Confluence Detector scores candlestick confluence across your chart and up to three higher timeframes — without manually cross-checking each one.

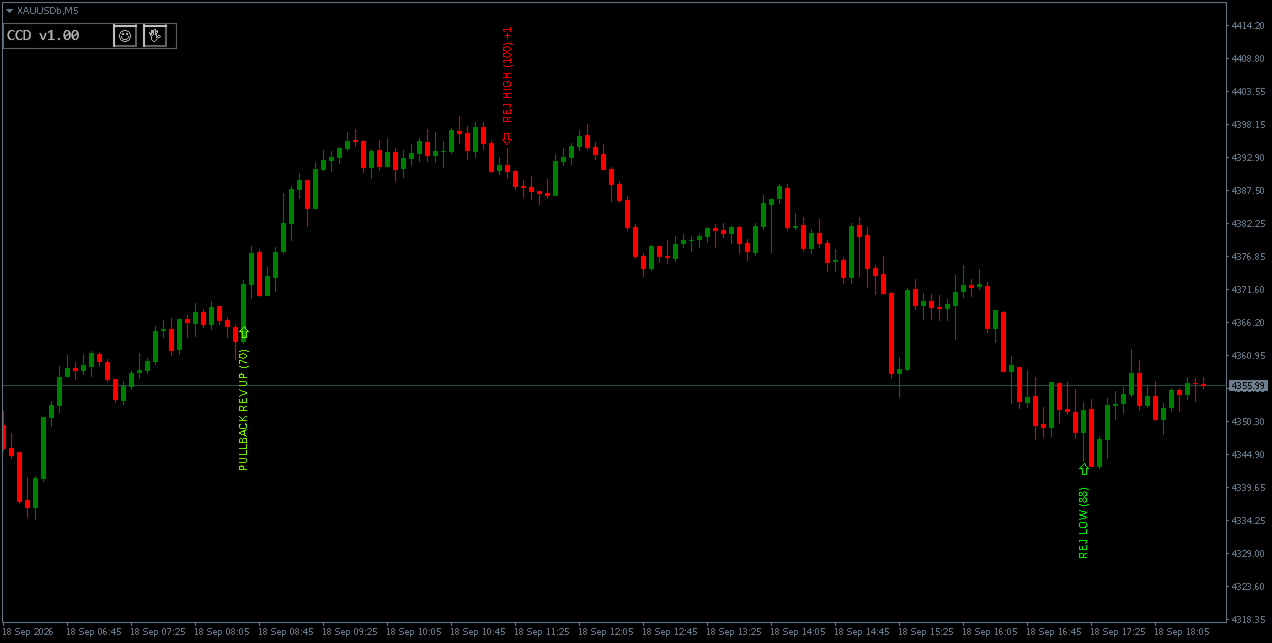
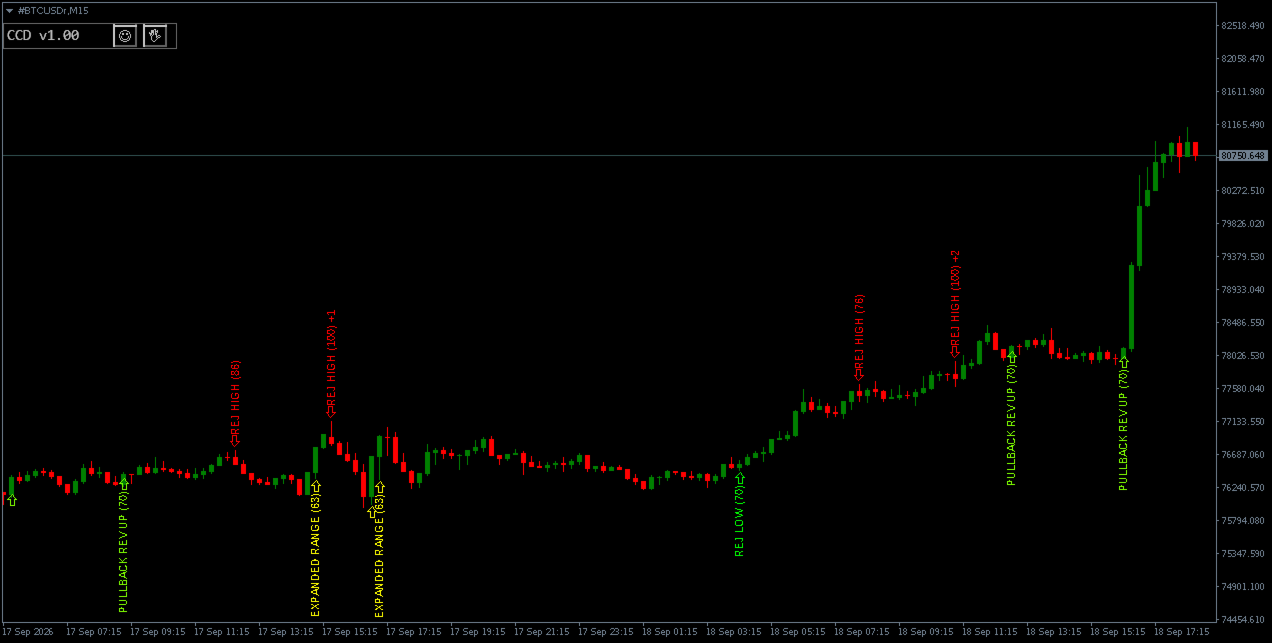
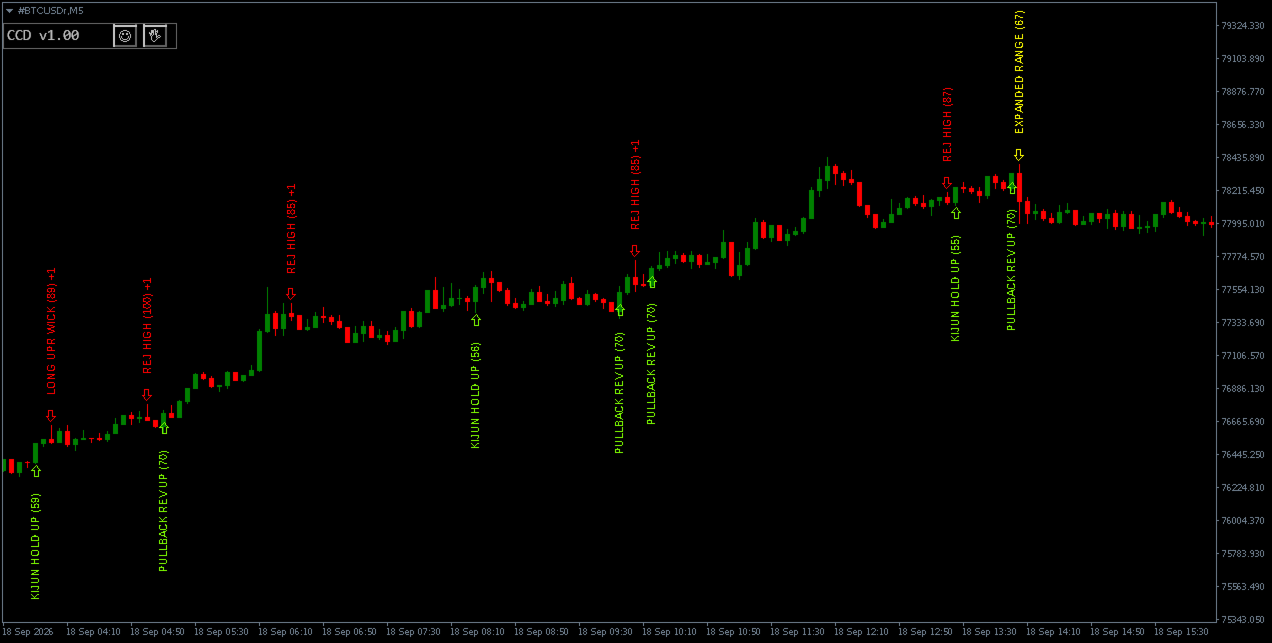
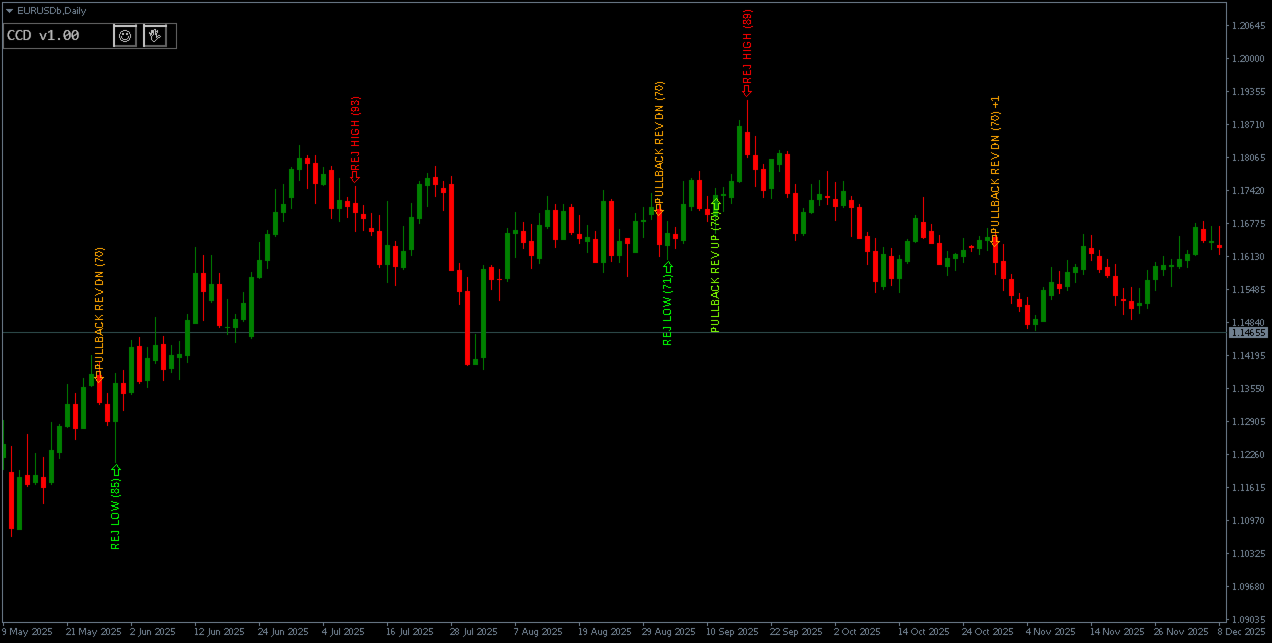
It detects 16 classic price-action patterns, grouped into three dedicated engines:

Rejection
Continuation
Warning

Each pattern receives a 0–100 confluence score. Every label is traceable to a documented, user-adjustable rule set.

KEY FEATURES

• 16 candlestick patterns across 3 purpose-built engines: Rejection, Continuation, and Warning
• Heuristic confluence scoring from 0–100
• Numeric thresholds are exposed as user inputs, so you can tune the sensitivity of every pattern
• Kijun-based trend filter
• Rejection and Warning signals can operate counter-trend
• Continuation signals can operate with the trend
• Up to 3 independent multi-timeframe slots
• Supports timeframes from M1 to MN1
• Historical labels available on load
• Non-repainting detection — calculations run on closed bars only
• Body-size quality filter to suppress low-conviction small-candle signals
• On-chart control panel
• Pause/Resume detection with one click
• Clear all labels with one click
• Popup, push, and email alerts
• One alert per candle per notification channel
• Every pattern can be enabled or disabled individually

RECOMMENDED FOR

Price-action and confluence-based traders who want scored candlestick signals across multiple timeframes, with visibility into the logic behind every label.

This is not a black-box signal generator.

IMPORTANT

This indicator is a visual analysis aid, not a signal service.

It uses only:

• OHLC price data
• ATR

It does not use:

• Volume
• Order flow
• Market profile data

The indicator does not place trades or manage positions.

The confluence score is a heuristic value, not a probability or win rate.

FULL TECHNICAL REFERENCE

OVERVIEW

The indicator scans up to 500 historical bars by default. The scan range is user-adjustable from 10 to 5000 bars.

It can scan:

• The current chart timeframe
• Up to 3 additional higher timeframes

For each bar, the indicator evaluates 16 pattern rules grouped into three engines:

• Rejection
• Continuation
• Warning

When more than one pattern triggers on the same bar, the pattern with the highest confluence score is drawn.

The number of additional matching patterns is appended to the label as "+N".

All detection runs on closed bars only — shift 1 and higher.

Labels on closed bars do not repaint.

The current forming bar is not analysed.

CONFLUENCE SCORE

Each pattern produces a confluence score between 0 and 100.

The score is a heuristic value calculated from a fixed formula specific to each pattern.

It is:

• Not a probability
• Not a win rate
• Not a validated measure of trading outcome

For example, a score of 70 does not mean that the pattern has a 70% probability of working.

It only means that the bar satisfied more of the conditions rewarded by that pattern's scoring formula.

Each pattern's score rewards the strength and quality of the conditions that produced the signal: the depth and dominance of the wick, the size of the body relative to recent volatility, the placement of the close within the bar's range, and the relationship of the bar to the prior bar's structure.

Thresholds that control these elements are exposed as inputs, so you can tune sensitivity without recompiling.

Default minimum score for display: 55

Bars whose highest-scoring pattern falls below this value are not labelled.

REJECTION ENGINE

The Rejection engine is designed to operate counter-trend.

When the trend filter is enabled:

• Bullish Rejection signals require a falling Kijun slope
• Bearish Rejection signals require a rising Kijun slope

REJ LOW — Bullish

A bullish bar that sweeps below the previous bar's low and closes back above it, producing a long lower wick.

The score rewards the depth of the wick relative to the body, how far the close travels back into the previous bar's range, and the size of the body relative to recent volatility.

REJ HIGH — Bearish

Mirror of REJ LOW. A bearish bar that sweeps above the previous bar's high and closes back below it, producing a long upper wick.

LONG LWR WICK — Bullish

A bullish bar whose lower wick dominates the body, signalling rejection of lower prices.

The score rewards the wick-to-body ratio, the placement of the close within the bar's own range, and the size of the body relative to recent volatility.

LONG UPR WICK — Bearish

Mirror of LONG LWR WICK. A bearish bar whose upper wick dominates the body.

STRONG BULL — Bullish

A large bullish body that follows several smaller-bodied bars and closes above their high. This pattern identifies displacement after compression.

The score rewards the size of the body relative to recent volatility.

STRONG BEAR — Bearish

Mirror of STRONG BULL. A large bearish body that closes below the low of the preceding smaller-bodied bars.

CONTINUATION ENGINE

The Continuation engine is designed to operate with the trend.

When the trend filter is enabled:

• Bullish Continuation signals require a rising Kijun slope
• Bearish Continuation signals require a falling Kijun slope

RANGE BRK UP — Bullish

A bar that breaks out above a recent compression range. The prior bars must show a narrow average range; the current bar must show an expanded range and close above the compressed range's high.

The score rewards the size of the breakout range relative to recent volatility.

RANGE BRK DN — Bearish

Mirror of RANGE BRK UP. A bar that breaks below a recent compression range and closes below the compressed range's low.

PULLBACK REV UP — Bullish

A bullish bar that follows two consecutive bearish bars and closes above the previous bar's high.

The score rewards the size of the current body relative to recent volatility.

PULLBACK REV DN — Bearish

Mirror of PULLBACK REV UP. A bearish bar that follows two consecutive bullish bars and closes below the previous bar's low.

KIJUN HOLD UP — Bullish

A bullish bar whose low approaches the Ichimoku Kijun-sen line and holds above it.

The score rewards the distance the close travels away from the low relative to recent volatility.

KIJUN HOLD DN — Bearish

Mirror of KIJUN HOLD UP. A bearish bar whose high approaches the Kijun line and holds below it.

WARNING ENGINE

The Warning engine identifies bars that may indicate:

• Exhaustion
• Indecision
• Failed moves

When the trend filter is enabled, Warning signals follow the same counter-trend rule as Rejection signals.

EXPANDED RANGE

A bar whose range is significantly larger than recent volatility, indicating an expansion move that may signal climax or exhaustion.

The score rewards the size of the range relative to recent volatility.

DOJI CLUSTER

Three consecutive bars, each with a body that is small relative to its own range. Direction is neutral.

This pattern always ignores the trend filter.

FAILED BRK UP — Bearish Warning

The previous bar broke above the recent high. The current bar opens and closes back inside that range, failing the breakout.

The score rewards how far the current bar's close travels back below the prior bar's low.

FAILED BRK DN — Bullish Warning

Mirror of FAILED BRK UP. The previous bar broke below the recent low. The current bar opens and closes back inside that range.

TREND FILTER

When enabled, the indicator measures the net change of the Ichimoku Kijun-sen over a configurable lookback period.

The default lookback is 3 bars. The lookback is user-adjustable.

A trend is considered:

• UP when the net Kijun change exceeds a configurable minimum strength
• DOWN when the net Kijun change falls below the negative of that minimum

The minimum strength is expressed as a fraction of ATR and is user-adjustable.

Signals that do not match the required direction for their engine are suppressed.

The trend filter can also be disabled completely.

BODY FILTER

When enabled:

• Rejection signals are suppressed if the current bar's body is smaller than a configurable minimum relative to ATR
• Warning signals are suppressed if the current bar's body is smaller than the same minimum
• Continuation patterns are exempt from this filter

The purpose of the filter is to avoid drawing labels on very small candles that satisfy a pattern rule geometrically but have little range.

The minimum is expressed as a fraction of ATR and is user-adjustable.

MULTI-TIMEFRAME SLOTS

Three optional higher-timeframe slots are provided.

Each slot can be:

• Enabled or disabled independently
• Assigned any timeframe from M1 to MN1

A slot is automatically disabled if the selected timeframe is not strictly higher than the current chart timeframe.

The indicator can draw up to 5 historical labels per slot by default. This value is user-adjustable.

A new label is added when a higher-timeframe bar closes.

A slot remains idle until sufficient history has loaded for the selected timeframe.

Default Slot Settings

• Slot 1: D1 — Disabled by default
• Slot 2: W1 — Disabled by default
• Slot 3: MN1 — Disabled by default

Users must enable the slots they want to use.

NOTIFICATIONS

Optional alerts are available for:

• Current timeframe
• Each enabled multi-timeframe slot

Three notification channels are supported:

• Popup alert with sound
• Push notification
• Email

Each channel has its own input setting.

Notifications are limited to one alert per candle per channel to avoid repeated alerts on the same bar.

ON-CHART PANEL

A small control panel is displayed directly on the chart.

It shows:

• Indicator name
• Indicator version
• Pause/Resume button
• Clear All Labels button

The panel position is user-adjustable.

INPUT PARAMETERS

General

• Maximum bars to scan
• Minimum confluence score to display

Engines

• Enable/disable Rejection engine
• Enable/disable Continuation engine
• Enable/disable Warning engine

Pattern Toggles

Each of the 16 patterns can be enabled or disabled individually.

Quality Filters

• Body filter ON/OFF
• Minimum body as ATR multiple

Trend Filter

• Trend filter ON/OFF
• Kijun period
• Kijun slope lookback
• Minimum slope strength as ATR multiple

Advanced Thresholds

All numeric thresholds used by the pattern rules are available as input parameters.

Multi-Timeframe

Three independent slots with:

• Timeframe selection
• Lookback depth
• Colour settings

Display

• Font size
• Per-engine colour settings
• Panel position

Notifications

• Popup
• Push
• Email
• Sound file

LIMITATIONS

This indicator is a visual analysis aid.

It:

• Does not generate buy or sell signals
• Does not place orders
• Does not manage positions
• Does not analyse volume
• Does not analyse order flow
• Does not analyse market profile
• Does not use data outside OHLC prices and ATR

Pattern detection depends entirely on the selected input thresholds. Different threshold settings will produce different labels.

The confluence score is a heuristic, and should not be interpreted as a statistical probability.

Past chart patterns are not indicative of future price behaviour.

Produtos recomendados
The Th3Eng PipFinite indicator is based on a very excellent analysis of the right trend direction with perfect custom algorithms. It show the true direction and the best point to start trading. With StopLoss point and Three Take Profit points. Also it show the right pivot of the price and small points to order to replace the dynamic support and resistance channel, Which surrounds the price. And Finally it draws a very helpful Box on the left side on the chart includes (take profits and Stop loss
HMA Trend Professional MT4
Pavel Zamoshnikov
4.57 (7)
Improved version of the free HMA Trend indicator (for MetaTrader 4) with statistical analysis. HMA Trend is a trend indicator based on the Hull Moving Average (HMA) with two periods. HMA with a slow period identifies the trend, while HMA with a fast period determines the short-term movements and signals in the trend direction. The main differences from the free version: Ability to predict the probability of a trend reversal using analysis of history data. Plotting statistical charts for analyzi
Signal trend indicator. Detects the direction of the trend and is coloured accordingly.  Has built in audible and visual alerts when trends change. Can send notifications to your phone or email. Allows Trend and Counter-Trend trading. Works on all timeframes, all currency pairs, metals, indices and cryptocurrencies. Can be used with binary options. Distinctive features No re-drawing; Simple and clear settings; Four types of alerts; Works on all timeframes and all trading tools; Suitable

EZZ Zig Zag MT4
Paulo Rocha
5 (1)
EZZ Elite Zig Zag is an indicator for the MetaTrader 4 terminal. This indicator traces the peak of the trend based on the market reversal, thus showing various opportunities in the financial market. EZZ Elite Zig Zag is a visual tool, intuitive, and easy to understand and use.  Test it Yourself by Downloading it for Free. Author Paulo Rocha all rights reserved
Indicador Crypto_Forex "Detector de Zonas Laterais MFI" - uma ferramenta auxiliar eficiente para negociação! Sem repintura. Ofereço a você a possibilidade de aprimorar seus métodos de negociação com este excelente indicador para MT4. - O indicador mostra áreas de lateralização de preço no gráfico. Possui o parâmetro "Sensibilidade à Lateralização" - responsável pela detecção de lateralizações. - O "Detector de Zonas Laterais MFI" é muito útil para detecção de divergências e também é ótimo para
Infinity Trend Pro
Yaroslav Varankin
1 (1)
This is a trend indicator without redrawing Developed instead of the binary options strategy (by the color of the Martingale candlestick) Also works well in forex trading When to open trades (binary options) A signal will appear in the place with a candle signaling the current candle It is recommended to open a deal for one candle of the current timeframe M1 and M5 When a blue dot appears, open a deal up When a red dot appears, open a trade down. How to open trades on Forex. When a signal is rec
Fibonacci recontratar e extensão linha de desenho ferramenta Fibonacci recontratar e estender a ferramenta de desenho de linha para a plataforma MT4 é adequado para comerciantes que usam método de negociação de pontos e negociação de secções douradas Vantagens: Não há linha extra, não há linhagem muito longa, e é fácil observar e encontrar oportunidades de negociação Versão experimental: https://www.mql5.com/zh/market/product/35884 Principais funções: 1. Podem ser desenhados diretamente vári
Heiken Ashi candle chart is an improved version of The Japanese candle chart, which can effectively filter the market "noise" of the Japanese candle chart. It is favored by many traders for its simplicity and intuition. For trend traders, the HA candle chart is a magic tool. Unlike the traditional Japanese candle chart, Heikenashi does not reflect the opening price, high price, low price and closing price of the market. Instead, Heikenashi calculates the value of a single K line in the dominant
Super Reversal Pattern
Parfait Mujinga Ndalika
Super Reversal Pattern Indicator Unlock the power of advanced pattern recognition with our Super Reversal Pattern Indicator. Designed for traders seeking precision and reliability, this indicator identifies one of the most effective reversal patterns in technical analysis, offering a significant edge in your trading strategy. Key Features: Non-Repainting Accuracy: Enjoy the confidence of non-repainting technology. Once a Super Reversal Pattern is detected, it remains static, providing consiste
Trend Monitor
Pavel Zamoshnikov
4 (4)
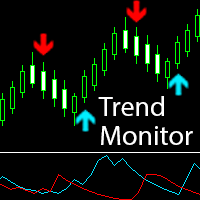
The indicator generates early signals basing on ADX reading data combined with elements of price patterns. Works on all symbols and timeframes. The indicator does not redraw its signals. You see the same things on history and in real time. For better visual perception signals are displayed as arrows (in order not to overload the chart). Features Easy to use. Filter configuration only requires selection of sensitivity in the " Sensitivity of the indicator " input. Signals can be filtered using
Heiken Ashi Smoothed Strategy is a very simple but powerful system to get forex market trend direction. This indicator is actually 2 indicators in 1 pack, Heiken Ashi and Heiken Ashi Smoothed Moving Average both included. Because HA (Heiken Ashi) and HAS (Heiken Ashi Smoothed) are calculated in the same one system event with necessary buffers and loop only, so it is the FAST, OPTIMIZED and EFFICIENT HA having the combined indicator of MetaTrader 4. You can choose to display HA and HAS in the sam
Noize Absorption Index MT4
Ekaterina Saltykova
5 (1)
Noize Absorption Index - is the manual trading system that measures the difference of pressure between bears forces and bulls forces. Green line - is a noize free index that showing curent situation. Zero value of index shows totally choppy/flat market.Values above zero level shows how powerfull bullish wave is and values below zero measures bearish forces.Up arrow appears on bearish market when it's ready to reverse, dn arrow appears on weak bullish market, as a result of reverse expectation. S
Alpha Trend sign has been a very popular trading tool in our company for a long time. It can verify our trading system and clearly indicate trading signals, and the signals will not drift. Main functions: Based on the market display of active areas, indicators can be used to intuitively determine whether the current market trend belongs to a trend market or a volatile market. And enter the market according to the indicator arrows, with green arrows indicating buy and red arrows indicating se
VR Cub
Vladimir Pastushak
VR Cub é um indicador para obter pontos de entrada de alta qualidade. O indicador foi desenvolvido para facilitar cálculos matemáticos e simplificar a busca por pontos de entrada em uma posição. A estratégia de negociação para a qual o indicador foi escrito tem provado a sua eficácia há muitos anos. A simplicidade da estratégia de negociação é a sua grande vantagem, o que permite que até mesmo os comerciantes novatos negociem com sucesso com ela. VR Cub calcula os pontos de abertura de posição e
Cosmic Diviner X Planet
Olena Kondratenko
4 (2)
This unique multi-currency strategy simultaneously determines the strength of trends and market entry points, visualizing this using histograms on the chart. The indicator is optimally adapted for trading on the timeframes М5, М15, М30, Н1. For the convenience of users, the indicator renders the entry point (in the form of an arrow), recommended take profit levels (TP1, TP2 with text labels) and the recommended Stop Loss level. The take profit levels (TP1, TP2) are automatically calculated for
Os indicadores [ZhiBiCCI] são adequados para todo o ciclo de uso e também são adequados para todas as variedades do mercado. [ZhiBiCCI] Linha sólida verde é uma inversão da divergência de alta. A linha pontilhada verde é uma divergência de alta clássica. [ZhiBiCCI] A linha sólida para o vermelho é uma divergência de baixa reversa. A linha pontilhada vermelha é uma divergência clássica de baixa. [ZhiBiCCI] pode ser definido nos parâmetros (Alerta, Enviar e-mail, Enviar notificação), definido c
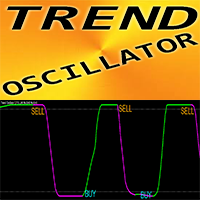
Trend Oscillator - é um indicador Crypto_Forex personalizado avançado, uma ferramenta de negociação eficiente! - É utilizado um novo método de cálculo avançado - 20 opções para o parâmetro "Preço para cálculo". - O oscilador mais suave alguma vez desenvolvido. - Cor verde para tendências ascendentes, cor vermelha para tendências descendentes. - Valores de sobrevenda: abaixo de 5, Valores de sobrecompra: acima de 95. - Existem muitas oportunidades para atualizar até mesmo as estratégias padrão c
This indicator is another variant of the famous powerful indicator Fibonacci-SS https://www.mql5.com/en/market/product/10136 but has different behaviour in placing Pending Order and TP Line. Automatically places Fibonacci retracement lines from the last highest and lowest visible bars on the chart with: An auto Pending Order (Buy/Sell). Taking Profit 1, Taking Profit 2 is pivot point and Taking Profit 3 for extended reward opportunity. The best risk and reward ratio. Simple and powerful indicat
RSI Speed mp
DMITRII GRIDASOV
Indicador Crypto_Forex "RSI SPEED" para MT4 - ótima ferramenta preditiva, sem necessidade de repintura. - O cálculo deste indicador é baseado em equações da física. O RSI SPEED é a primeira derivada do próprio RSI. - O RSI SPEED é bom para entradas de scalping na direção da tendência principal. - Use-o em combinação com um indicador de tendência adequado, por exemplo, HTF MA (como nas imagens). - O indicador RSI SPEED mostra a rapidez com que o próprio RSI muda de direção - ele é muito sensíve
"Dynamic Trading Oscillator" - um indicador avançado e personalizado para Crypto_Forex - uma ferramenta de negociação eficiente para MT4! - Nova geração de osciladores - veja as imagens para ver como usá-lo. - O Dynamic Trading Oscillator possui zonas adaptáveis ​​de sobrevenda/sobrecompra. - O oscilador é uma ferramenta auxiliar para encontrar pontos de entrada exatos em áreas dinâmicas de sobrevenda/sobrecompra. - Valores de sobrevenda: abaixo da linha azul, valores de sobrecompra: acima da l
The   RSI Divergence + FVG Signal   indicator combines   Relative Strength Index (RSI) Divergence   with   Fair Value Gap (FVG)   detection to generate high-probability buy and sell signals based on both momentum shifts and institutional imbalance zones. Core Features: RSI Divergence Detection : Identifies both regular and hidden bullish/bearish divergences between price and RSI. Divergences indicate potential trend reversals or continuation. FVG Zone Recognition : Detects Fair Value Gaps (imbal
Money Flow Profile MT5 HERE   Here   our more valuable tools SMC Trend Trading   ,  Easy SMC Trading  ,  Institutional SMC Architect Volume Analysis Tools  ,  Volume flow Profile  ,  Market volume profile  , FVG with Volume  , Liquidity Heatmap Profile  ,  Volume Spread Analysis This Master Edition is engineered for clarity and speed, featuring a unique Auto-Theme Sync system that instantly beautifies your chart layout upon loading. Key Features: True Money Flow Calculation: Goes beyond stand
No Skam
Abdulkarim Karazon
5 (1)
Indicador de Seta SEM SKAM O Indicador de Seta SEM SKAM é um indicador de negociação auto-otimizado projetado para ajustar automaticamente sua geração de sinal e os níveis de TP/SL com base nos seus objetivos de desempenho. AUTOMATED VERSION (EA) <---click Em vez de testar manualmente centenas de combinações de parâmetros, o indicador busca configurações que melhor correspondam aos seus objetivos de otimização, como: Taxa Mínima de Vitória Sequência Máxima de Derrotas Contagem Mínima de Negoci
FREE
Smart Daily Fibonacci is a Daily Fibonacci Indicator for MT4 and MT5 that automatically draws Fibonacci Retracement and Fibonacci Extension levels using the previous trading day's high and low. Designed for Forex traders , gold traders , index traders , cryptocurrency traders , scalpers , day traders , swing traders , and prop firm traders , it helps create a structured daily trading framework without the need to manually draw Fibonacci tools every session. By transforming the previous day's ran
Happy Scalping Indicator
Leandro Bernardez Camero
Este indicador foi projetado para scalping agressivo e entradas rápidas em opções binárias , gerando sinais em toda vela , para que você saiba exatamente o que está acontecendo o tempo todo. Junte-se ao canal Happy Scalping: MQL5 Não repinta : o sinal da vela atual é gerado em TEMPO REAL , o que significa que pode mudar enquanto a vela ainda está em formação, dependendo se o preço sobe ou desce em relação ao fechamento da vela anterior. Mas uma vez que a vela fecha , a cor do sinal fica comple
Master Dot for MetaTrader 4 Detect Volatility Exhaustion Before the Market Returns to Balance Master Dot is a professional non-repainting indicator designed to detect moments when price moves beyond its statistically expected volatility range. These situations often occur during sharp market impulses, liquidity grabs or temporary emotional moves, when price departs from its normal trading conditions. Instead of following trends, Master Dot highlights volatility exhaustion — moments where the mar
Double HMA MTF for MT4
Pavel Zamoshnikov
4.2 (5)
This is an advanced multi-timeframe version of the popular Hull Moving Average (HMA). Features Graphical panel with HMA indicator data from all timeframes at the same time . If the HMA has switched its direction on any timeframe, a question mark or exclamation mark is displayed on the panel, accompanied by a text and audio message. The messages can be configured separately for each timeframe using the corresponding checkboxes. The indicator is located in a separate window, so as not to overload
Description Shows Heikin-Ashi candles (often misspelled Heiken-Ashi) on the chart and can alert when candles change color. The alert is useful for both entry and exit. The number of candles of the new color before an alert is raised can be set. The alert can be controlled interactively, directly from the chart. Also includes bonus indicators of current spread and ask/bid prices in large text, color coded as price changes. Usage Heikin-Ashi candles give a much better insight to the underlying tre
Order Blocks Finder
Muhammad Arslan
4.17 (6)
Very precise patterns to detect High Accurate Order Blocks: It Draw zone after market Structure Breakout  with a high Accuracy, institutional orders with the potential to change the price’s direction and keep moving towards it, have been placed.   Features Auto Order Blocks Draw Market Structure BOS LINE Auto Imbalance Detect Auto Trend Detect MTF Order Blocks Double Signal One Alert Signal Second Long Wick Rejection Signal Imbalance removed after filled Order Blocks Retest counted Order Block
Wave Wolf MT4
Andrei Salanevich
O indicador Forex Wave Wold MT4 é projetado para procurar as ondas de Wolfe e exibi-las na janela atual do terminal de negociação. Um excelente indicador para os traders que usam as ondas de Wolf. Sua aplicação em estratégias de negociação aumentará significativamente sua eficiência e lucratividade. INFORMAÇÃO DO INDICADOR Ao contrário de outros indicadores de ondas de Wolfe, o indicador forex Wave Wold MT4 tem uma série de características que aumentam significativamente a sua eficiência: O p
Os compradores deste produto também adquirem
Trend SniperX MT4
Sarvarbek Abduvoxobov
5 (5)
Trend Sniper X é um indicador de tendência multitemporal para MetaTrader 5 que ajuda os traders a identificar a direção da tendência e potenciais pontos de reversão com clareza e precisão. Para MT5: https://www.mql5.com/en/market/product/181101 Informação de preço: O preço atual é promocional e está sujeito a alterações à medida que novas atualizações e recursos forem lançados. Canal Code2Profit Domine o Mercado com Análise Multitemporal! Como Maximizar sua Taxa de Acerto com o Trend Sniper X: R
Scalper Vault
Oleg Rodin
5 (40)
O Scalper Vault é um sistema de negociação poderoso e completo, projetado para traders que buscam consistência em operações intraday. Este indicador de alta precisão funciona como um sistema de negociação autônomo, oferecendo análises de nível institucional tanto para o mercado Forex quanto para Opções Binárias. ENTRE EM CONTATO COMIGO APÓS A COMPRA PARA RECEBER DICAS DE NEGOCIAÇÃO E UM BÔNUS EXCLUSIVO! Ao eliminar suposições e análises manuais complexas, o Scalper Vault permite que você foque
Currency Strength Wizard é um indicador muito poderoso que fornece uma solução completa para uma negociação bem-sucedida. O indicador calcula o poder deste ou daquele par forex usando os dados de todas as moedas em vários intervalos de tempo. Esses dados são representados em uma forma de índice de moeda fácil de usar e linhas de energia de moeda que você pode usar para ver o poder desta ou daquela moeda. Tudo o que você precisa é anexar o indicador ao gráfico que deseja negociar e o indicador mo
O sistema PRO Renko é um sistema de negociação altamente preciso especialmente concebido para a negociação de gráficos RENKO. Trata-se de um sistema universal que pode ser aplicado a vários instrumentos de negociação. O sistema neutraliza eficazmente o chamado ruído de mercado, dando-lhe acesso a sinais de inversão precisos. O indicador é muito fácil de usar e tem apenas um parâmetro responsável pela geração de sinal. Você pode facilmente adaptar a ferramenta a qualquer instrumento de negocia
SR Liquidity
Oleg Rodin
5 (2)
O SR Liquidity é um indicador de trading projetado para revelar as zonas ocultas onde a liquidez do mercado se concentra e o preço reage com maior intensidade. Essas áreas específicas de liquidez funcionam como níveis poderosos de suporte e resistência, oferecendo um mapa claro de onde é mais provável que o mercado reverta. Em vez de traçar linhas comuns de Suporte e Resistência, o SR Liquidity analisa o comportamento real dos preços para detectar as zonas onde se acumulam pressões de compra e v
Atomic Analyst
Issam Kassas
5 (14)
Atomic Analyst — MetaTrader 4 Para dúvidas sobre o produto, orientação de configuração ou suporte técnico, envie-me uma mensagem diretamente aqui no MQL5. O indicador transforma cálculos complexos do mercado em sinais visuais simples, candles coloridos, leituras de tendência, níveis de stop loss e várias zonas de take profit que os traders podem entender rapidamente e usar em condições reais de mercado. Principais usos de trading: Scalping e day trade: Desenvolvido para tomada de decisão rápida
Smart Trend Trading System é um indicador para MetaTrader 4 que reúne informações de tendência, sinais de entrada e saída e níveis de preço em um único gráfico. Ele combina mais de 10 ferramentas de trading em um único sistema, incluindo detecção de tendência, zonas de reversão, Smart Cloud, lógica de trailing stop, suporte e resistência, coloração de candles, alertas e análise multi-timeframe. O sistema foi desenvolvido para ajudar você a operar diferentes condições de mercado: Mercados em tend
SIO Oscillator: oscilador auto-otimizável de desequilíbrio de semivariância Compre o indicador e receba GRÁTIS o Expert Advisor (EA) baseado nele. A maioria dos osciladores trata todo movimento de preço da mesma forma. O SIO separa a pressão de alta da pressão de baixa e mede o desequilíbrio entre elas, mostrando qual lado realmente controla o mercado: compradores ou vendedores. Quando o desequilíbrio atinge um extremo, o SIO gera um sinal claro com níveis de entrada, Stop Loss e Take Profit. O
Quant Direction
Georgios Kalomoiropoulos
Quant Direction é uma ferramenta de análise de mercado tridimensional. Ela oferece uma análise de mercado totalmente objetiva, baseada em algoritmos, que calcula simultaneamente desvios percentuais precisos em diversos parâmetros. Desenvolvido com ferramentas avançadas de modelagem com inteligência artificial e rigorosamente testado, o algoritmo foi projetado para interpretar o mercado com precisão sem precedentes. Você pode analisar qualquer par de moedas ou instrumento financeiro em sua plataf
Trend Lines PRO
Roman Podpora
5 (2)
LINHAS DE TENDÊNCIA PRO       Ajuda a entender onde o mercado está realmente mudando de direção. O indicador mostra inversões de tendência reais e pontos onde os principais participantes retornam ao mercado. Você vê     Linhas BOS     Análise de tendências e níveis-chave em prazos maiores — sem configurações complexas ou ruídos desnecessários. Os sinais não são repintados e permanecem no gráfico após o fechamento da barra. VERSÃO MT 5      -      Revela seu potencial máximo quando emparelhada co
AW Prime Oscillator
AW Trading Software Limited
5 (1)
Uma combinação de dois osciladores. O primeiro exibe os pontos de entrada, o segundo mostra a tendência atual. O indicador pode exibir sinais do oscilador por meio de setas em dois modos, todos os sinais do oscilador rápido ou sinais apenas na direção da tendência atual. Possui painel multi-timeframe e três tipos de notificações de sinal. Benefícios: Adequado para negociação diurna e de scalping Filtragem de tendências Configuração simples e sensível Painel multiperíodo Adequado para integração
M1 Sniper
Oleg Rodin
4.97 (30)
O M1 SNIPER é um sistema indicador de negociação fácil de usar. É um indicador de seta projetado para o período M1. O indicador pode ser usado como um sistema independente para scalping no período M1 e pode ser usado como parte do seu sistema de negociação existente. Embora este sistema de negociação tenha sido projetado especificamente para negociação no M1, ele também pode ser usado em outros períodos. Originalmente, desenvolvi este método para negociar XAUUSD e BTCUSD. Mas considero-o útil ta
Hidden Cycles
Lev Vladimirovic Marushkin
5 (1)
The Only 100% Universal Tool! Stop trading against nature! This is your chance to secure the only indicator rooted in the absolute laws that govern the entire universe. Most tools guess—this one reveals the truth. Buy another toy or buy the truth. Your choice... Based on Universal Laws — NOT Some Guy’s Algorithm: Let the market adjust to the Hidden Cycles Geometry — not the other way around. Most indicators are based on a man-made formula. They often lag, fail over time, or need constant re-o
Neo Wave PRO
Nikolay Raykov
5 (1)
Price & Time Market Structure Indicator A professional market structure tool that analyzes waves through both price and time — not price alone. Main Description NeoWave PRO is a professional market structure indicator for MetaTrader 4 designed for traders who want to move beyond traditional one-dimensional wave tools such as ZigZag, swing indicators, and basic high/low systems. Most wave indicators analyze only one thing: Price. But a real market wave is not only a price movement. A true wave de
Este indicador examina a estrutura de preços de fractais de diferentes períodos para determinar possíveis pontos de reversão no mercado, proporcionando tempo aos traders posicionais que já possuem um modelo de avaliação fundamental ou técnico. Diferentemente de seu irmão mais novo, Reversal Fractals , esse indicador não perde reversões por causa do período selecionado e encontra fractais de reversão em zigue-zague, ignorando as reversões que não possuem impulso suficiente para iniciar um movime
CRT Multi-Timeframe Market Structure & Liquidity Sweep Indicator Non-Repainting | Multi-Asset | MT5 Version Available MT5 Version:   https://www.mql5.com/en/market/product/162075 Full User Guide — explains what each feature does and why:   https://www.mql5.com/en/blogs/post/767525 Quick Start User Guide  — explains how to configure and in what order:  https://www.mql5.com/en/blogs/post/767540 Indicator Overview CRT Ghost Candle HTF Fractal is a complete institutional-grade market structure too
Gann Time Clusters
Martin Eshleman
2.5 (2)
Gann Time Clusters Indicator This indicator is based on W. D. Gann's Square of 9 method for the time axis. It uses past market reversal points and applies the mathematical formula for Gann's Square of 9 and then makes projections into the future. A date/time where future projections line up is called a 'time cluster'. These time clusters are drawn as vertical lines on the right side of the chart where the market has not advanced to yet. A time cluster will result in a market reversal point (ex.
Neuro Poseidon MT4
Daria Rezueva
4.74 (46)
Neuro Poseidon is a new indicator by Daria Rezueva. It combines precise trading signals with adaptive TP/SL levels - creating best possible trades as a result! Message me and get  Neuro Poseidon Assistant  as a gift to automize your trading process! What makes it stand out? 1. Proven profitability on all assets and timeframes 2. Only confirmed BUY and SELL signals present on the chart 3. Adaptive TP & SL levels generated by the software for each trade 4. Easy to understand - suitable for all
Non repaint MT4
Yan Zhen Du
5 (1)
This is a professional chart indicator designed for traders focused on stability and clear price action. It helps filter market noise and provides clear visual entry and exit zones for your trading decisions. Core Features: Strictly Non-Repainting: The system is built with strict non-repaint logic. What you see on the chart is the true historical performance. Confirmed Signals: Signals are triggered and confirmed only after the candle closes . Once a trading arrow appears on a closed candle, it
Forex Breath System é um sistema de negociação baseado em tendências que pode ser usado em qualquer mercado. Você pode usar este sistema com moedas, metais, commodities, índices, criptografia e até ações. Também pode ser usado em qualquer período de tempo. O sistema é universal. Ele mostra tendência e fornece sinais de seta com a tendência. O indicador também pode fornecer um tipo especial de alerta quando os sinais aparecem na direção da tendência, o que torna a negociação de tendências uma tar
Advanced Supply Demand
Bernhard Schweigert
4.91 (302)
Atualmente com 30% de desconto! A melhor solução para qualquer Trader Novato ou especialista! Este indicador é uma ferramenta de negociação exclusiva, de alta qualidade e acessível porque incorporamos uma série de recursos proprietários e uma nova fórmula. Com esta atualização, você poderá mostrar fusos horários duplos. Você não só será capaz de mostrar um TF mais alto, mas também mostrar ambos, o TF do gráfico, MAIS o TF mais alto: MOSTRANDO ZONAS ANINHADAS. Todos os traders de Oferta e Demanda
Super Signal – Skyblade Edition Sistema profissional de sinais de tendência sem repintar / sem atraso com taxa de acerto excepcional | Para MT4 / MT5 Funciona melhor em timeframes mais curtos, como 1 minuto, 5 minutos e 15 minutos. Principais características: Super Signal – Skyblade Edition é um sistema inteligente de sinais desenvolvido especificamente para operações com tendência. Utiliza uma lógica de filtragem em múltiplas camadas para detectar apenas movimentos direcionais fortes sustenta
Liquidity Scalper System: um sistema de trading baseado em liquidez no formato de indicador. A maioria dos indicadores mostra apenas uma seta, e depois o trader decide sozinho onde colocar o stop, onde está o alvo e se pode confiar no sinal. O Liquidity Scalper System cobre todo o ciclo da operação: encontra pools de liquidez, dá um sinal no seu rompimento, calcula imediatamente Entry, Stop Loss e três alvos, e mostra no painel as estatísticas e os resultados da validação em dados novos. O sist
Gann Made Easy
Oleg Rodin
4.84 (174)
Gann Made Easy é um sistema de negociação Forex profissional e fácil de usar, baseado nos melhores princípios de negociação usando a teoria do sr. W. D. Gann. O indicador fornece sinais precisos de COMPRA e VENDA, incluindo níveis de Stop Loss e Take Profit. Você pode negociar mesmo em movimento usando notificações PUSH. Entre em contato comigo após a compra para receber instruções de negociação e ótimos indicadores extras gratuitamente! Provavelmente você já ouviu muitas vezes sobre os métodos
Break and Retest Hunter MT4 is a powerful MetaTrader 5 indicator designed to automatically identify support and resistance levels, breakout structures, and potential retest opportunities in real time. Bonus Indicator: After purchasing Break and Retest Hunter , contact me to receive Trade Indicator Assistant EA completely free as a bonus utility. $65 for the next 10 copies . Next price is $120.  Combining adaptive market analysis, clear BUY/SELL signals, Fibonacci-based profit targets, and a pre
ACTUALMENTE COM 40% DE DESCONTO A melhor solução para qualquer novato ou comerciante especializado! Este Indicador é uma ferramenta comercial única, de alta qualidade e acessível, porque incorporámos uma série de características proprietárias e uma nova fórmula. Com apenas UM gráfico, pode ler a força da moeda para 28 pares de Forex! Imagine como a sua negociação irá melhorar porque é capaz de apontar o ponto exacto do gatilho de uma nova tendência ou oportunidade de escalada? Manual do util
Gold Channel   é um indicador baseado na volatilidade, desenvolvido com um algoritmo de tempo especifico para o par XAUUSD que consiste em encontrar possíveis correções no mercado. Este indicador mostra duas linhas exteriores, uma interior (linha de retração) e um sinal de seta, onde a teoria do canal consiste em ajudar a identificar condições de sobrecompra e sobrevenda no mercado. O preço do mercado cairá geralmente entre os limites do canal. Se os preços tocarem ou se moverem para fora do can
Actualmente 30% OFF ! A melhor solução para qualquer novato ou comerciante especializado! Este software de painel de instrumentos está a funcionar em 28 pares de moedas. É baseado em 2 dos nossos principais indicadores (Advanced Currency Strength 28 e Advanced Currency Impulse). Dá uma grande visão geral de todo o mercado Forex. Mostra valores avançados de força da moeda, velocidade de movimento da moeda e sinais para 28 pares de divisas em todos os (9) períodos de tempo. Imagine como a sua n
TDI Multi Timeframe Scanner: This Dashboard indicator uses the TDI (Trader's Dynamic Index) Indicator to find best trades. Read detailed How to Use Guide: https://www.mql5.com/en/blogs/post/758252 Extra indicators also available in above post. Checks for: - SharkFin Pattern Free indicator for SharkFin: https://www.mql5.com/en/market/product/42405/ - TDI Trend: Strong/Weak Trend Up/Down - TDI Signal: Strong/Medium/Weak Signal for Buy/Sell - Consolidation - Overbought/Oversold - Volatility Ban
Italo Trend Indicator
Italo Santana Gomes
4.74 (34)
BUY INDICATOR AND GET EA FOR FREE AS A BONUS + SOME OTHER GIFTS! ITALO TREND INDICATOR  is the best trend indicator on the market, the Indicator works on all time-frames and assets, indicator built after 7 years of experience on forex and many other markets. You know many trend indicators around the internet are not complete, does not help, and it's difficult to trade, but the Italo Trend Indicator is different , the Italo Trend Indicator shows the signal to buy or sell, to confirm the signal t
Mais do autor
Order Block Intelligence Engine v1.02 Detects order block zones using confirmed swing structure, break-of-structure with displacement, and a multi-factor quality score. Tracks each zone through a five-state lifecycle and optionally projects a next target level. OVERVIEW The indicator identifies order block zones on the current chart timeframe. Each zone is defined by the origin candle (or base of consecutive candles) that preceded a break of structure, and by the swing point whose break confirme
StructuraX
Ibe Hyginus Ugwoke
StructuraX Non-repainting market structure analysis with a mechanical bias score, optional higher-timeframe context, key levels, and risk-based reference calculations. Overview StructuraX is a rule-based market structure indicator designed to turn price action into a structured analytical framework. It analyses the current chart timeframe for: Market structure: HH/HL and LH/LL Confirmed Break of Structure (BOS) Dominant impulse and retracement depth Momentum thrust Compression Key structural zon
Filtro:
Sem comentários
Responder ao comentário