Candlestick Confluence Detector
- Indicatori
-
Ibe Hyginus Ugwoke
 I’m an MQL4/MQL5 developer and active trader. I build and personally test the trading tools I develop, which gives me a practical understanding of edge cases, signal timing, and the differences between backtest and live behaviour.
 - Versione: 1.0
- Attivazioni: 5
Candlestick Confluence Detector scores candlestick confluence across your chart and up to three higher timeframes — without manually cross-checking each one.
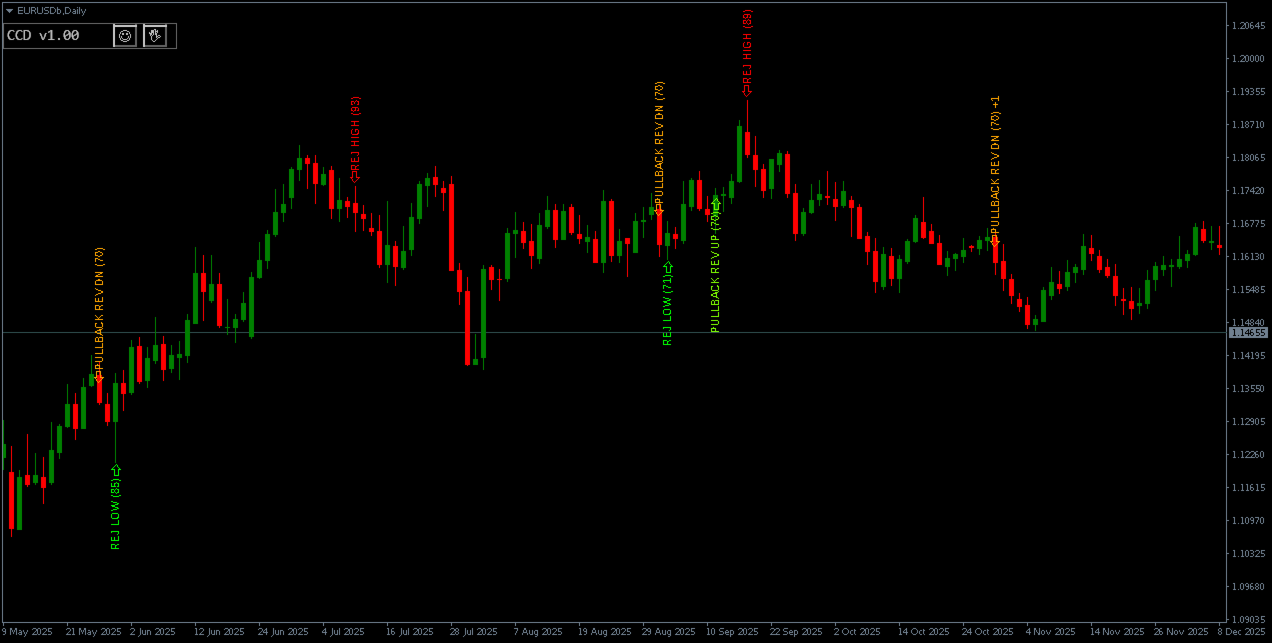
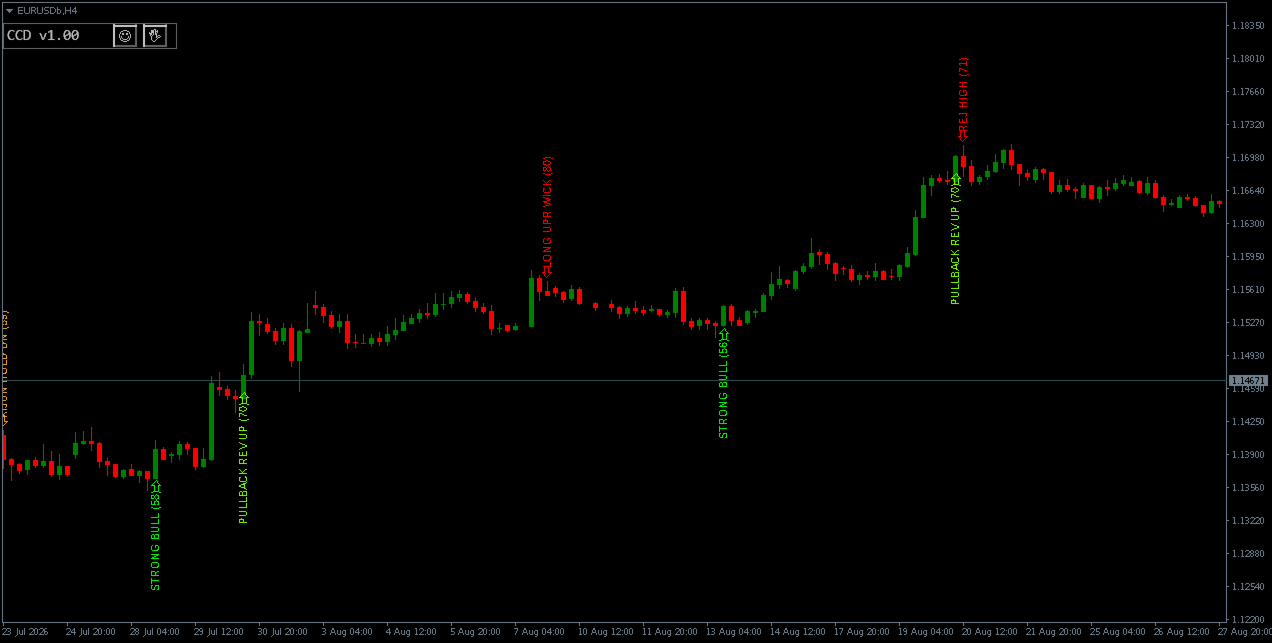
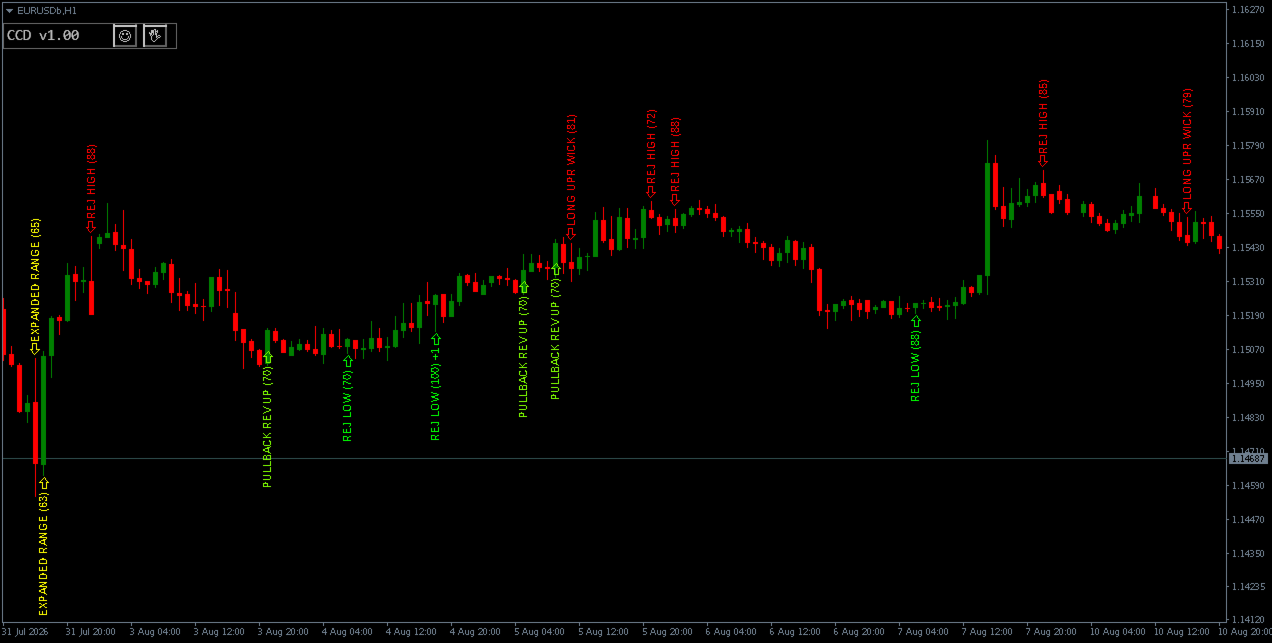
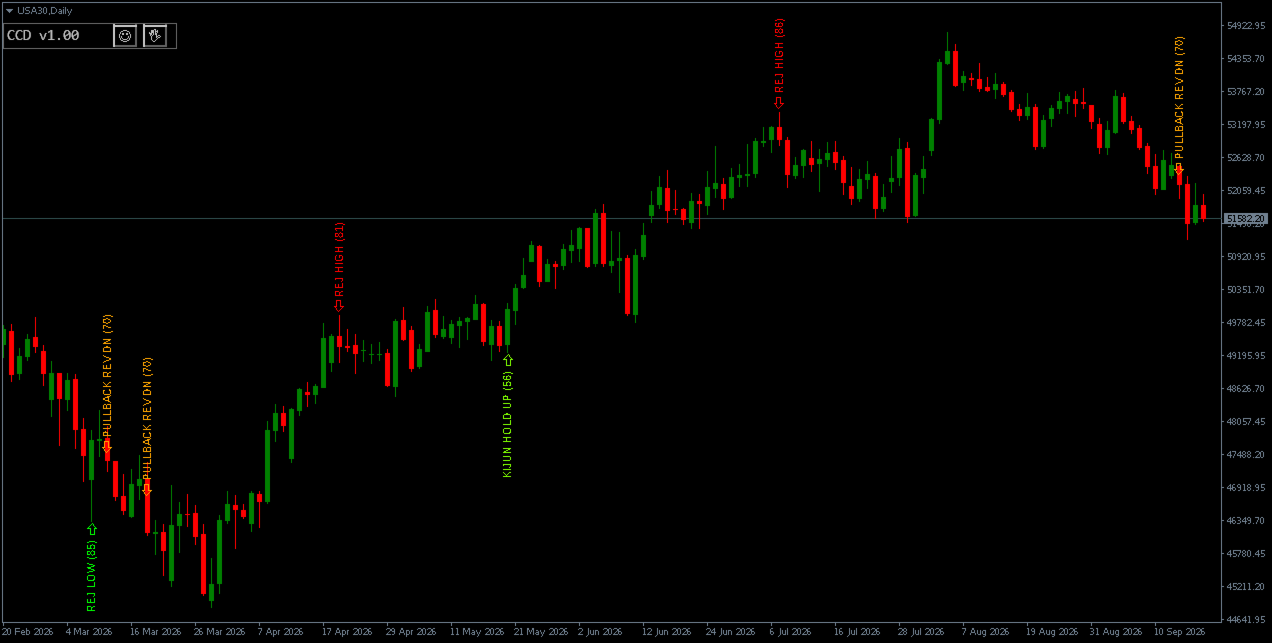
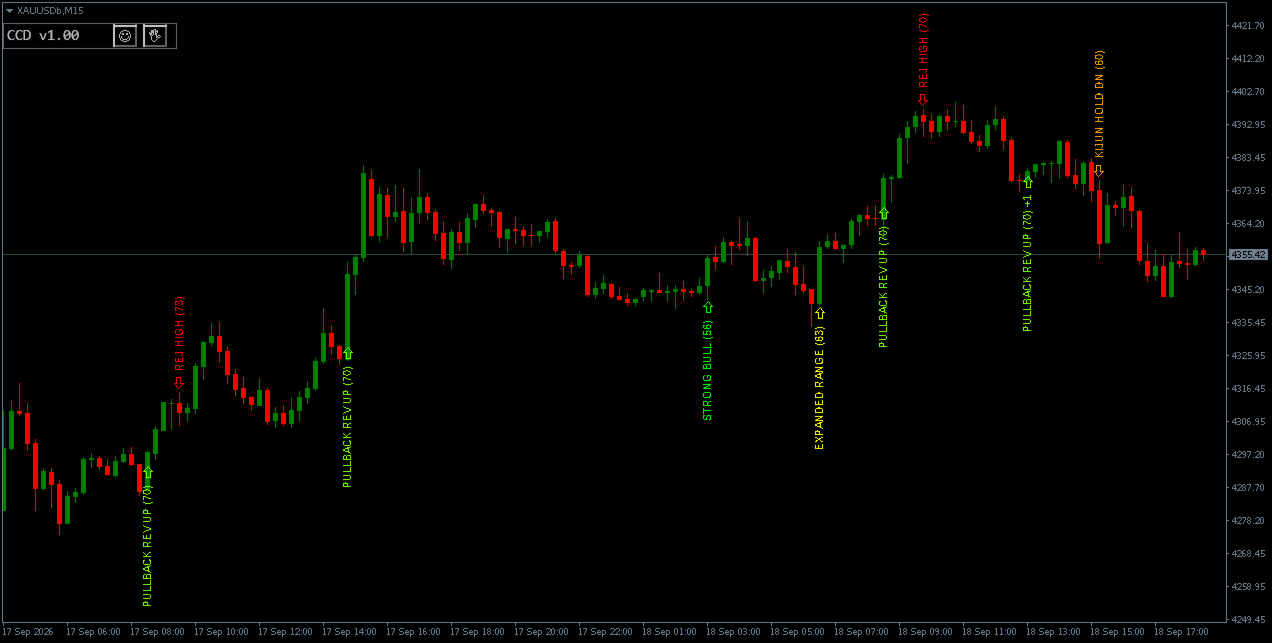
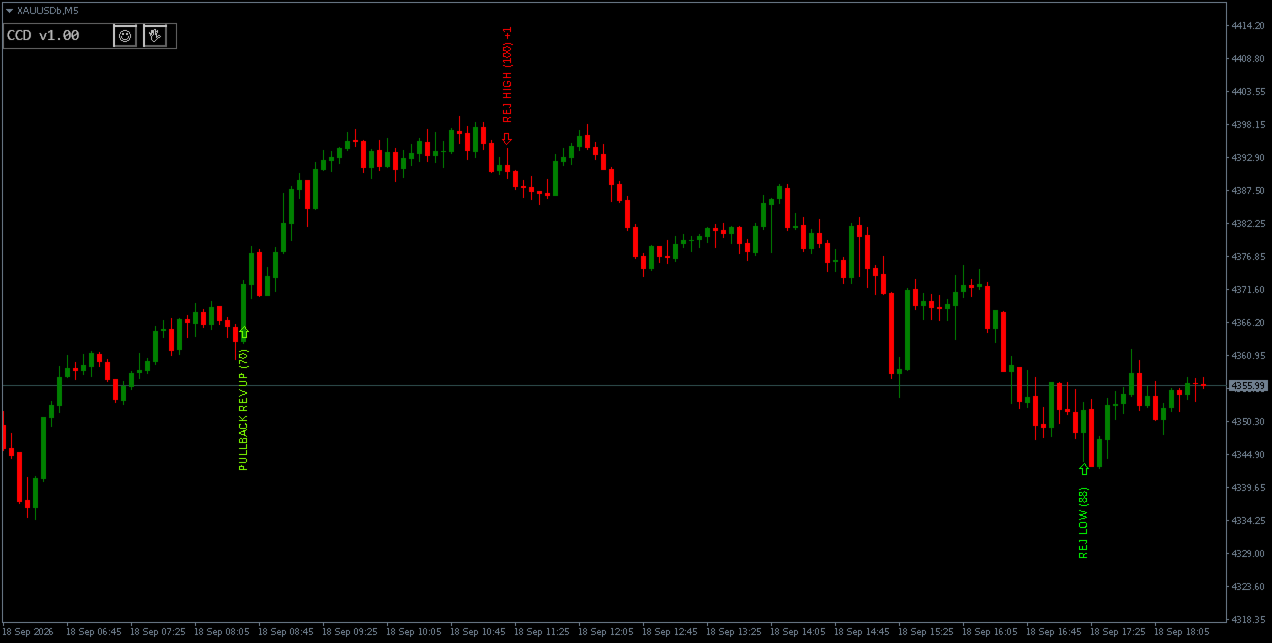
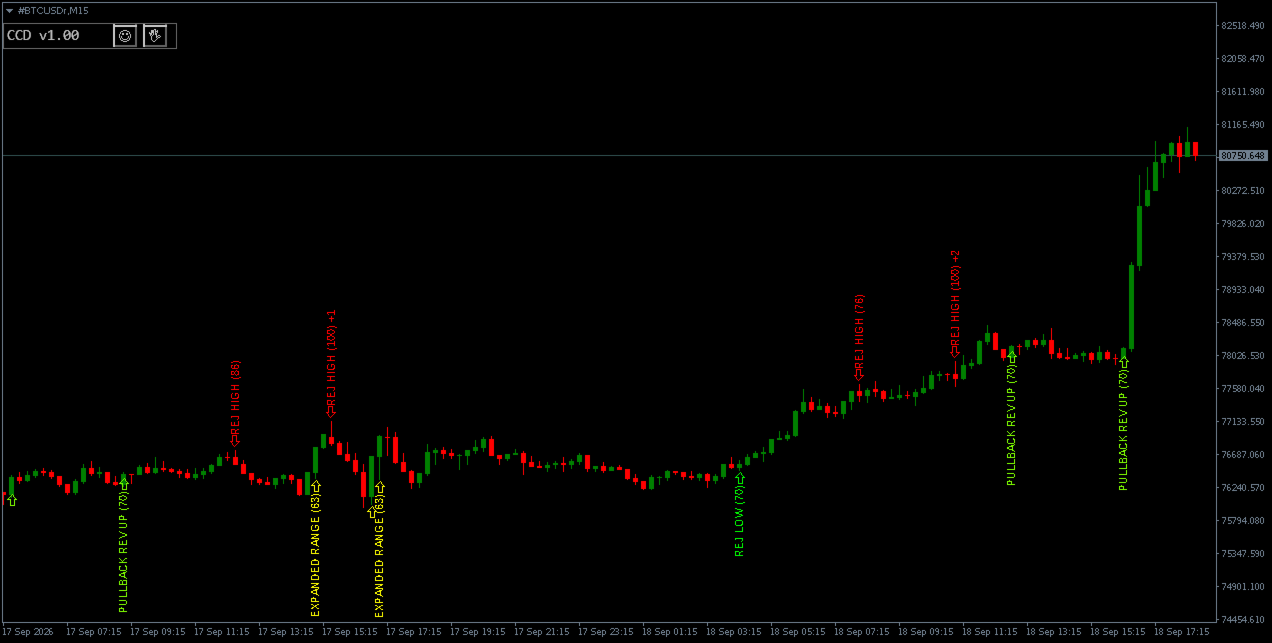
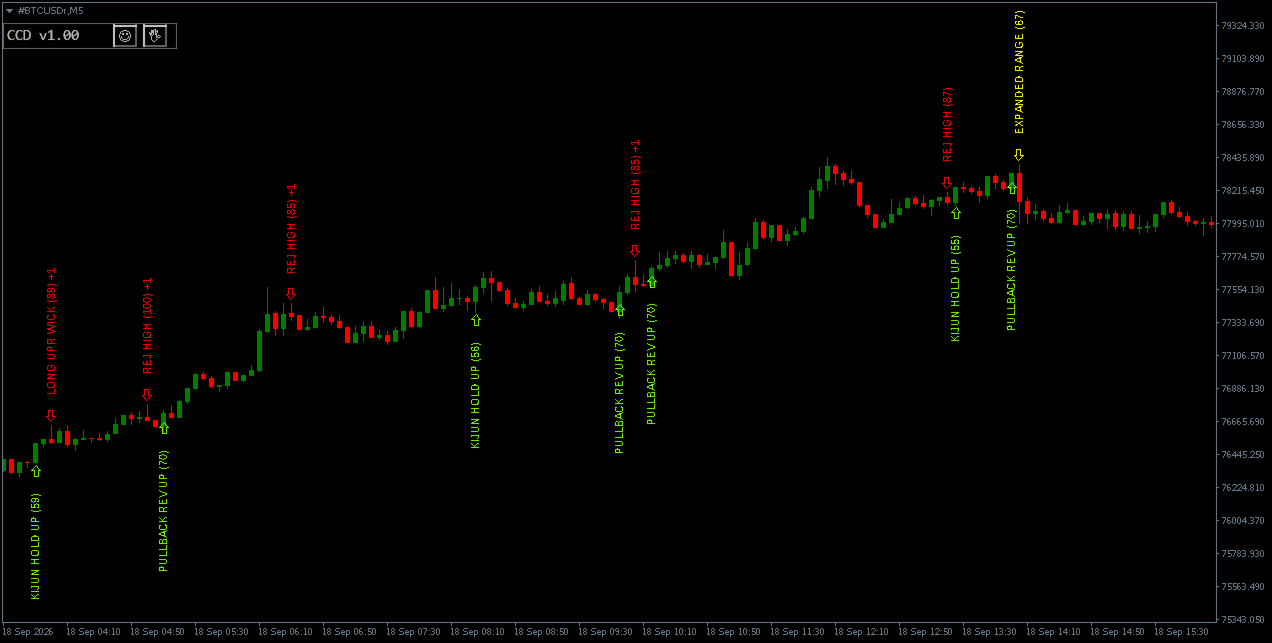
It detects 16 classic price-action patterns, grouped into three dedicated engines:
Rejection
Continuation
Warning
Each pattern receives a 0–100 confluence score. Every label is traceable to a documented, user-adjustable rule set.
KEY FEATURES
• 16 candlestick patterns across 3 purpose-built engines: Rejection, Continuation, and Warning
• Heuristic confluence scoring from 0–100
• Numeric thresholds are exposed as user inputs, so you can tune the sensitivity of every pattern
• Kijun-based trend filter
• Rejection and Warning signals can operate counter-trend
• Continuation signals can operate with the trend
• Up to 3 independent multi-timeframe slots
• Supports timeframes from M1 to MN1
• Historical labels available on load
• Non-repainting detection — calculations run on closed bars only
• Body-size quality filter to suppress low-conviction small-candle signals
• On-chart control panel
• Pause/Resume detection with one click
• Clear all labels with one click
• Popup, push, and email alerts
• One alert per candle per notification channel
• Every pattern can be enabled or disabled individually
RECOMMENDED FOR
Price-action and confluence-based traders who want scored candlestick signals across multiple timeframes, with visibility into the logic behind every label.
This is not a black-box signal generator.
IMPORTANT
This indicator is a visual analysis aid, not a signal service.
It uses only:
• OHLC price data
• ATR
It does not use:
• Volume
• Order flow
• Market profile data
The indicator does not place trades or manage positions.
The confluence score is a heuristic value, not a probability or win rate.
FULL TECHNICAL REFERENCE
OVERVIEW
The indicator scans up to 500 historical bars by default. The scan range is user-adjustable from 10 to 5000 bars.
It can scan:
• The current chart timeframe
• Up to 3 additional higher timeframes
For each bar, the indicator evaluates 16 pattern rules grouped into three engines:
• Rejection
• Continuation
• Warning
When more than one pattern triggers on the same bar, the pattern with the highest confluence score is drawn.
The number of additional matching patterns is appended to the label as "+N".
All detection runs on closed bars only — shift 1 and higher.
Labels on closed bars do not repaint.
The current forming bar is not analysed.
CONFLUENCE SCORE
Each pattern produces a confluence score between 0 and 100.
The score is a heuristic value calculated from a fixed formula specific to each pattern.
It is:
• Not a probability
• Not a win rate
• Not a validated measure of trading outcome
For example, a score of 70 does not mean that the pattern has a 70% probability of working.
It only means that the bar satisfied more of the conditions rewarded by that pattern's scoring formula.
Each pattern's score rewards the strength and quality of the conditions that produced the signal: the depth and dominance of the wick, the size of the body relative to recent volatility, the placement of the close within the bar's range, and the relationship of the bar to the prior bar's structure.
Thresholds that control these elements are exposed as inputs, so you can tune sensitivity without recompiling.
Default minimum score for display: 55
Bars whose highest-scoring pattern falls below this value are not labelled.
REJECTION ENGINE
The Rejection engine is designed to operate counter-trend.
When the trend filter is enabled:
• Bullish Rejection signals require a falling Kijun slope
• Bearish Rejection signals require a rising Kijun slope
REJ LOW — Bullish
A bullish bar that sweeps below the previous bar's low and closes back above it, producing a long lower wick.
The score rewards the depth of the wick relative to the body, how far the close travels back into the previous bar's range, and the size of the body relative to recent volatility.
REJ HIGH — Bearish
Mirror of REJ LOW. A bearish bar that sweeps above the previous bar's high and closes back below it, producing a long upper wick.
LONG LWR WICK — Bullish
A bullish bar whose lower wick dominates the body, signalling rejection of lower prices.
The score rewards the wick-to-body ratio, the placement of the close within the bar's own range, and the size of the body relative to recent volatility.
LONG UPR WICK — Bearish
Mirror of LONG LWR WICK. A bearish bar whose upper wick dominates the body.
STRONG BULL — Bullish
A large bullish body that follows several smaller-bodied bars and closes above their high. This pattern identifies displacement after compression.
The score rewards the size of the body relative to recent volatility.
STRONG BEAR — Bearish
Mirror of STRONG BULL. A large bearish body that closes below the low of the preceding smaller-bodied bars.
CONTINUATION ENGINE
The Continuation engine is designed to operate with the trend.
When the trend filter is enabled:
• Bullish Continuation signals require a rising Kijun slope
• Bearish Continuation signals require a falling Kijun slope
RANGE BRK UP — Bullish
A bar that breaks out above a recent compression range. The prior bars must show a narrow average range; the current bar must show an expanded range and close above the compressed range's high.
The score rewards the size of the breakout range relative to recent volatility.
RANGE BRK DN — Bearish
Mirror of RANGE BRK UP. A bar that breaks below a recent compression range and closes below the compressed range's low.
PULLBACK REV UP — Bullish
A bullish bar that follows two consecutive bearish bars and closes above the previous bar's high.
The score rewards the size of the current body relative to recent volatility.
PULLBACK REV DN — Bearish
Mirror of PULLBACK REV UP. A bearish bar that follows two consecutive bullish bars and closes below the previous bar's low.
KIJUN HOLD UP — Bullish
A bullish bar whose low approaches the Ichimoku Kijun-sen line and holds above it.
The score rewards the distance the close travels away from the low relative to recent volatility.
KIJUN HOLD DN — Bearish
Mirror of KIJUN HOLD UP. A bearish bar whose high approaches the Kijun line and holds below it.
WARNING ENGINE
The Warning engine identifies bars that may indicate:
• Exhaustion
• Indecision
• Failed moves
When the trend filter is enabled, Warning signals follow the same counter-trend rule as Rejection signals.
EXPANDED RANGE
A bar whose range is significantly larger than recent volatility, indicating an expansion move that may signal climax or exhaustion.
The score rewards the size of the range relative to recent volatility.
DOJI CLUSTER
Three consecutive bars, each with a body that is small relative to its own range. Direction is neutral.
This pattern always ignores the trend filter.
FAILED BRK UP — Bearish Warning
The previous bar broke above the recent high. The current bar opens and closes back inside that range, failing the breakout.
The score rewards how far the current bar's close travels back below the prior bar's low.
FAILED BRK DN — Bullish Warning
Mirror of FAILED BRK UP. The previous bar broke below the recent low. The current bar opens and closes back inside that range.
TREND FILTER
When enabled, the indicator measures the net change of the Ichimoku Kijun-sen over a configurable lookback period.
The default lookback is 3 bars. The lookback is user-adjustable.
A trend is considered:
• UP when the net Kijun change exceeds a configurable minimum strength
• DOWN when the net Kijun change falls below the negative of that minimum
The minimum strength is expressed as a fraction of ATR and is user-adjustable.
Signals that do not match the required direction for their engine are suppressed.
The trend filter can also be disabled completely.
BODY FILTER
When enabled:
• Rejection signals are suppressed if the current bar's body is smaller than a configurable minimum relative to ATR
• Warning signals are suppressed if the current bar's body is smaller than the same minimum
• Continuation patterns are exempt from this filter
The purpose of the filter is to avoid drawing labels on very small candles that satisfy a pattern rule geometrically but have little range.
The minimum is expressed as a fraction of ATR and is user-adjustable.
MULTI-TIMEFRAME SLOTS
Three optional higher-timeframe slots are provided.
Each slot can be:
• Enabled or disabled independently
• Assigned any timeframe from M1 to MN1
A slot is automatically disabled if the selected timeframe is not strictly higher than the current chart timeframe.
The indicator can draw up to 5 historical labels per slot by default. This value is user-adjustable.
A new label is added when a higher-timeframe bar closes.
A slot remains idle until sufficient history has loaded for the selected timeframe.
Default Slot Settings
• Slot 1: D1 — Disabled by default
• Slot 2: W1 — Disabled by default
• Slot 3: MN1 — Disabled by default
Users must enable the slots they want to use.
NOTIFICATIONS
Optional alerts are available for:
• Current timeframe
• Each enabled multi-timeframe slot
Three notification channels are supported:
• Popup alert with sound
• Push notification
• Email
Each channel has its own input setting.
Notifications are limited to one alert per candle per channel to avoid repeated alerts on the same bar.
ON-CHART PANEL
A small control panel is displayed directly on the chart.
It shows:
• Indicator name
• Indicator version
• Pause/Resume button
• Clear All Labels button
The panel position is user-adjustable.
INPUT PARAMETERS
General
• Maximum bars to scan
• Minimum confluence score to display
Engines
• Enable/disable Rejection engine
• Enable/disable Continuation engine
• Enable/disable Warning engine
Pattern Toggles
Each of the 16 patterns can be enabled or disabled individually.
Quality Filters
• Body filter ON/OFF
• Minimum body as ATR multiple
Trend Filter
• Trend filter ON/OFF
• Kijun period
• Kijun slope lookback
• Minimum slope strength as ATR multiple
Advanced Thresholds
All numeric thresholds used by the pattern rules are available as input parameters.
Multi-Timeframe
Three independent slots with:
• Timeframe selection
• Lookback depth
• Colour settings
Display
• Font size
• Per-engine colour settings
• Panel position
Notifications
• Popup
• Push
• Email
• Sound file
LIMITATIONS
This indicator is a visual analysis aid.
It:
• Does not generate buy or sell signals
• Does not place orders
• Does not manage positions
• Does not analyse volume
• Does not analyse order flow
• Does not analyse market profile
• Does not use data outside OHLC prices and ATR
Pattern detection depends entirely on the selected input thresholds. Different threshold settings will produce different labels.
The confluence score is a heuristic, and should not be interpreted as a statistical probability.
Past chart patterns are not indicative of future price behaviour.