VWAP with Standard deviation
- Indicadores
- Versão: 1.1
- Ativações: 5

VWAP (Volume Weighted Average Price)
What it is:
VWAP is the average price of an asset over a given period, weighted by volume rather than just time. Instead of a simple moving average that treats every candle equally, VWAP gives more weight to price levels where more volume traded — making it a better reflection of the "true" average price the market agreed on.
Formula (conceptually):
VWAP = Σ(Price × Volume) / Σ(Volume)
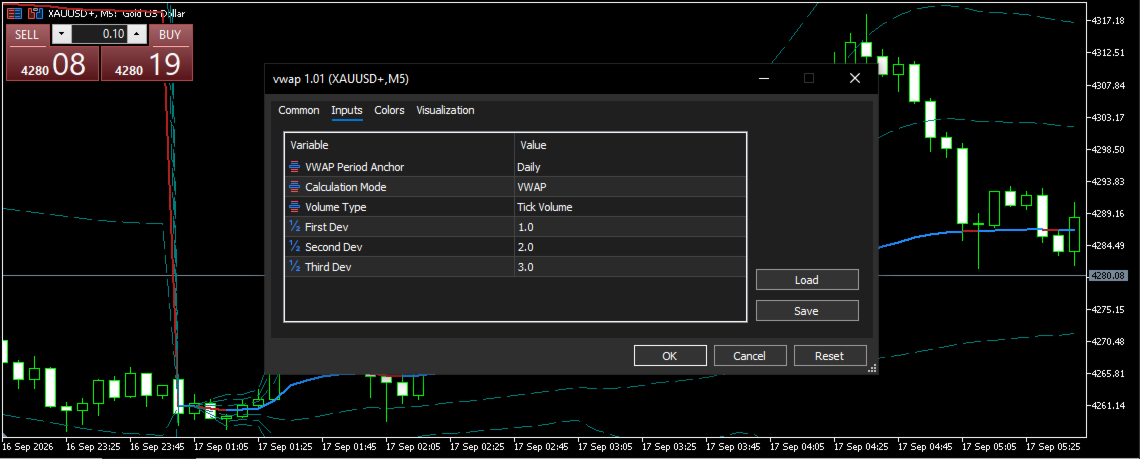
In your indicator (from the screenshot), it's set to:
- Anchor: Daily — VWAP resets at the start of each trading day
- Calculation Mode: VWAP
- Volume Type: Tick Volume (since Forex/CFD brokers like XAUUSD don't provide real traded volume, tick volume is used as a proxy)
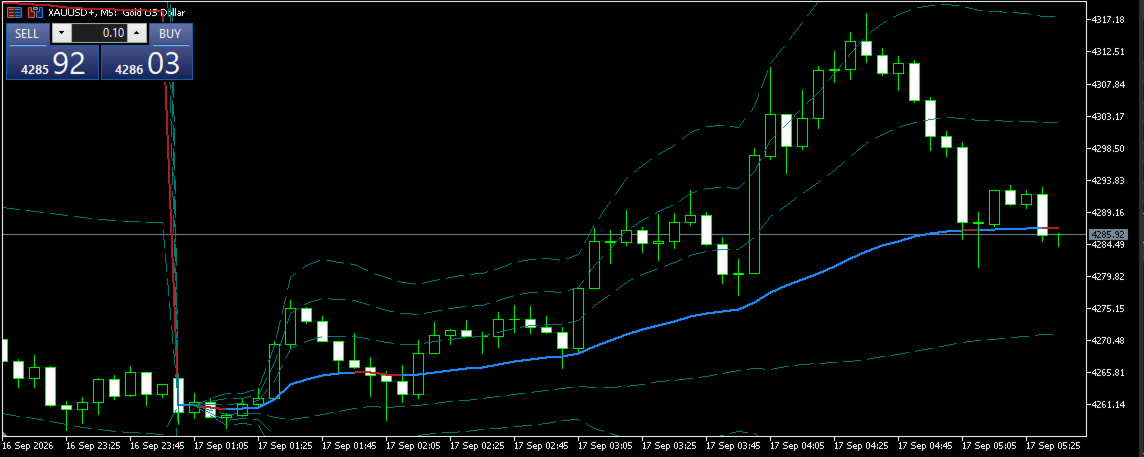
- Deviation bands: 1.0 / 2.0 / 3.0 — these plot standard-deviation bands above and below the VWAP line, similar to Bollinger Bands but centered on the volume-weighted price instead of a simple moving average
The bands you see in your chart (Image 2) are these deviation levels — the blue line is VWAP itself, and the dashed cyan lines are the 1st/2nd/3rd deviation bands.
How to use it
1. Trend/fair-value reference
- Price above VWAP → buyers are in control, bullish bias
- Price below VWAP → sellers are in control, bearish bias
- VWAP itself acts as a dynamic "fair value" line institutions often use as a benchmark for execution
2. Mean reversion (fits your VWAP bot logic)
- When price stretches to the 2nd or 3rd deviation band, it's statistically "overextended" relative to volume-weighted average
- A mean-reversion approach looks to fade back toward VWAP when price touches/exceeds an outer band, especially with signs of exhaustion (rejection wicks, momentum divergence)
- Tighter bands (1st dev) = more frequent, lower-probability reversion signals; outer bands (2nd/3rd dev) = rarer but higher-conviction extremes
3. Support/resistance
- VWAP and its bands often act as dynamic support in an uptrend or resistance in a downtrend, since many market participants (especially institutional) reference VWAP for entries
4. Session context matters
- Since it's anchored Daily, VWAP resets every new trading day — early-session VWAP is less reliable (few data points), and it becomes more meaningful as volume accumulates through the day
- Looking at your chart: price broke sharply upward from the VWAP zone early in the session, ran up through the bands, then pulled back toward the 1st deviation band — a classic expansion-then-reversion pattern
Practical entry idea for mean reversion:
- Wait for price to tag or pierce the 2nd deviation band
- Look for a reversal candle or momentum stall
- Enter targeting VWAP (mean) as first target, with the opposite band as a stretch target
- Stop loss beyond the 3rd deviation band (statistically low-probability zone to reach)