Gold Oracle Cipher
- Experts
- Versão: 1.1
- Atualizado: 15 setembro 2026
- Ativações: 10

**Every other number on a sales page is negotiable. Drawdown is not.**
Gold Oracle Cipher is the product for the trader whose real constraint is not return, it is how much of the account they can watch disappear before they turn the robot off. Its default setting produces the shallowest drawdown of anything in this range, by a wide margin.
That restraint is not timidity, it is headroom. Because the default sits so far below what the account can support, the risk control has more room above it than any other system here — you are not choosing between safety and ambition, you are choosing where on that range to stand.
### The number, and the number beside it
Across 2019-2026, on real tick data, the standard setting turned $5,000 into **$57,457** — with a worst drawdown of 10.1% and not one losing year.
Turn the dial up and the same trades produce **$163.1 MILLION** from $5,000 at 42.9% drawdown. Turn it off entirely — flat 0.10 lot, no compounding, every year weighted the same — and it still returns $123,828 on $10,000 (the flat-lot run starts from $10,000 rather than $5,000 — 0.10 lots on gold from a smaller account measures margin pressure, not the strategy).
That last figure is the one to weigh. It is the same edge with the arithmetic taken out.
The dial goes further than that. Pushed to its measured limit the same engine returns **$19.31 BILLION** at 62.1% drawdown — a figure this page publishes because it is real and refuses to recommend because it is not survivable by anyone who would have to watch it. It is the last screenshot in the set and it carries a warning band. The settings past it were run too: they liquidate the account part-way through the test — the next setting up runs out of money 29% of the way through the window and the curve simply stops, and they are not offered.
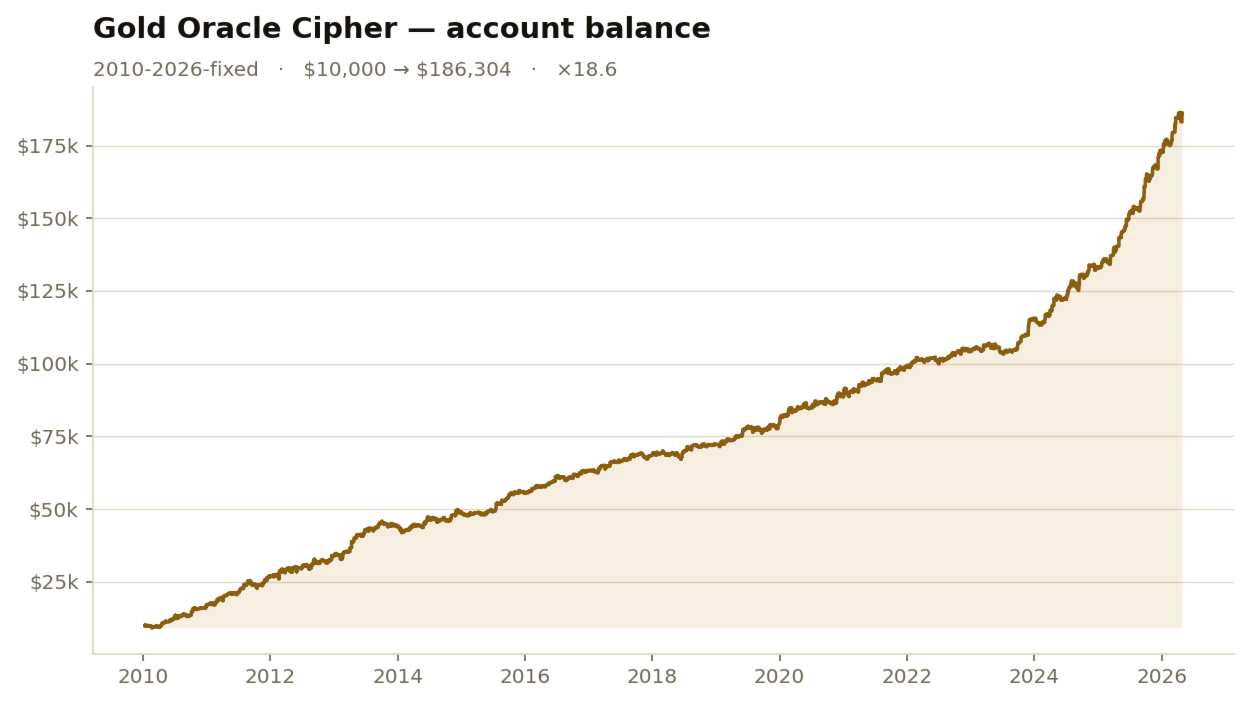
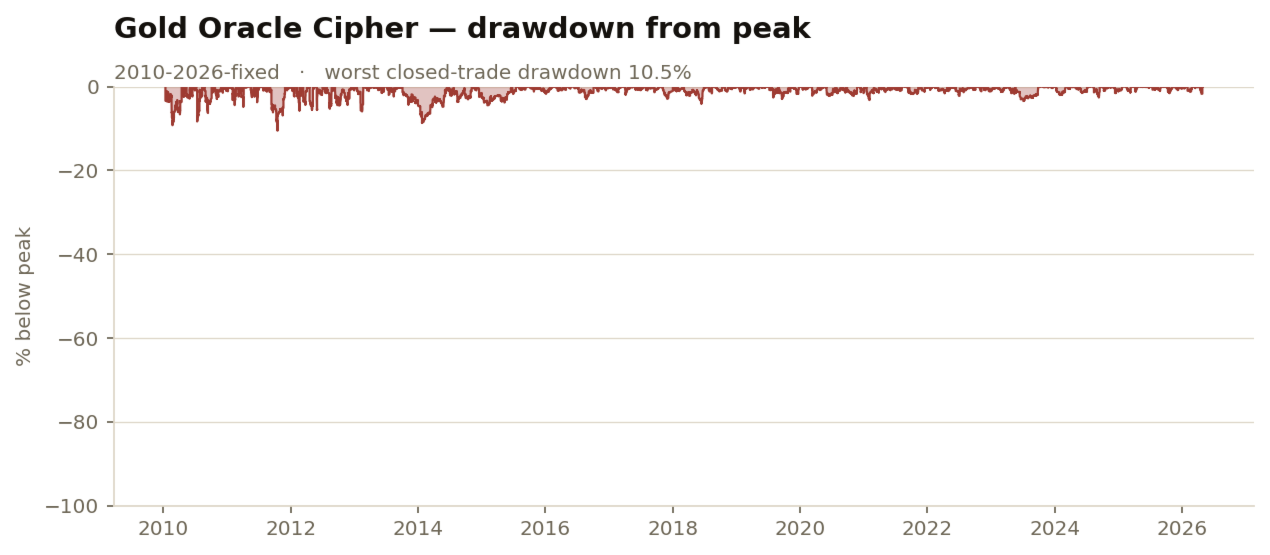
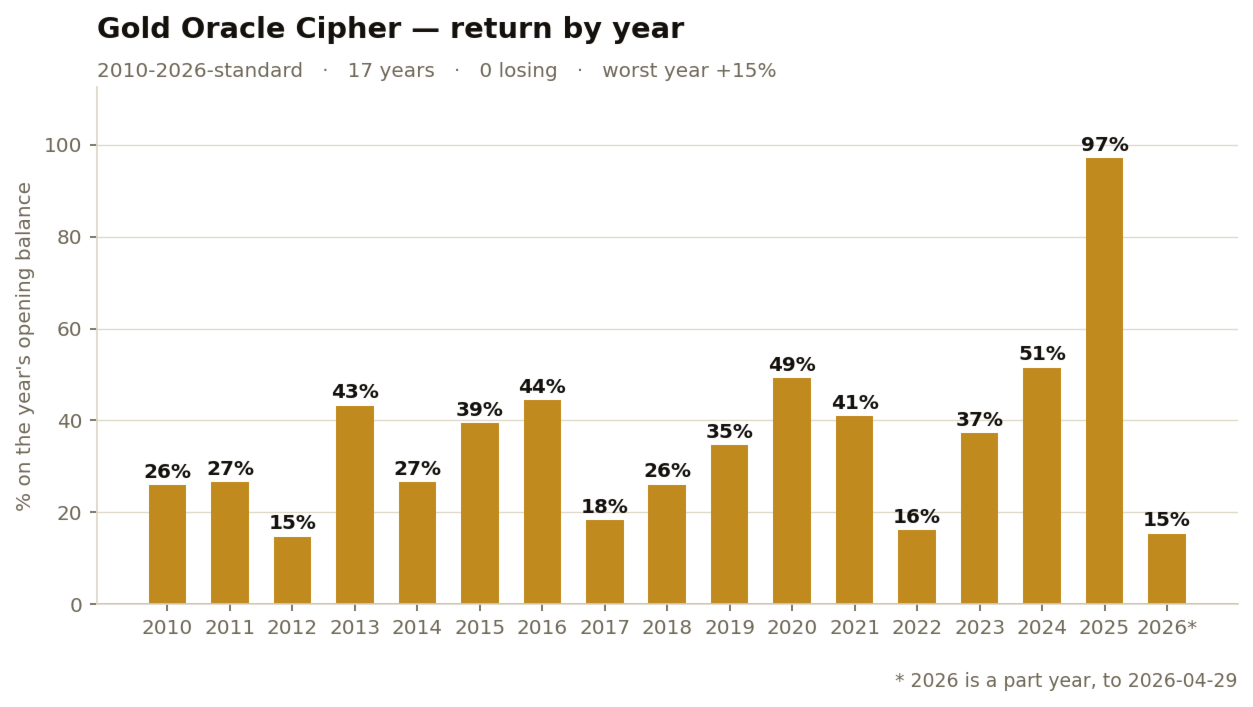
And it is not a recent-years result. Run across **2010-2026** — the whole modern history of gold, every one of its 17 years positive, not one parameter changed between them — the standard setting returns $770,893 from $5,000 at 17.9% drawdown, and the flat-lot run returns $186,304 from $10,000.
### What it trades
Cipher tracks a wider set of independent structures than the rest of the range and demands more confirmation before committing to any of them. Orders rest at levels rather than chasing price, exits are defined in advance, and positions that do not develop are released rather than defended. Fewer trades, and a much smoother line between them.
### What it will never do
Read this list twice, because it is the part most gold EAs cannot write.
- **No martingale.** Position size never increases after a loss.
- **No grid.** No ladder of orders added into a move against you.
- **No averaging down.** A losing position is never enlarged.
- **No hidden recovery mode** that quietly triples exposure to repair a bad week.
- **No stop-loss-free positions.** Every order carries a real, broker-side stop
from the moment it is filled.
Those five tricks are how a gold robot manufactures a smooth equity curve and a
five-star launch, and they are why so many of them end in a single afternoon.
This range refuses all of them, which is exactly why the drawdown figures on
this page are honest enough to publish.
### One input. You choose the risk.
The same engine, the same trades, the same entries and exits underneath
every row. The only thing that changes is one number in the settings.
That is the whole idea: you decide how hard it works, and you can see in
advance exactly what that decision costs.
**XAUUSD · real ticks · 2019-2026 · 1:500**
| setting | deposit | final balance | CAGR | worst drawdown | profit factor | losing years |
|---|---|---|---|---|---|---|
| **Fixed 0.10 lot** | $10,000 | **$123,828** | — | 16.66% | 1.83 | 0 of 8 |
| **Standard (×1)** | $5,000 | **$57,457** | **40%** | 10.11% | 2.07 | 0 of 8 |
| **×2** | $5,000 | **$967,228** | **105%** | 21.77% | 2.34 | 0 of 8 |
| **Growth (×3)** | $5,000 | **$13.3 MILLION** | **193%** | 32.85% | 2.45 | 0 of 8 |
| **Aggressive (×4)** | $5,000 | **$163.1 MILLION** | **313%** | 42.94% | 2.45 | 0 of 8 |
| **Extreme (×6)** | $5,000 | **$19.31 BILLION** | **691%** | 62.06% | 2.35 | 0 of 8 |
**XAUUSD · real ticks · 2010-2026 · 1:500**
| setting | deposit | final balance | CAGR | worst drawdown | profit factor | losing years |
|---|---|---|---|---|---|---|
| **Fixed 0.10 lot** | $10,000 | **$186,304** | — | 13.03% | 1.69 | 0 of 17 |
| **Standard (×1)** | $5,000 | **$770,893** | **36%** | 17.85% | 2.01 | 0 of 17 |
| **×4** | $5,000 | **$2.41 TRILLION** | **240%** | 73.31% | 2.26 | 0 of 17 |
**XAUUSD · real ticks · 2010-2019 · 1:500**
| setting | deposit | final balance | CAGR | worst drawdown | profit factor | losing years |
|---|---|---|---|---|---|---|
| **Fixed 0.10 lot** | $10,000 | **$72,247** | — | 13.03% | 1.53 | 0 of 9 |
| **Standard (×1)** | $5,000 | **$49,650** | **32%** | 17.85% | 1.50 | 0 of 9 |
| **×2** | $5,000 | **$687,437** | **81%** | 37.39% | 1.45 | 0 of 9 |
| **Aggressive (×3)** | $5,000 | **$7.9 MILLION** | **142%** | 55.69% | 1.41 | 0 of 9 |
| **Extreme (×4)** | $5,000 | **$82.0 MILLION** | **220%** | 73.31% | 1.38 | 0 of 9 |
*Measured but not offered on this window: **×6**. This rung failed to
reach the final bar because the account was liquidated; the stopped
curves are preserved as evidence and excluded from every figure above.*
*Drawdown is the worst **relative** equity drawdown — the deepest hole the
account was ever in as a percentage of its own peak, open positions
included. It is a harsher figure than the "maximal drawdown" most pages
quote, and it is the one that describes what you would have watched.*
*The fixed-lot rows show no growth rate on purpose. The lot size never
changes, so a percentage return shrinks every year purely because the
balance it is measured against has grown — it would make the longer and
better record look like the weaker one. What those rows are here to show is
the profit factor and the losing-year count, which is where a flat lot tells
the truth that a compounded curve cannot.*
*"Losing years" counts calendar years. The recent and full-history windows
end 1 May 2026, so their last year is a four-month stub; the isolated early
window ends 1 January 2019 and contains nine complete calendar years.*
**Every setting listed above survived the entire test window.** That is not
automatic at the top of a ladder — push risk far enough and the account is
liquidated part-way through, after which the tester reports a small, tidy,
entirely meaningless balance attached to a curve that simply stops. Those
settings were found, measured, and are not offered.
### The drawdown column is one path. Here is the distribution behind it.
Every drawdown figure on this page — anywhere, from anyone — is what
happened once, on the history that happened. History could have dealt the
same trades in a different order, and the honest question is not "how deep
did it go" but "how deep could it reasonably go".
So that was measured too. Each setting's trade ledger was resampled 10,000
times in blocks, which keeps winning and losing streaks intact instead of
shuffling them into a smoothness that never existed:
| setting | drawdown you see above | drawdown at the 95th percentile |
|---|---|---|
| Fixed 0.10 lot | 16.66% | **~25%** |
| Standard (×1) | 10.11% | **~17%** |
| ×2 | 21.77% | **~36%** |
| Growth (×3) | 32.85% | **~52%** |
| Aggressive (×4) | 42.94% | **~65%** |
| Extreme (×6) | 62.06% | **~83%** |
**Read that table before you choose a rung.** The realised drawdown on
every setting sits between the 31st and 53rd percentile of its own
distribution — which means this record has not yet had a genuinely bad
run, and you should not assume you have bought one that cannot. The
right-hand column is an estimate, scaled from what the resampling
measures onto the open-position equity your broker actually margins you
on; it is deliberately the harsher reading of the two.
**And there is a time cost, not only a depth cost.** At the Standard setting
the longest stretch below a previous high was 189 days in the test.
Across the resampled paths the median is 204 days, and **7% of them
spend more than a full year underwater**. A system that is working
exactly as designed can still spend a year looking like it is not. That
is the thing that makes people switch a profitable system off, and it is
why it is printed here rather than discovered later.
This distribution is included because one historical path does not
define the full range of possible outcomes.
### Six settings. That is the whole interface.
You are buying a finished system, not a parameter set to optimise. The internals
are fixed, tested, and sealed — what you control is how hard it works and how it
identifies itself on your account.
| setting | what it does |
|---|---|
| **Risk level** | the single dial that moves you along the ladder above |
| **Fixed lot** | set it and the risk model is bypassed entirely — flat size, every trade |
| **Maximum lot** | a hard ceiling on any single position, if you want one |
| **Magic number** | so it can share an account with your other systems |
| **Order comment** | your own tag in the trade history |
| **Maximum spread** | trades are skipped when your broker's spread is wider than this |
**Every row of the table above ships as a ready-made preset file.** Each rung
in the ladder - including the flat-lot one, and including the ceiling under its
warning - is a `.set` you load in one click, generated from the exact run whose
drawdown is printed beside it. Nothing to copy off this page by hand, and
nothing you have to guess at.
There is no optimisation to do, no timeframe to choose, and no set file to hunt
for. Attach it to an XAUUSD chart, load the preset for the risk you are willing
to carry, and leave it alone.
### Requirements
- **Symbol:** XAUUSD (gold). Any chart timeframe — the system uses its own.
- **Account:** hedging, any broker. A raw-spread or ECN account is strongly
preferred; the published tests use live raw-spread data.
- **Leverage:** 1:500 is what the tests were run at and what the risk model
assumes. Lower leverage restricts the upper risk levels.
- **Minimum deposit:** $500 at the lowest risk level. $2,000–$5,000 is the range
the system was designed and tested around.
- **A VPS is strongly recommended.** Resting orders need a terminal that is
actually online when the level is taken.
### The honest part
**The compounded figures on this page are a demonstration of edge, not a
promise of an account balance.** A backtest compounds without friction — it
fills every order at whatever size the arithmetic asks for, however large that
size has grown. A real account cannot. Past a certain equity those position
sizes exceed the volume actually available at the level, and fills the tester
grants for free start arriving with slippage, which compounds against the
account exactly the way profit compounds for it.
So read the largest numbers here for what they genuinely establish: **the edge
underneath them is strong, and it held its shape across the entire period
without one parameter being changed.** A strategy that produces those figures on
paper is a strategy capable of making serious money at a size a real account can
actually trade — which is precisely what the fixed-lot row is on this page to
show, because that row does not compound at all.
Beyond that, the usual and the true: this is a simulation on one broker's
historical data. Gold's character changes. Spreads widen in events. A live
account will not reproduce a simulation trade for trade, and past performance
does not predict future results. Trade at a risk level you can actually sit
through.