Noise Gate Trend System MT4

# Noise Gate Trend System


**Noise Gate Trend System** does exactly what its name says: it gates out market noise and only lets the real swings through. Around that gate it builds a complete, self-contained trading workstation — it tells you three things at a glance: *what the trend is*, *when to enter*, and *where your stop and targets are* — without a single extra indicator on the chart.

The gate itself is a **twin adaptive volatility range filter**. Price has to travel further than the market's own recent noise before the filter moves at all, so choppy ticks, wicks and micro-pullbacks simply never generate a signal.

Two gates run in parallel: a **narrow one** that produces the regular **Buy (L) / Sell (S)** signals, and a **wide one** that only opens on major volatility expansions and prints the rare **Strong** signals. Every regular signal automatically draws a full trade plan on the chart: **Entry, Stop Loss and five Take-Profit levels**. A multi-timeframe dashboard shows the trend of 10 timeframes at once, so you always know whether your signal is with or against the bigger picture.

Tuned on **XAUUSD (Gold)** intraday charts, it works on **any symbol and any timeframe** — Forex, metals, indices, crypto, stocks.

---

## What it does

- **The noise gate** — a fast (13-period) and a slow (200-period) volatility range are blended into one adaptive filter, so the gate tightens in quiet markets and widens automatically when volatility explodes. Anything smaller than the current noise level is ignored completely.
- **Buy / Sell signals ("L" / "S")** — printed only when the filter flips direction, so you get **one clean signal per swing**, never a stream of repeated arrows.
- **Strong signals** — a second gate, ~6× wider, marks the major reversals worth holding for a bigger move.
- **Automatic trade plan** — Entry, Stop Loss and **TGT 1–5** lines with price labels are drawn for the most recent signal and follow it until the next one appears.
- **Trend-coloured candles** — cyan while the filter is rising, magenta while it is falling (MT5). The MT4 version shows the same information as a colour-changing filter line.
- **Trend EMA** (default 200) plus the optional classic **EMA 9 / 21 / 55 / 100 / 200** ribbon, and an option to **only take signals in the direction of the Trend EMA**.
- **MTF dashboard** — current position, current trend, volume, and the bull/bear state of **10 timeframes** (M1 → D1) in one compact panel that you can dock to any chart corner. *(The MT4 build covers the 9 timeframes MT4 supports: M1 → MN.)*
- **Alerts** — pop-up, mobile push, e-mail or **Telegram** on every signal, in *instant* or *confirmed (bar-close)* mode.
- Available for both **MetaTrader 5** and **MetaTrader 4**. No DLL, no external dependency.

---

## Inputs

### Signals

| Input | Default | Meaning |
|-------|---------|---------|
| **Buy/Sell signals on/off** | true | Show the L / S labels |
| **Sensitivity (1-6)** | 1.5 | Width of the regular filter. **Lower = more signals**, higher = fewer and stronger |
| **Signal offset** | 1.0 | Distance of the labels from the candle, in % of the last 300-bar range |
| **Strong signals on/off** | true | Show the "Strong" labels |
| **Strong sensitivity** | 20 | Width of the strong filter — keep it well above *Sensitivity* |

### Smoothing

| Input | Default | Meaning |
|-------|---------|---------|
| **Smoothing source** | Close | Price used by both filters |
| **Smoothing range 1 period / sensitivity** | 13 / 8.0 | The fast range |
| **Smoothing range 2 period** | 200 | The slow range (shared by both filters) |

### Exit & entry levels

| Input | Default | Meaning |
|-------|---------|---------|
| **Show Entry/SL/TGT of the last signal** | true | Draw the trade plan |
| **SL %** | 0.25 | Stop distance, in **% of price** |
| **TGT 1…5 %** | 0.2 / 0.4 / 0.6 / 0.8 / 1.0 | The five target distances, in % of price |
| **Colours** | — | Entry / SL / TGT line colours |

### Trend & display

| Input | Default | Meaning |
|-------|---------|---------|
| **Only signal with the Trend EMA** | false | Filters out every signal that fights the Trend EMA slope |
| **Trend EMA length** | 200 | The thick blue trend line |
| **Show EMA 9/21/55/100/200** | false | The classic EMA ribbon |
| **Colour bars by trend** | true | Cyan / magenta candles (MT5) |
| **Show range filter lines** | false | Plot the raw filter and strong filter |
| **Bars back to draw signals** | 1000 | Keeps the chart light on long histories (0 = full history) |

### Dashboard & alerts

| Input | Default | Meaning |
|-------|---------|---------|
| **Show dashboard / Corner / Shift x,y** | true / bottom-left | Panel position, works in all four corners |
| **Background / Text / Bullish / Bearish colour, Text size** | — | Panel styling |
| **Alert only after the signal bar closes** | false | `false` = instant alert on the live bar; `true` = confirmed, non-repainting |
| **Notification type** | Alert | None / Telegram / Alert / Mobile push / E-mail |

> **The two knobs that matter most:** *Sensitivity* controls how many signals you get, and *SL % / TGT %* must match the volatility of your symbol and timeframe. Everything else can stay on default.

---

## How to read & trade the signals

### 1. Reading the chart

| What you see | What it means |
|--------------|---------------|
| **Cyan candles** | The filter is rising — bullish regime. Only look for longs |
| **Magenta candles** | The filter is falling — bearish regime. Only look for shorts |
| **Green "L" below a candle** | Regular **Buy** signal — the filter just flipped up |
| **Red "S" above a candle** | Regular **Sell** signal — the filter just flipped down |
| **"Strong" label** | The wide filter flipped too — a major reversal, not a scalp |
| **Blue "Ent:" line** | Entry price of the live trade plan (close of the signal bar) |
| **Dark red "SL:" line** | Suggested stop loss |
| **Green "TGT 1…5" lines** | The five scale-out targets |
| **Thick blue line** | Trend EMA (200) — the slow-money bias |
| **Dashboard → Current Position** | The side the filter is currently on (**Buy** or **Sell**) |
| **Dashboard → Current Trend** | Price vs EMA 144 on the **current** timeframe |
| **Dashboard → M1 … Daily rows** | Price vs EMA 144 on each timeframe — your multi-timeframe bias |

### 2. The three-step routine before every trade

**Step 1 — Bias (dashboard).** Look at the timeframe rows *above* the one you trade. Trading M5? Check M15, M30, H1, H4. If most of them are **Bullish**, take longs only. If they conflict (half green, half red), the market is rotating — expect chop and reduce size or stand aside.

**Step 2 — Regime (candle colour + Trend EMA).** The candles must already be the colour of the trade you want, and price should be on the correct side of the thick blue Trend EMA. A Buy signal printed under a falling Trend EMA is a counter-trend scalp — valid, but treat it as a quick trade to TGT 1–2, not a runner.

**Step 3 — Trigger (the label).** Only then act on the **L** or **S** label. The trade plan is drawn for you the moment the signal fires.

### 3. Long playbook (Buy — "L")

1. **Trigger:** a green **L** appears and the candles turn cyan.
2. **Entry:** at the close of the signal bar (the **Ent:** line), or on a shallow pullback toward the filter/Ent line. If you want confirmation, wait for the next candle to close above the signal candle's high.
3. **Stop loss:** the **SL:** line. If the recent swing low sits further away than the SL line and you have room in your risk budget, use the swing low instead — it is the structural invalidation.
4. **Position size:** calculate lots from the distance *Entry → SL* so the loss equals a fixed % of your account (1–2 % maximum). The SL is a **percentage of price**, so its pip value changes with the instrument — always size from the actual distance, never from a fixed lot.
5. **Targets:**
   - **TGT 1** — take 30–50 % off, move the stop to break-even. From here the trade cannot hurt you.
   - **TGT 2** — take another 25 %, trail the stop under the previous swing low or under the filter line.
   - **TGT 3–5** — let the remainder run. These are only reached in a strong trend day; if the dashboard has 4+ higher timeframes bullish, they are realistic.
6. **Hard exit:** close everything when the opposite **S** label prints, whatever the P/L. The filter has flipped and the reason for the trade is gone.

### 4. Short playbook (Sell — "S")

Exactly mirrored:

1. **Trigger:** a red **S** appears and the candles turn magenta.
2. **Entry:** at the close of the signal bar (**Ent:** line) or on a small pullback up toward it.
3. **Stop loss:** the **SL:** line above price, or the recent swing high if it is close by.
4. **Targets:** TGT 1 → 30–50 % off + stop to break-even; TGT 2 → another 25 % + trail; TGT 3–5 → runner.
5. **Hard exit:** on the opposite **L** label.

### 5. Trading the "Strong" signals

The Strong gate is roughly six times wider, so it only flips after a genuine volatility expansion — typically once or twice a week on an intraday chart.

- **Strong in the same direction as a fresh L/S** → the highest-conviction setup in the tool. Take the full plan and aim for TGT 3–5, not TGT 1.
- **Strong against your open position** → the swing you were riding is over. Exit, do not "wait for it to come back".
- **Strong alone (no regular signal on that bar)** → treat it as a **regime change warning**: from now on, prefer signals in the Strong direction and skip the counter-trend ones.
- Note that the Entry/SL/TGT lines are drawn for **regular** signals only, by design — the Strong marker is a bias tool, not a separate trade plan.

### 6. Managing the target ladder

The five targets are fixed percentages of price, which is what makes them work across instruments: 0.2 % is a normal scalp on gold, a solid intraday move on EURUSD, and small change on BTC.

- **Scalping:** trade TGT 1 and TGT 2 only. Anything beyond is statistically rare on M1–M5.
- **Intraday:** TGT 1–3, with the last third trailed by the filter line.
- **Swing:** ignore the first targets as exits, use them as milestones for tightening the stop, and hold for TGT 4–5 or the opposite signal.
- If price hits TGT 1 within **one or two candles**, momentum is strong — widen your ambition, not your risk.

### 7. Session & instrument notes for gold

- The best signals on XAUUSD come during the **London and New York sessions**. The Asian session produces narrow ranges where the filter flips back and forth — either raise *Sensitivity*, or simply don't trade it.
- Around **high-impact news** (NFP, CPI, FOMC), switch **Alert only after the signal bar closes = true** and let the first spike candle close before acting.
- On a 3300 gold price, the default 0.25 % stop is about **$8.25 (825 points)** — that is an H1-sized stop. For M5 scalping use 0.08–0.12 % instead (see presets below).

### 8. Signals to skip

- **Flat filter, alternating L and S every few bars** — that is a range, not a trend. Every signal there is a loss waiting to happen.
- **Signal against 3+ higher-timeframe rows** on the dashboard. The odds are simply not on your side.
- **A signal whose distance to SL is far larger than usual** (very wide range after a spike) — the % stop stays the same, but the market's noise has grown; either skip it or wait for the next pullback entry.
- **The very first signal of the session after a long gap or weekend** — the filter needs live volatility data to be meaningful.
- **A signal that appears when price is already at TGT-distance from the Trend EMA** — you are entering where others take profit.

### 9. Worked example

> Gold, M15. The dashboard shows M30, H1 and H4 all **Bullish**, price is above the blue Trend EMA, candles are cyan. A green **L** prints at 3312.40 and the plan appears: **Ent 3312.40 / SL 3304.12 / TGT1 3319.02 / TGT2 3325.65 / TGT3 3332.27**.
> You risk 1 % of the account over the 8.28-dollar stop distance. TGT 1 is hit 20 minutes later — you close half and move the stop to 3312.40 (break-even). Price grinds up, TGT 2 fills, you take another quarter and trail the rest under the filter line. Two hours later a red **S** prints at 3329 — you close the remaining quarter. Net: roughly 2.5 R with zero risk after the first target.

---

## Parameter presets

Start with the defaults, then choose the row that matches your style. **Adjust the SL/TGT percentages together with the timeframe** — they are the part that must fit your instrument's volatility.

### By trading style

| Style | Sensitivity | Strong sens. | SL % | TGT 1…5 % | Confirmed alerts |
|-------|:-----------:|:------------:|:----:|:---------:|:----------------:|
| **Scalping (M1–M5)** | 1.0 – 1.3 | 15 | 0.10 | 0.08 / 0.16 / 0.24 / 0.32 / 0.40 | ON |
| **Intraday (M15–M30)** | 1.5 (default) | 20 | 0.25 | 0.2 / 0.4 / 0.6 / 0.8 / 1.0 | ON |
| **Swing (H1–H4)** | 2.0 – 2.5 | 25 | 0.6 | 0.5 / 1.0 / 1.5 / 2.0 / 2.5 | OFF |
| **Position (H4–D1)** | 3.0 | 30 | 1.5 | 1.0 / 2.0 / 3.0 / 4.0 / 5.0 | OFF |

### By instrument

| Instrument | Suggested tweak |
|------------|-----------------|
| **XAUUSD (Gold)** | Defaults are tuned for this. On M5 use the scalping row |
| **Major FX** (EURUSD, GBPUSD) | Percentages are smaller in FX terms — halve the SL/TGT values (SL 0.12 % on M15) |
| **Indices** (US30, NAS100) | Keep the defaults, raise *Sensitivity* to 2.0 for fewer signals in the open |
| **Crypto** (BTCUSD, ETHUSD) | Very volatile — *Sensitivity* 2.5–3.0 and double the SL/TGT percentages |

> **Rule of thumb:** too many flip-flop signals → **raise Sensitivity**. Signals arriving too late → **lower it**. Change one value at a time and re-check on your own symbol before going live.

---

## Recommended usage

- **Stand-alone system:** dashboard for bias → candle colour for regime → L/S label for entry → the drawn plan for management. Nothing else needed.
- **Confluence tool:** use the MTF dashboard and the Strong signals as a filter for your existing strategy.
- **Automation:** all values (filter, trend state, signals) are exposed through indicator buffers, so an EA can read them with `iCustom`.

---

## Notes

- **Repaint behaviour:** with *Alert only after the signal bar closes = false*, the forming bar updates on every tick, so a label can appear and disappear until the candle closes — normal for any real-time signal tool. Set it to **true** for fully confirmed, non-repainting signals.
- The indicator needs at least **~400 bars of history** on the chart before the filter becomes valid.
- Everything drawn is removed cleanly when you detach the indicator.
- Works on any account type, any broker, any symbol. **MT5 and MT4 versions available.**


Produtos recomendados
O indicador cria cotações atuais, que podem ser comparadas com as históricas e, com base nisso, fazer uma previsão do movimento dos preços. O indicador possui um campo de texto para navegação rápida até a data desejada. Opções: Símbolo - seleção do símbolo que o indicador exibirá; SymbolPeriod - seleção do período do qual o indicador coletará dados; IndicatorColor - cor do indicador; HorisontalShift - deslocamento das cotações desenhadas pelo indicador pelo número especificado de barras; I
Divergence Matrix Pro for MetaTrader 4 Divergence Matrix Pro is a confirmed multi-oscillator divergence indicator for MetaTrader 4. It detects regular and hidden divergence between price and selected oscillators, then presents the confirmed structure through divergence lines, pivot labels, action markers, an optional current-timeframe Matrix Panel and optional alerts. The indicator is an analysis and confirmation tool. It does not open or close trades, and the signal score is not a win rate or a
SL Currency Heatmap
Chalin Saranga Jayathilake
5 (5)
Back testing can't; get indicator full performance  Trading the currency markets is a complex business. With so many pairs and multiple timeframes it is almost impossible to monitor them all – but with with the Currency Heatmap you can. The Currency Heatmap indicator delivers the information you need to base your trading decisions on the entire spectrum of currency pairs derived from the 8 major currencies; namely the US dollar, the Euro, the British Pound, the Swiss Franc, the Japanese Yen, t
Power Renko is an indicator which plots Renko bricks underneath the chart using a histogram. You can select the brick size and the timeframe of the Renko bricks as well as whether or not to use the close price or the high/low price of the candles. Renko bricks are based on price alone, not time, therefor the Renko bricks will not be aligned with the chart's time. They are extremely useful for trend trading and many different strategies can be formed from them. Buffers are provided allowing you t
MarketProfile EForex
Veridiana Adorno Kendrick
O Perfil de Mercado Mostra onde o preço passou mais tempo, destacando níveis importantes que podem ser usados na negociação. É uma ferramenta poderosa que se destina a reunir os componentes fundamentais que compõem cada mercado; preço / volume / tempo, e exibir visualmente sua relação em tempo real à medida que o mercado se desenvolve por um período de tempo pré-determinado. Ferramenta muito poderosa!
New, more accurate version of the Xmaster indicator. More than 200 traders from around the world have conducted more than 15,000 tests of different combinations of this indicator on their PCs in order to get the most effective and accurate formula. And here we present to you the "Xmaster formula indicator forex no repaint" indicator, which shows accurate signals and does not repaint. This indicator also sends signals to the trader by email and push. With the arrival of each new tick, it constan
Nice Trade Point
Muhammed Emin Ugur
This    Nice Trade Point     indicator is designed for signal trading. This indicator generates trend signals. It uses many algorithms and indicators to generate this signal. It tries to generate a signal from the points with the highest trend potential. This indicator is a complete trading product. This indicator does not need any additional indicators. The indicator certainly does not repaint. The point at which the signal is given does not change.     Features and Suggestions Time Frame
Alpha Trend sign has been a very popular trading tool in our company for a long time. It can verify our trading system and clearly indicate trading signals, and the signals will not drift. Main functions: Based on the market display of active areas, indicators can be used to intuitively determine whether the current market trend belongs to a trend market or a volatile market. And enter the market according to the indicator arrows, with green arrows indicating buy and red arrows indicating se
UTBot with HTS filter
Bartlomiej Tadeusz Tomaja
Advanced UT Bot & HTS Indicator This indicator is an advanced technical analysis tool that combines two methods: UT Bot and HTS (Higher Timeframe Smoothing) , to generate accurate buy and sell signals. 1. Indicator Structure Works within the main chart window and utilizes 11 buffers to store various data points, including arrows (buy/sell signals) and bands from both UT Bot and HTS systems. Uses colored arrows to represent different trading conditions: Blue arrows : Normal buy signals. Red arro
This indicator shows the gaps on the current chart with a rectangle shape and indicates when the gap is filled by closing the shape. Gaps are considered over the shadows. Allows sending alerts by e-mail or push notifications when a gap is found. Parameters SizeGAP - Size of the gap that you want to indicate; HGcolor1 - Color of the gap in an upward movement; HGcolor2 - Color of the gap in a downward movement; HGstyle - The style of rectangle to be drawn; StartCalculationFromBar - How many candl
VSA Histogram
Richard Bystricky
VSA - P (Volume Spread Analysis) Period-Based Histogram is a tool that visually represents market volume dynamics using Volume Spread Analysis principles, with a focus on highlighting key volume changes over specific time periods. The histogram captures changes in volume and price spread relationships in real-time, enabling traders to detect early signals of accumulation, distribution, and shifts in buying or selling pressure. Indicator is non repainting and working with real-time on tick data.
The indicator analyzes the change in the minimum and maximum prices of the previous bars fixing the entrance of the big players. If the change (delta) increases, a signal is displayed on the graph in the form of an arrow. At the same time, virtual trade on history is carried out. In case of a repeat of the signal, the positions are increased (refilling). Thus the lot of positions can differ. The results of virtual trading in the form of losses / losses, profitability, drawdown and transaction li
Price Magnet — Price Density and Attraction Levels Indicator Price Magnet is a professional analytical tool designed to identify key support and resistance levels based on statistical Price Density. The indicator analyzes a specified historical period and detects price levels where the market spent the most time. These zones act as “magnets,” attracting price action or forming a structural base for potential reversals. Unlike traditional Volume Profile tools, Price Magnet focuses on price-time d
VR Grid
Vladimir Pastushak
5 (3)
O indicador VR Grid foi projetado para criar uma grade gráfica com configurações definidas pelo usuário. Ao contrário da grade padrão , a VR Grid é usada para construir níveis circulares . Dependendo da escolha do usuário, o passo entre os níveis de rodada pode ser arbitrário. Além disso, ao contrário de outros indicadores e utilitários, o VR Grid mantém a posição da rede mesmo quando o período de tempo muda ou o terminal é reiniciado. Configurações, arquivos de configuração, versões demo, instr
FREE
O indicador Crypto_Forex "Auto FIBO Pro" é uma ótima ferramenta auxiliar na negociação! - O indicador calcula e coloca automaticamente no gráfico os níveis de Fibonacci e as linhas de tendência locais (cor vermelha). - Os níveis de Fibonacci indicam áreas-chave onde o preço pode reverter. - Os níveis mais importantes são 23,6%, 38,2%, 50% e 61,8%. - Pode utilizá-lo para scalping de reversão ou para negociação de grelha de zona. - Existem muitas oportunidades para melhorar o seu sistema atual ut
TouchGuard Alert – Advanced Price Alert & Notification Indicator for MetaTrader 4 (MT4) TouchGuard Alert   is a fast, lightweight, and highly accurate price-touch   Alert & Notification   system designed for   MetaTrader 4 (MT4)   and   MetaTrader 5 (MT5) . It automatically sends real-time   Alerts, Pop-Up Alerts, Email Notifications, Push Notifications   and early-warning notifications when price touches or approaches your chart objects. Key Features (High-Precision Alert & Notification System)
RSI TrendLine Divergency Message is an indicator for the MetaTrader 4 trading platform. Unlike the original indicator, this three in one version has a system of alerts that inform on market situation changes. It consists of the following signals: when the Main line crosses the levels of extreme zones and 50% level; when the Main line crosses the Trend line in the indicator window; divergence on the last bar. Parameters of levels of extremum, 50-level and divergence are adjustable. Parameters La
Introduction It is common practice for professional trades to hide their stop loss / take profit from their brokers. Either from keeping their strategy to the themselves or from the fear that their broker works against them. Using this indicator, the stop loss / take profit points will be drawn on the product chart using the bid price. So, you can see exactly when the price is hit and close it manually.  Usage Once attached to the chart, the indicator scans the open orders to attach lines for t
The   Trendlines Oscillator   helps traders identify trends and momentum based on the normalized distances between the current price and the most recently detected bullish and bearish trend lines. The indicator features bullish and bearish momentum, a signal line with crossings, and multiple smoothing options. USAGE The   Trendlines Oscillator   works by systematically: Identifying pivot highs and lows. Connecting pivots to form bullish (support) and bearish (resistance) trendlines. Measuring
Axiom Points
Tatiana Savkevych
Axiom Point — Precision Structural Breakout Indicator Axiom Point is a high-performance analytical indicator designed to identify high-probability reversal zones using price-action behaviour and adaptive balance filtering. The indicator applies a multi-layer analytical model to detect moments when price transitions beyond its normal equilibrium area, indicating a potential shift in market momentum. Unlike conventional trend-following tools, Axiom Point focuses on so-called points of no return —
VolumeDeltaM1
Stanislav Korotky
3.25 (4)
This indicator provides tick volume delta analysis on M1 timeframe. It monitors up and down ticks and sums them up as separate volumes for buys and sells, as well as their delta volumes, and volume clusters on price scale within a specified number of bars. This indicator complements VolumeDelta , which uses similar algorithms but does not process ticks and therefore cannot work on M1. VolumeDelta can show its signals on entire history because it reads M1 volumes for calculations on higher timefr
Indicador Crypto_Forex "Exibição de Rebaixamento Relativo" para MT4, ferramenta de negociação útil. Este é um indicador OBRIGATÓRIO para os traders que utilizam sistemas de grid trading!!! - O indicador de visualização de drawdown relativo mostra o DD relativo atual ou o lucro flutuante em % na sua conta. - Os alertas para PC e dispositivos móveis estão integrados com nível de disparo ajustável. - O indicador indica também o saldo e o capital próprio da conta. - É possível localizar os valores
This indicator is the undisputed leader among the indicators. And for this statement there is a good reason. The indicator builds a very high quality channel in which it generates signals to enter! What is the ideal strategy for the trader, since the trader always hesitates when choosing a strategy for the job. That is, this indicator will allow you to solve the dilemma of choosing a job by trend or to the channel, since it combines these two basic concepts. Working with the indicator is very
Magic Balance
Daniil Evstratenko
The indicator shows which trading pairs, strategies, robots and signals that you use are profitable and which are not. The statistic of trades and balance graph are displayed in the account currency and pips - to switch simply click on the graph. button "$"(top left) - minimize/expand and move the indicator panel button ">"(bottom right) - stretching and resetting to the original size Statistic of trades 1 line - account balance, current profit and lot of open trades; 2 line - the number of all
MACD Display is a MACD disaplay and cross monitoring indicator,which can works on 6 timeframe at same time. Indicator advantage: 1. Deviation from the point can be drawn on the main picture and indicator drawing. It is convenient to observe and can be hidden or displayed by parameter setting. 2. Deviation from the entry point is clearly indicated by the arrow in the drawing. 3. Cross-cycle monitoring can simultaneously monitor the MACD deviation and the golden dead fork of the six-cycle framewor
Tin
Maryna Shulzhenko
The Tin indicator is designed to visually display the current trend in the market. One of the key aspects of foreign exchange market analysis is to determine the trend, which is the sustainable direction of price movement. To do this, the Tin indicator uses algorithms that smooth out sharp fluctuations that do not have a significant impact on the overall trend. A trend can be either upward (bullish) or downward (bearish). Typically, a trend persists for a long time before abruptly changing dir
Gold Venamax MT4
Sergei Linskii
3 (2)
Gold Venamax   - este é o melhor indicador técnico de ações. O algoritmo do indicador analisa o movimento do preço de um ativo e reflete a volatilidade e as zonas de entrada potenciais. Recursos do indicador: Este é um super indicador com Magic e dois blocos de setas de tendência para uma negociação confortável e lucrativa. O botão vermelho para alternar blocos é exibido no gráfico. Magic é definido nas configurações do indicador, para que você possa instalar o indicador em dois gráficos exibin
Trendiness Index
Libertas LLC
5 (3)
"The trend is your friend" is one of the best known sayings in investing, because capturing large trendy price movements can be extremely profitable. However, trading with the trend is often easier said than done, because many indicators are based on price reversals not trends. These aren't very effective at identifying trendy periods, or predicting whether trends will continue. We developed the Trendiness Index to help address this problem by indicating the strength and direction of price trend
O Scanner Multimoeda do Índice Direcional Médio (ADX) MT4 é um indicador de negociação avançado projetado para analisar múltiplos pares de moedas simultaneamente. Ele beneficia os traders que buscam aprimorar seu processo de tomada de decisão, fornecendo sinais em tempo real com base no Índice Direcional Médio, permitindo uma análise eficiente das tendências do mercado. Esta ferramenta simplifica a experiência de negociação ao facilitar a identificação da força da tendência e do movimento direci
GS trendS
Aleksander Gladkov
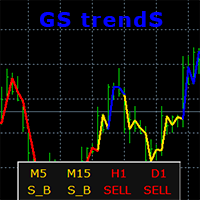
GS trendS is a trend indicator that can be used for any Forex financial instrument. The indicator does not redraw and does not lag. Recommended timeframe H1. It is possible to select the trend algorithm settings {Only Open, Average Open/Close, Average High/Low} The color indicates the direction of the trend: yellow - direction can be SELL or BUY (S_B) blue - uptrend (BUY) red - downward trend (SELL) The indicator panel displays trend values of 5 timeframes for the current price level. The va
Os compradores deste produto também adquirem
Trend SniperX MT4
Sarvarbek Abduvoxobov
5 (3)
Trend Sniper X é um indicador de tendência multitemporal para MetaTrader 5 que ajuda os traders a identificar a direção da tendência e potenciais pontos de reversão com clareza e precisão. Para MT5: https://www.mql5.com/en/market/product/181101 Informação de preço: O preço atual é promocional e está sujeito a alterações à medida que novas atualizações e recursos forem lançados. Canal Code2Profit Domine o Mercado com Análise Multitemporal! Como Maximizar sua Taxa de Acerto com o Trend Sniper X: R
SR Liquidity
Oleg Rodin
5 (2)
O SR Liquidity é um indicador de trading projetado para revelar as zonas ocultas onde a liquidez do mercado se concentra e o preço reage com maior intensidade. Essas áreas específicas de liquidez funcionam como níveis poderosos de suporte e resistência, oferecendo um mapa claro de onde é mais provável que o mercado reverta. Em vez de traçar linhas comuns de Suporte e Resistência, o SR Liquidity analisa o comportamento real dos preços para detectar as zonas onde se acumulam pressões de compra e v
Miraculous Indicator Binary & Forex v3 StrategySafe Miraculous Indicator Binary & Forex v3 StrategySafe é um indicador profissional criado para traders que desejam sinais claros, confirmações avançadas e uma forma estruturada de operar nos mercados Binary e Forex. A versão v3 traz MIR Dashboard, Miraculous Confirmation Dashboard, GANN Law, níveis Square of 9, ângulos GANN e um modo Forex mais completo para analisar o mercado com mais precisão. Principais recursos Modo Binary e modo Forex em um ú
Gann Made Easy
Oleg Rodin
4.84 (172)
Gann Made Easy é um sistema de negociação Forex profissional e fácil de usar, baseado nos melhores princípios de negociação usando a teoria do sr. W. D. Gann. O indicador fornece sinais precisos de COMPRA e VENDA, incluindo níveis de Stop Loss e Take Profit. Você pode negociar mesmo em movimento usando notificações PUSH. Entre em contato comigo após a compra para receber instruções de negociação e ótimos indicadores extras gratuitamente! Provavelmente você já ouviu muitas vezes sobre os métodos
M1 Sniper
Oleg Rodin
4.97 (30)
O M1 SNIPER é um sistema indicador de negociação fácil de usar. É um indicador de seta projetado para o período M1. O indicador pode ser usado como um sistema independente para scalping no período M1 e pode ser usado como parte do seu sistema de negociação existente. Embora este sistema de negociação tenha sido projetado especificamente para negociação no M1, ele também pode ser usado em outros períodos. Originalmente, desenvolvi este método para negociar XAUUSD e BTCUSD. Mas considero-o útil ta
DayTrader PRO MT4
Davit Beridze
4.6 (10)
DayTrader PRO MT5:  https://www.mql5.com/en/market/product/186222 O DayTrader PRO é um indicador de trading avançado que combina o Filtro de Laguerre de John Ehlers com um potente motor de otimização automática. Em vez de utilizar parâmetros fixos, o indicador procura automaticamente as melhores definições com base nas condições recentes do mercado, ajudando-o a adaptar-se à volatilidade variável sem necessidade de ajustes manuais constantes. O indicador gera sinais claros de COMPRA (BUY) e VEND
Scalper Inside PRO
Alexey Minkov
4.74 (69)
Scalper Inside PRO helps you read the intraday trend and plan a trade before you enter the market. It is built around three exclusive strategies for a sharper read of the market. The moment a signal appears, the indicator evaluates market direction and calculates the key levels, so you see the potential entry, the expected stop-loss and several profit-taking levels in advance. Detailed performance statistics show how different instruments and strategies performed in history and help you pick ass
Este produto foi atualizado para o mercado de 2026 e otimizado para as versões mais recentes do MT5. AVISO DE ATUALIZAÇÃO DE PREÇO: Smart Trend Trading System está atualmente disponível por $99 . O preço aumentará para $199 após as próximas 30 compras . OFERTA ESPECIAL: Após comprar o Smart Trend Trading System, envie-me uma mensagem privada para receber o Smart Universal EA GRÁTIS e transformar seus sinais do Smart Trend em operações automatizadas. Smart Trend Trading System é um sistema de tr
O Oscilador de Quebra de Volume é um indicador que combina o movimento dos preços com as tendências de volume sob a forma de um oscilador. Queria integrar a análise de volume nas minhas estratégias, mas sempre me desiludiram a maioria dos indicadores de volume, como OBV, Money Flow Index, A/D, mas também como Volume Weighted Macd e muitos outros. Por isso escrevi este indicador para mim próprio, estou satisfeito com a sua utilidade e por isso decidi publicá-lo no mercado. Principais caracterí
Dynamic Forex28 Navigator
Bernhard Schweigert
4.43 (7)
Dynamic Forex28 Navigator - A ferramenta de negociação Forex de última geração. ATUALMENTE 49% DE DESCONTO. Dynamic Forex28 Navigator é a evolução dos nossos indicadores populares de longa data, combinando o poder de três em um: Indicador Advanced Currency Strength28 (695 avaliações) + Advanced Currency IMPULSE com ALERTA (520 avaliações) + Sinais CS28 Combo (Bônus). Detalhes sobre o indicador https://www.mql5.com/en/blogs/post/758844 O que o Next-Generation Strength Indicator oferece?  Tudo
For MetaTrader5 you can download it from the link https://www.mql5.com/en/market/product/187668 True Signal FX is a multi-timeframe trading indicator for MetaTrader 4 designed to provide a complete trading setup directly on the chart. Instead of displaying a single directional signal, the indicator combines market analysis, signal confirmation and trade level calculation in one workspace. When a setup is detected, the trader can see the direction, Entry, Stop Loss and Take Profit levels toget
Neuro Poseidon MT4
Daria Rezueva
4.74 (46)
Neuro Poseidon is a new indicator by Daria Rezueva. It combines precise trading signals with adaptive TP/SL levels - creating best possible trades as a result! Message me and get  Neuro Poseidon Assistant  as a gift to automize your trading process! What makes it stand out? 1. Proven profitability on all assets and timeframes 2. Only confirmed BUY and SELL signals present on the chart 3. Adaptive TP & SL levels generated by the software for each trade 4. Easy to understand - suitable for all
PZ Support Resistance
PZ TRADING SLU
3.33 (3)
Cansado de traçar linhas de suporte e resistência? A Resistência de suporte é um indicador de período múltiplo que detecta e plota automaticamente linhas de suporte e resistência no gráfico com um toque muito interessante: conforme os níveis de preços são testados ao longo do tempo e sua importância aumenta, as linhas se tornam mais espessas e mais escuras. [ Guia de instalação | Guia de atualização | Solução de problemas | FAQ | Todos os produtos ] Melhore sua análise técnica da noite para o d
Quantum Breakout Indicator PRO
Bogdan Ion Puscasu
4.96 (26)
Apresentando       Quantum Breakout PRO   , o inovador Indicador MQL5 que está transformando a maneira como você negocia Breakout Zones! Desenvolvido por uma equipe de traders experientes com experiência em negociação de mais de 13 anos,   o Quantum Breakout PRO   foi projetado para impulsionar sua jornada comercial a novos patamares com sua estratégia inovadora e dinâmica de zona de rompimento. O Quantum Breakout Indicator lhe dará setas de sinal em zonas de breakout com 5 zonas-alvo de lucro
Actualmente 30% OFF ! A melhor solução para qualquer novato ou comerciante especializado! Este software de painel de instrumentos está a funcionar em 28 pares de moedas. É baseado em 2 dos nossos principais indicadores (Advanced Currency Strength 28 e Advanced Currency Impulse). Dá uma grande visão geral de todo o mercado Forex. Mostra valores avançados de força da moeda, velocidade de movimento da moeda e sinais para 28 pares de divisas em todos os (9) períodos de tempo. Imagine como a sua n
System Trend Pro
Aleksandr Makarov
5 (3)
The indicator no repaint!!!  The indicator has   MTF   mode, which adds confidence to trading on the trend (   no repaint   ). How to trade? Everything is very simple, we wait for the first signal (big arrow), then wait for the second signal (small arrow) and enter the market in the direction of the arrow. (See screens 1 and 2.) Exit on the opposite signal or take 20-30 pips, close half of it, and keep the rest until the opposite signal. By the way, it is on Scalping that most traders make m
Pro Trend Scanner
Nikolay Georgiev
5 (1)
Update: Push to mobile notification is now added as optinal in the settings. Most traders fail to generate profit because of the lack of so-called filters and scanners. If you want to win at trading you need a solid system and also a filtering tool for some or all of your entry criteria. It is impossible to follow 24 currency pairs, all the indices, stocks and commodities without a filtering tool. Imagine you can get an email any time CCI crosses bellow 100 and 0 when the price is bellow MA5 an
PZ Trend Trading
PZ TRADING SLU
4.8 (5)
O Trend Trading é um indicador projetado para lucrar o máximo possível com as tendências que ocorrem no mercado, cronometrando retrocessos e rupturas. Ele encontra oportunidades de negociação analisando o que o preço está fazendo durante as tendências estabelecidas. [ Guia de instalação | Guia de atualização | Solução de problemas | FAQ | Todos os produtos ] Negocie mercados financeiros com confiança e eficiência Lucre com as tendências estabelecidas sem ser chicoteado Reconhecer retrocessos
Currency Strength Exotics
Bernhard Schweigert
4.88 (33)
ACTUALMENTE 20% DE DESCONTO ! A melhor solução para qualquer novato ou comerciante especializado! Este Indicador é especializado para mostrar a força da moeda para quaisquer símbolos como Pares Exóticos de Commodities, Índices ou Futuros. É o primeiro do seu género, qualquer símbolo pode ser adicionado à 9ª linha para mostrar a verdadeira força da moeda de Ouro, Prata, Petróleo, DAX, US30, MXN, TRY, CNH etc. Esta é uma ferramenta de negociação única, de alta qualidade e acessível, porque inco
Atomic Analyst
Issam Kassas
5 (13)
Este produto foi atualizado para o mercado de 2026 e otimizado para as versões mais recentes do MT5. AVISO DE ATUALIZAÇÃO DE PREÇO: Atomic Analyst está atualmente disponível por $99 . O preço aumentará para $199 após as próximas 30 compras . OFERTA ESPECIAL: Após comprar o Atomic Analyst, envie-me uma mensagem privada para receber o Smart Universal EA GRÁTIS e transformar seus sinais do Atomic Analyst em operações automatizadas. Atomic Analyst é um indicador de trading de Price Action sem repa
Advanced Supply Demand
Bernhard Schweigert
4.91 (302)
Atualmente com 30% de desconto! A melhor solução para qualquer Trader Novato ou especialista! Este indicador é uma ferramenta de negociação exclusiva, de alta qualidade e acessível porque incorporamos uma série de recursos proprietários e uma nova fórmula. Com esta atualização, você poderá mostrar fusos horários duplos. Você não só será capaz de mostrar um TF mais alto, mas também mostrar ambos, o TF do gráfico, MAIS o TF mais alto: MOSTRANDO ZONAS ANINHADAS. Todos os traders de Oferta e Demanda
Currency Strength Wizard é um indicador muito poderoso que fornece uma solução completa para uma negociação bem-sucedida. O indicador calcula o poder deste ou daquele par forex usando os dados de todas as moedas em vários intervalos de tempo. Esses dados são representados em uma forma de índice de moeda fácil de usar e linhas de energia de moeda que você pode usar para ver o poder desta ou daquela moeda. Tudo o que você precisa é anexar o indicador ao gráfico que deseja negociar e o indicador mo
Money Flow Profile MT5 HERE   Here   our more valuable tools SMC Trend Trading   ,  Easy SMC Trading  ,  Institutional SMC Architect Volume Analysis Tools  ,  Volume flow Profile  ,  Market volume profile  , FVG with Volume  , Liquidity Heatmap Profile  ,  Volume Spread Analysis This Master Edition is engineered for clarity and speed, featuring a unique Auto-Theme Sync system that instantly beautifies your chart layout upon loading. Key Features: True Money Flow Calculation: Goes beyond stand
KURAMA GOLD SIGNAL PRO (MT4) — Filtro de 7 camadas · TP/SL automático · Pontuação de qualidade · Salvamento do histórico de sinais | Sistema completo de trading para XAUUSD Sem repintura em tempo real. No instante em que um sinal aparece, a seta, a entrada, o TP e o SL ficam travados no lugar e nunca mais se movem. O que você opera é esse sinal em tempo real. E na v7.20, cada sinal realmente enviado é salvo automaticamente e restaurado com exatidão após reiniciar. BÔNUS PARA
Scalper LFX Gold
Ana Claudia De Oliveira Braga Pantaleao
1 (1)
SCALPER LFX GOLD Um indicador para XAUUSD M1, feito por quem realmente opera M1 Se você já tentou escalpelar ouro no M1, sabe como é: o preço se move rápido, os sinais "bonitos" no gráfico raramente aparecem no momento certo, e a maioria dos indicadores de entrada foi pensada pra swing trade, não pra esse ritmo. Foi exatamente essa frustração que motivou o Scalper LFX Gold — um indicador construído do zero, testado e refinado especificamente pra essa combinação: XAUUSD, timeframe M1 . Não é uma
Neo Wave PRO
Nikolay Raykov
5 (1)
Price & Time Market Structure Indicator A professional market structure tool that analyzes waves through both price and time — not price alone. Main Description NeoWave PRO is a professional market structure indicator for MetaTrader 4 designed for traders who want to move beyond traditional one-dimensional wave tools such as ZigZag, swing indicators, and basic high/low systems. Most wave indicators analyze only one thing: Price. But a real market wave is not only a price movement. A true wave de
Trend Catcher ind
Ramil Minniakhmetov
5 (11)
INDICADOR TREND CATCHER O Indicador Trend Catcher analisa os movimentos de preços do mercado, utilizando uma combinação de indicadores de análise de tendências adaptativos, proprietários e personalizados pelo autor. Identifica a verdadeira direção do mercado, filtrando o ruído de curto prazo e focando a força do momentum subjacente, a expansão da volatilidade e o comportamento da estrutura de preços. Utiliza também uma combinação de indicadores personalizados de suavização e filtragem de tendê
Arrow Micro Scalper é um indicador desenvolvido para scalping e trading de curto prazo, integrado com qualquer gráfico e instrumento financeiro (moedas, criptografia, ações, metais). No seu trabalho ela utiliza a análise de ondas e um filtro de direção de tendência. Recomendado para utilização em intervalos de tempo de M1 a H4. Como trabalhar com o indicador. O indicador contém 2 parâmetros externos para alteração de configurações, os restantes já estão configurados por defeito. As setas grand
All in One Trade
Alexey Minkov
4.52 (29)
All-in-One Trade Indicator (AOTI) automatically calculates daily target levels for 14 currency pairs and brings together technical analysis tools for any trading instrument in a single window: Double Channel for trend detection, Price Channel, MA Bands, Climax Bars detector, Fibonacci levels, support/resistance micro-levels, and arrow reversal signals. Works on the MetaTrader 4 platform. Daily levels are calculated for EURUSD, EURJPY, GBPUSD, USDCHF, EURGBP, EURCAD, EURAUD, AUDJPY, GBPAUD, GBPCA
Super Signal – Skyblade Edition Sistema profissional de sinais de tendência sem repintar / sem atraso com taxa de acerto excepcional | Para MT4 / MT5 Funciona melhor em timeframes mais curtos, como 1 minuto, 5 minutos e 15 minutos. Principais características: Super Signal – Skyblade Edition é um sistema inteligente de sinais desenvolvido especificamente para operações com tendência. Utiliza uma lógica de filtragem em múltiplas camadas para detectar apenas movimentos direcionais fortes sustenta
Mais do autor
This indicator presents an alternative approach to identify Market Structure. The logic used is derived from learning material created by   DaveTeaches (on X) Upgrade v1.10: add option to put protected high/low value to buffer (figure 11, 12) When quantifying Market Structure, it is common to use fractal highs and lows to identify "significant" swing pivots. When price closes through these pivots, we may identify a Market Structure Shift (MSS) for reversals or a Break of Structure (BOS) for co
This is a Forex Scalping Trading Sytem based on the Bollinger Bands.  Pairs:Major Time frame: 1M or higher. Spread max:0,0001.  Indicators (just suggestion) Bollinger bands (20, 2); ADX (14 period); RSI   (7 period ). Y ou should only trade this system between 2am to 5am EST, 8am to 12am EST and 7.30pm to 10pm EST. Do not scalp 30 minutes before a orange or red news  report and not for a hour afterwards.   Setup: is for price to move above the lower or lower Bollinger Bands, RSI raise above the
FREE
The Bheurekso Pattern Indicator for MT5 helps traders automatically identify candlestick pattern that formed on the chart base on some japanese candle pattern and other indicator to improve accurate. This indicator scans all candles, recognizes and then displays any candle patterns formed on the chart. The candle displayed can be Bullish or Bearish Engulfing, Bullish or Bearish Harami, and so on. There are some free version now but almost that is repaint and lack off alert function. With this ve
This script automatically calculates and updates ICT's daily IPDA look back time intervals and their respective discount / equilibrium / premium, so you don't have to :) IPDA stands for Interbank Price Delivery Algorithm. Said algorithm appears to be referencing the past 20, 40, and 60 days intervals as points of reference to define ranges and related PD arrays. Intraday traders can find most value in the 20 Day Look Back box, by observing imbalances and points of interest. Longer term traders c
This is addition of  Effective SV squeeze momentum  that add bolliger band and Keltner channel to chart window.  Squeeze momentum introduced by “John Carter”, the squeeze indicator for MT5 represents a volatility-based tool. Regardless, we can also consider the squeeze indicator as a momentum indicator, as many traders use it to identify the direction and strength of price moves. In fact, the Tradingview  squeeze indicator shows when a financial instrument is willing to change from a trending ma
FREE
The liquidity swings indicator highlights swing areas with existent trading activity. The number of times price revisited a swing area is highlighted by a zone delimiting the swing areas. Additionally, the accumulated volume within swing areas is highlighted by labels on the chart. An option to filter out swing areas with volume/counts not reaching a user-set threshold is also included. This indicator by its very nature is not real-time and is meant for descriptive analysis alongside other com
The Breaker Blocks with Signals indicator aims to highlight a complete methodology based on breaker blocks. Breakout signals between the price and breaker blocks are highlighted and premium/discount swing levels are included to provide potential take profit/stop loss levels. This script also includes alerts for each signal highlighted.   SETTINGS   Breaker Blocks Length: Sensitivity of the detected swings used to construct breaker blocks. Higher values will return longer term break
OVERVIEW K-means is a clustering algorithm commonly used in machine learning to group data points into distinct clusters based on their similarities. While K-means is not typically used directly for identifying support and resistance levels in financial markets, it can serve as a tool in a broader analysis approach. Support and resistance levels are price levels in financial markets where the price tends to react or reverse. Support is a level where the price tends to stop falling and m
All about Smart Money Concepts Strategy: Market struture: internal or swing BOS, CHoCH; Orderblock; Liquity equal; Fair Value Gap with Consequent encroachment, Balanced price range; Level with Previous month, week, day level or in day level (PMH, PWH, PDH, HOD); BuySell Stops Liquidity (BSL, SSL); Liquidity Void Long Wicks; Premium and Discount; Candle pattern ... "Smart Money Concepts" ( SMC ) is a fairly new yet widely used term amongst price action traders looking to more accurately navigate
The indicator   returning pivot point based trendlines with highlighted breakouts . Trendline caculated by pivot point and other clue are ATR, Stdev.   The indicator also includes integrated alerts for  trendlines  breakouts   and foward message to Telegram channel or group if you want. Settings ·            Lookback bar: Default 200 is number of bar caculate when init indicator. ·            Length:  Pivot points  period ·            Slope Calculation Method: Determines how this lope is calcula
This all-in-one indicator displays real-time market structure (internal & swing BOS / CHoCH), order blocks, premium & discount zones, equal highs & lows, and much more...allowing traders to automatically mark up their charts with widely used price action methodologies. Following the release of our Fair Value Gap script, we received numerous requests from our community to release more features in the same category. //------------------------------------// Version 1.x has missing functions + PDAr
The Breaker Blocks with Signals indicator aims to highlight a complete methodology based on breaker blocks. Breakout signals between the price and breaker blocks are highlighted and premium/discount swing levels are included to provide potential take profit/stop loss levels. This script also includes alerts for each signal highlighted.   SETTINGS   Breaker Blocks Length: Sensitivity of the detected swings used to construct breaker blocks. Higher values will return longer term break
The ICT Concepts indicator regroups core concepts highlighted by trader and educator "The Inner Circle Trader" (ICT) into an all-in-one toolkit. Features include Market Structure (MSS & BOS), Order Blocks, Imbalances, Buyside/Sellside Liquidity, Displacements, ICT Killzones, and New Week/Day Opening Gaps. It’s one kind of Smart money concepts.   USAGE:   Please read this   document  !      DETAILS Market Structure Market structure labels are constructed from price breaking a prior extreme
The FollowLine indicator is a trend following indicator. The blue/red lines are activated when the price closes above the upper Bollinger band or below the lower one. Once the trigger of the trend direction is made, the FollowLine will be placed at High or Low (depending of the trend). An ATR filter can be selected to place the line at a more distance level than the normal mode settled at candles Highs/Lows. Some features: + Trend detech + Reversal signal + Alert teminar / mobile app
The ICT Silver Bullet indicator is inspired from the lectures of "The Inner Circle Trader" (ICT) and highlights the Silver Bullet (SB) window which is a specific 1-hour interval where a Fair Value Gap (FVG) pattern can be formed. A detail document about ICT Silver Bullet here . There are 3 different Silver Bullet windows (New York local time): The London Open Silver Bullet (3 AM — 4 AM ~ 03:00 — 04:00) The AM Session Silver Bullet (10 AM — 11 AM ~ 10:00 — 11:00) The PM Session Silver Bullet (2
This indicator shows when user set sessions are active and returns various tools + metrics using the closing price within active sessions as an input. Users have the option to change up to 4 session times. The indicator will increasingly lack accuracy when the chart timeframe is higher than 1 hour. Settings Sessions Enable Session: Allows to enable or disable all associated elements with a specific user set session. Session Time: Opening and closing times of the user set session in the  
The liquidity swings indicator highlights swing areas with existent trading activity. The number of times price revisited a swing area is highlighted by a zone delimiting the swing areas. Additionally, the accumulated volume within swing areas is highlighted by labels on the chart. An option to filter out swing areas with volume/counts not reaching a user-set threshold is also included. This indicator by its very nature is not real-time and is meant for descriptive analysis alongside other com
The SuperTrend AI indicator is a novel take on bridging the gap between the K-means clustering machine learning method & technical indicators. In this case, we apply K-Means clustering to the famous SuperTrend indicator.   USAGE Users can interpret the SuperTrend AI trailing stop similarly to the regular SuperTrend indicator. Using higher minimum/maximum factors will return longer-term signals. (image 1) The displayed performance metrics displayed on each signal allow for a deeper interpretat
OVERVIEW A Lorentzian Distance Classifier (LDC) is a Machine Learning classification algorithm capable of categorizing historical data from a multi-dimensional feature space. This indicator demonstrates how Lorentzian Classification can also be used to predict the direction of future price movements when used as the distance metric for a novel implementation of an Approximate Nearest Neighbors (ANN) algorithm. This indicator provide signal as buffer, so very easy for create EA from this indi
An Implied Fair Value Gap (IFVG) is a three candles imbalance formation conceptualized by ICT that is based on detecting a larger candle body & then measuring the average between the two adjacent candle shadows. This indicator automatically detects this imbalance formation on your charts and can be extended by a user set number of bars. The IFVG average can also be extended until a new respective IFVG is detected, serving as a support/resistance line. Alerts for the detection of bullish/be
Consolidation is when price is moving inside a clear trading range. When prices are consolidated it shows the market maker placing orders on both sides of the market. This is mainly due to manipulate the un informed money. This indicator automatically identifies consolidation zones and plots them on the chart. The method of determining consolidation zones is based on pivot points and ATR, ensuring precise identification. The indicator also sends alert notifications to users when a new consolida
Wyckoff sweep and order block detector I got tired of marking the same structure by hand every morning, so I wrote this. It looks for one thing only: the Wyckoff sequence that ends with a liquidity sweep and a pullback into the order block that started the move. When all the pieces line up, it draws them and tells you. That's the whole job. It doesn't predict, it doesn't score setups out of ten, and it won't tell you how much to risk. It marks structure that's already there and saves you the ey
Created by imjesstwoone and mickey1984, this trade model attempts to capture the expansion from the 10:00-14:00 EST 4h candle using just 3 simple steps. All of the information presented in this description has been outlined by its creators, all I did was translate it to MQL4. All core settings of the trade model may be edited so that users can test several variations, however this description will cover its default, intended behavior using NQ 5m as an example. Step 1 is to identify our Price Ra
The Buyside & Sellside Liquidity indicator aims to detect & highlight the first and arguably most important concept within the ICT trading methodology,   Liquidity   levels. SETTINGS Liquidity Levels Detection Length: Lookback period Margin: Sets margin/sensitivity for a liquidity level detection Liquidity Zones Buyside Liquidity Zones: Enables display of the buyside liquidity zones. Margin: Sets margin/sensitivity for the liquidity zone boundaries. Color: Color option for buysid
The   Liquidation Estimates (Real-Time)   experimental indicator attempts to highlight real-time long and short liquidations on all timeframes. Here with liquidations, we refer to the process of forcibly closing a trader's position in the market. By analyzing liquidation data, traders can gauge market sentiment, identify potential support and resistance levels, identify potential trend reversals, and make informed decisions about entry and exit points. USAGE (Img 1)    Liquidation refers
The   ICT Unicorn Model   indicator highlights the presence of "unicorn" patterns on the user's chart which is derived from the lectures of   "The Inner Circle Trader" (ICT) . Detected patterns are followed by targets with a distance controlled by the user.   USAGE (image 2) At its core, the ICT Unicorn Model relies on two popular concepts, Fair Value Gaps and Breaker Blocks. This combination highlights a future area of support/resistance. A   Bullish Unicorn Pattern   consists out of:
The Inversion Fair Value Gaps (IFVG) indicator is based on the inversion FVG concept by ICT and provides support and resistance zones based on mitigated Fair Value Gaps (FVGs). Image 1   USAGE Once mitigation of an FVG occurs, we detect the zone as an "Inverted FVG". This would now be looked upon for potential support or resistance. Mitigation occurs when the price closes above or below the FVG area in the opposite direction of its bias. (Image 2) Inverted Bullish FVGs Turn into Potenti
Overview The   Volume SuperTrend AI   is an advanced technical indicator used to predict trends in price movements by utilizing a combination of traditional SuperTrend calculation and AI techniques, particularly the k-nearest neighbors (KNN) algorithm. The Volume SuperTrend AI is designed to provide traders with insights into potential market trends, using both volume-weighted moving averages (VWMA) and the k-nearest neighbors (KNN) algorithm. By combining these approaches, the indicator
Introducing the Reversal and Breakout Signals   This innovative tool is crafted to enhance your chart analysis by identifying potential reversal and breakout opportunities directly on your charts. It's designed with both novice and experienced traders in mind, providing intuitive visual cues for better decision-making. Let's dive into the key features and how it operates: ###   Key Features:   Dynamic Period Settings:   Customize the sensitivity of the indicator with user-def
Introduction One of the patterns in "RTM" is the "QM" pattern, also known as "Quasimodo". Its name is derived from the appearance of "Hunchback of Notre-Dame" from Victor Hugo's novel. It is a type of "Head and Shoulders" pattern.   Formation Method   Upward Trend In an upward trend, the left shoulder is formed, and the price creates a new peak higher than the left shoulder peak . After a decline, it manages to break the previous low and move upward again. We expect the price to
Filtro:
Sem comentários
Responder ao comentário