MTFOpenLineEn
- Indicadores
-
Atsushi Katayama
 I develop and test MetaTrader 5 Expert Advisors with a focus on backtesting, forward testing, and risk management.
My products do not rely on martingale, grid, or averaging strategies. - Versão: 1.10
Overview
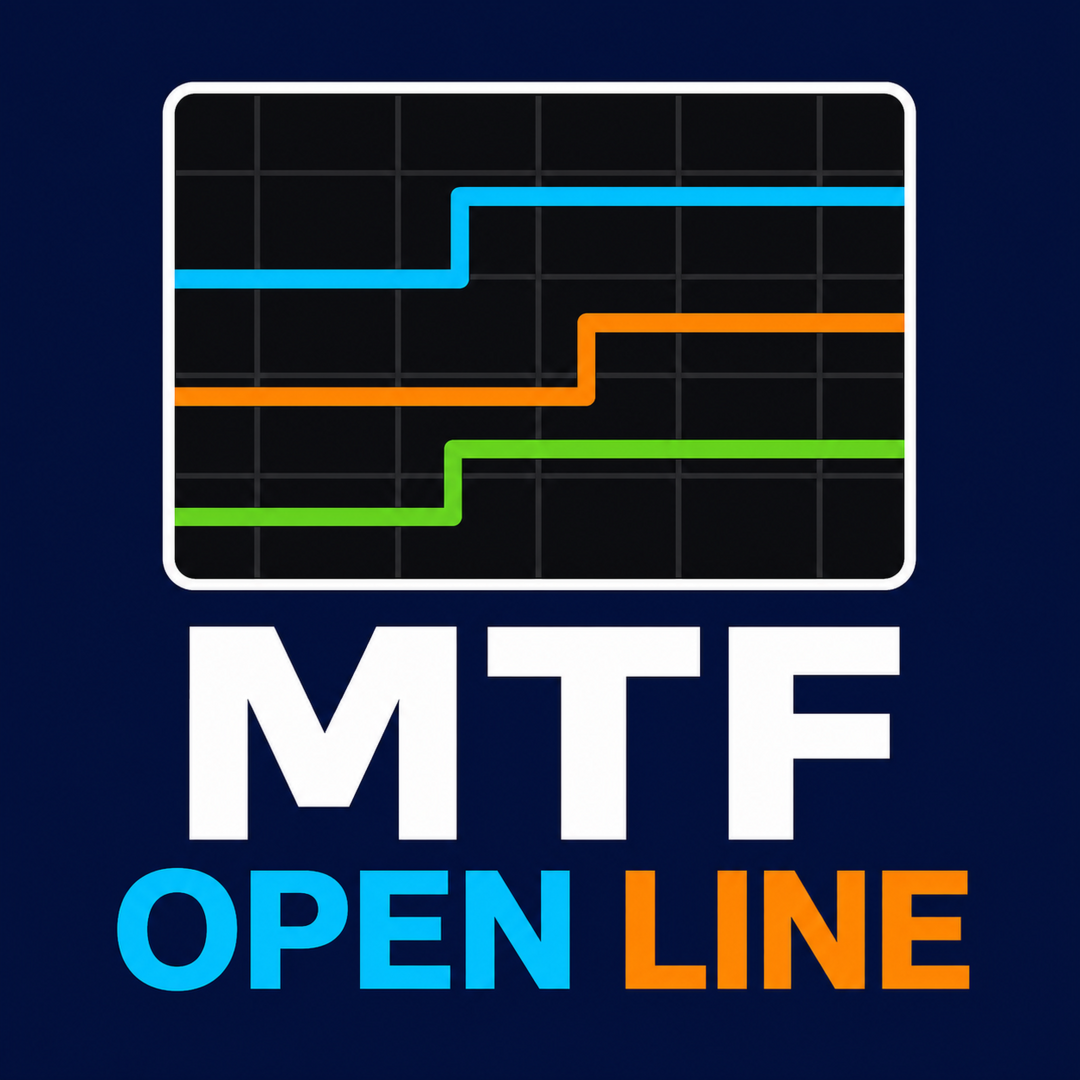
Multi Timeframe Open Lines is a lightweight MetaTrader 5 indicator that displays open-price levels from selected timeframes directly on the current chart.
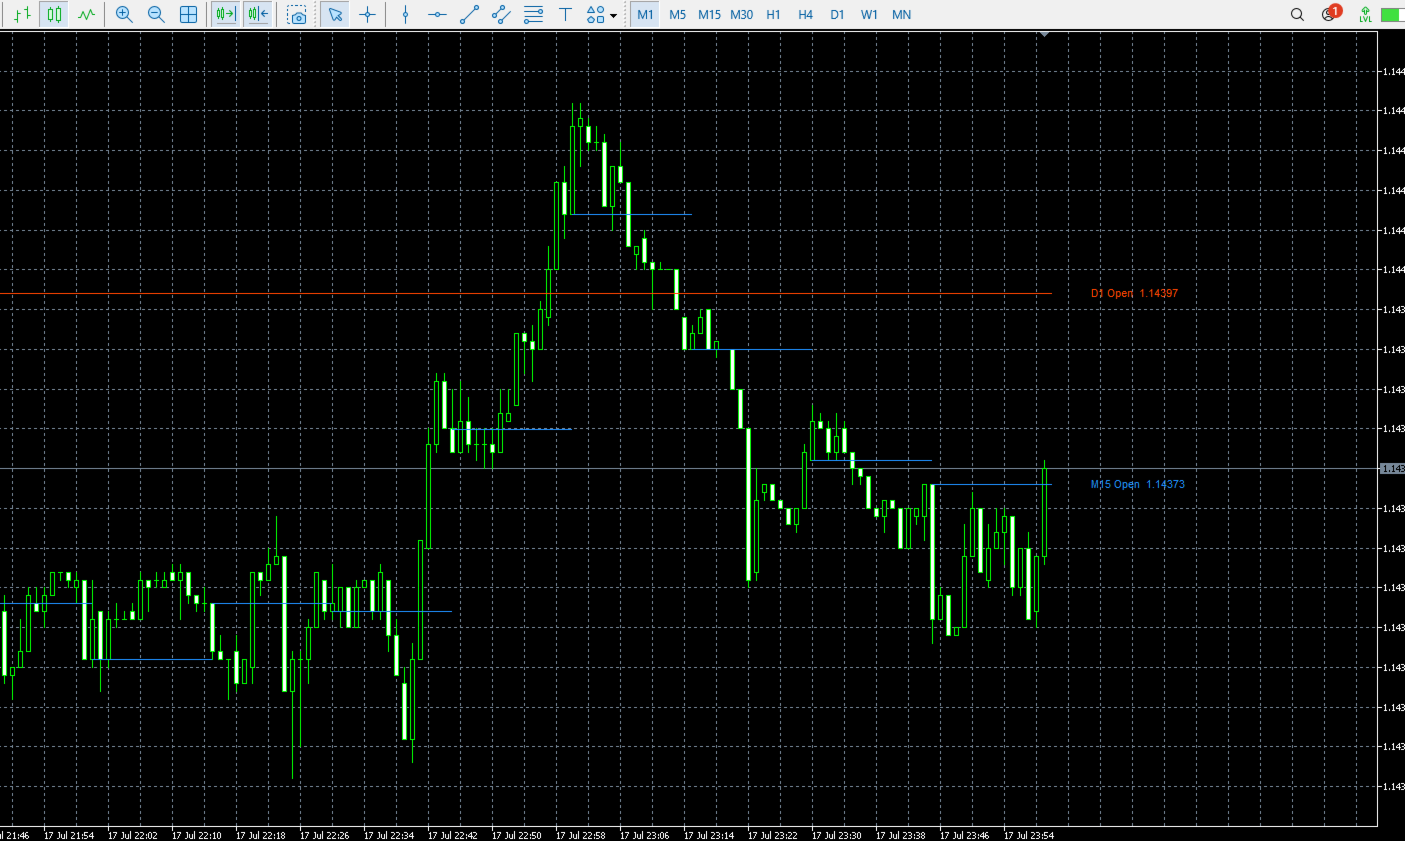
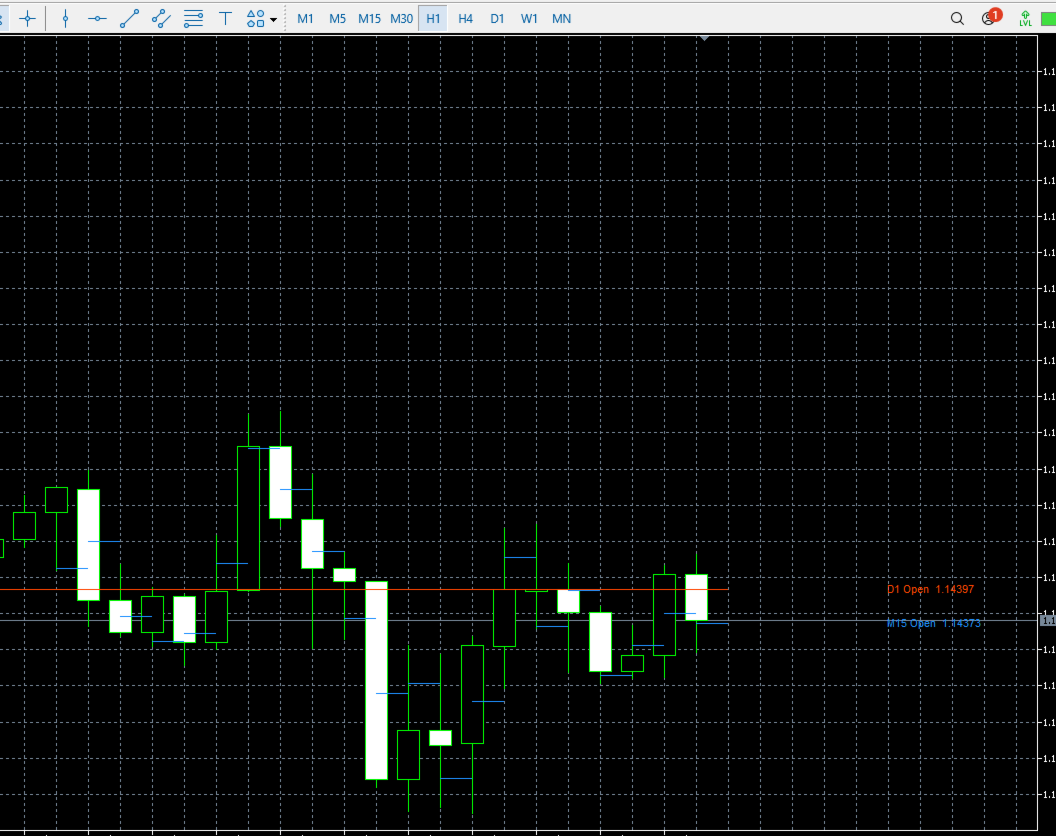
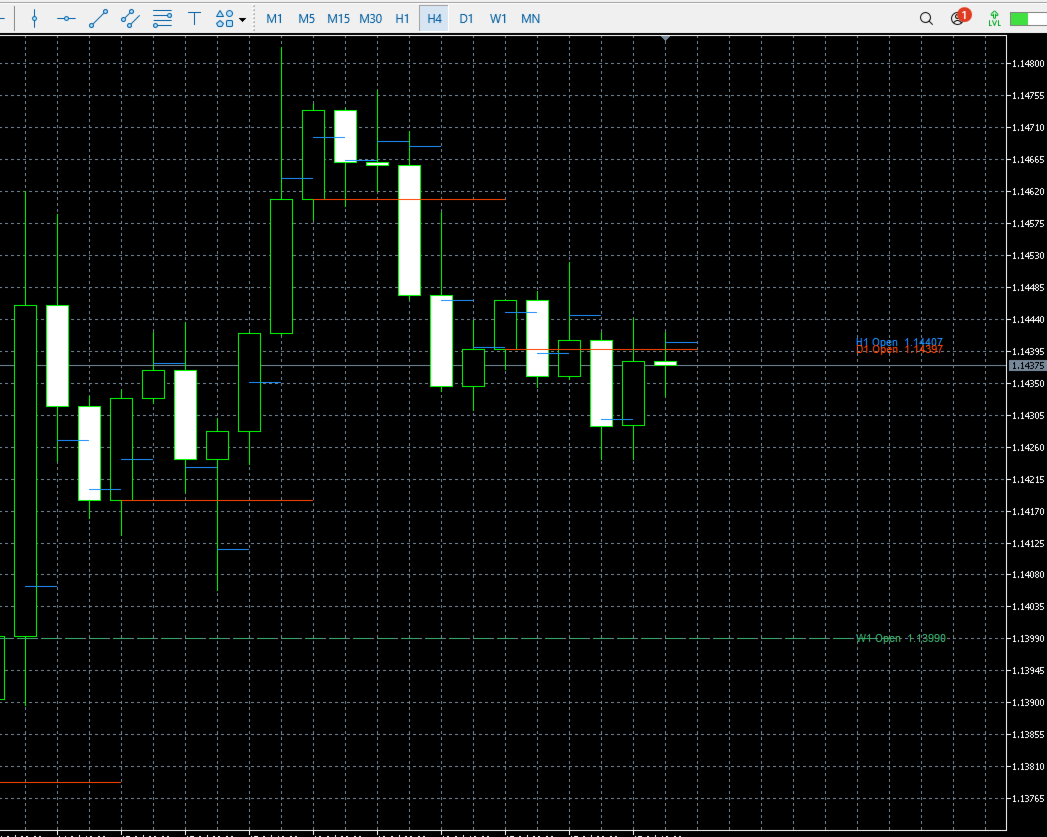
You can display open prices from higher, lower, or identical timeframes. For example, you can display H4 and D1 opens on an H1 chart, or display M15 opens on an H1 chart.
The indicator supports up to three independently configurable timeframes.
It is a chart analysis tool only. It does not generate trading signals, open trades, modify positions, or close trades.
How It Works
Each open-price line is drawn from the beginning of the selected timeframe period to the beginning of the next period.
This makes it easy to see which open price belongs to each period and whether the current market price is above or below that reference level.
The current active period can also be displayed and updated automatically.
Main Features
-
Displays open prices from up to three timeframes
-
Supports higher, lower, and identical timeframes
-
Independent enable or disable setting for each timeframe
-
Individual line color, style, and width settings
-
Adjustable number of historical periods
-
Optional display of the current active period
-
Optional vertical connections between open-price levels
-
Latest open-price labels displayed on the right side of the chart
-
Adjustable label font size
-
Adjustable refresh interval
-
Works with the current chart symbol
Example Uses
-
Display H4 and D1 opens on an H1 chart
-
Display H1, H4, and D1 opens on an M15 chart
-
Display M15 opens on an H1 chart
-
Display H1, D1, and W1 opens on an M5 chart
Input Parameters
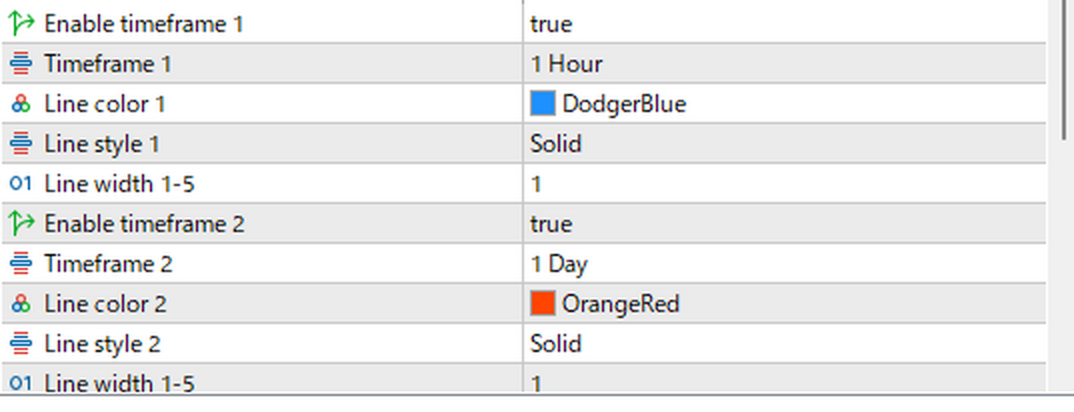
Timeframe 1
-
Enable timeframe 1: Enables or disables the first open-price line
-
Timeframe 1: Selects the timeframe used for the first open price
-
Line color 1: Sets the line and label color
-
Line style 1: Sets the line style
-
Line width 1-5: Sets the line width from 1 to 5
Timeframe 2
-
Enable timeframe 2: Enables or disables the second open-price line
-
Timeframe 2: Selects the timeframe used for the second open price
-
Line color 2: Sets the line and label color
-
Line style 2: Sets the line style
-
Line width 1-5: Sets the line width from 1 to 5
Timeframe 3
-
Enable timeframe 3: Enables or disables the third open-price line
-
Timeframe 3: Selects the timeframe used for the third open price
-
Line color 3: Sets the line and label color
-
Line style 3: Sets the line style
-
Line width 1-5: Sets the line width from 1 to 5
Common Settings
-
Number of historical open periods: Sets the number of previous periods displayed
-
Show current period open: Displays the open price of the currently active period
-
Connect steps with vertical lines: Connects consecutive open levels with vertical lines
-
Show latest open labels: Displays the latest timeframe name and open price on the right side
-
Label font size: Sets the label text size
-
Refresh interval (seconds): Sets the redraw interval
-
Object name prefix: Sets the prefix used for chart objects and normally does not need to be changed
Notes
Open prices and timeframe boundaries are based on the price data and server time provided by your broker. Daily and weekly opening times may therefore differ between brokers.
When a lower timeframe is displayed on a higher-timeframe chart, the line segments are shorter and may overlap depending on the chart scale.
Historical lines may not appear immediately if the required timeframe data has not yet been loaded in MetaTrader 5.
This indicator is designed for visual chart analysis. It does not guarantee any trading result.