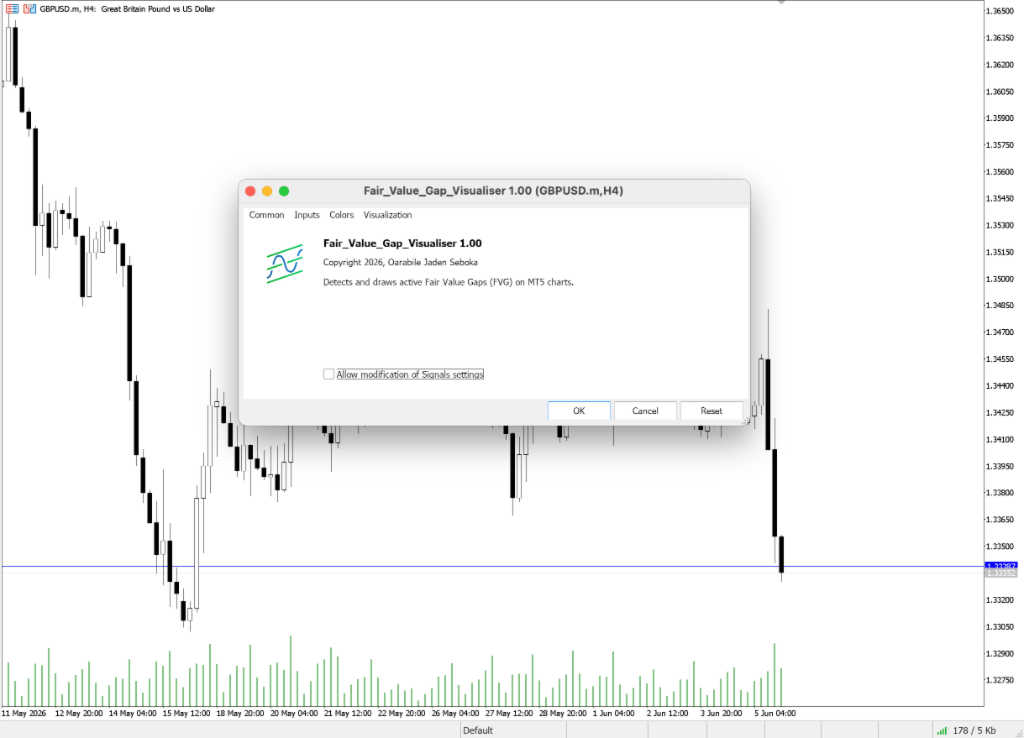
Fair Value Gap Visualiser
- Indicadores
- Versão: 1.0

FVG Indicator - Real-Time Fair Value Gap Detector
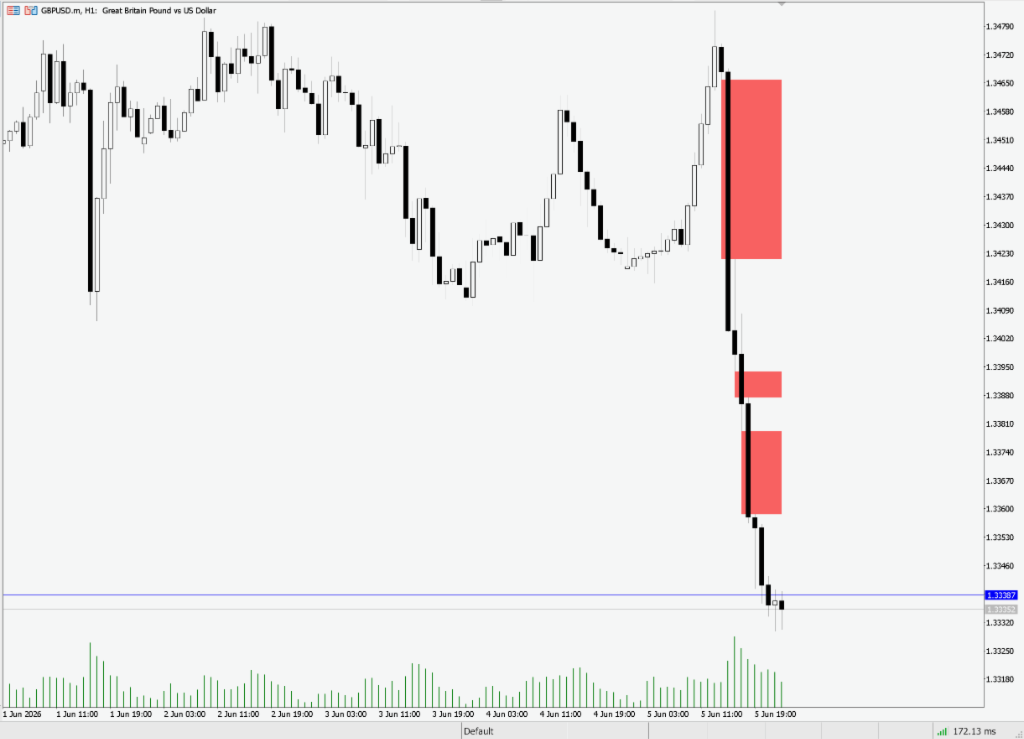
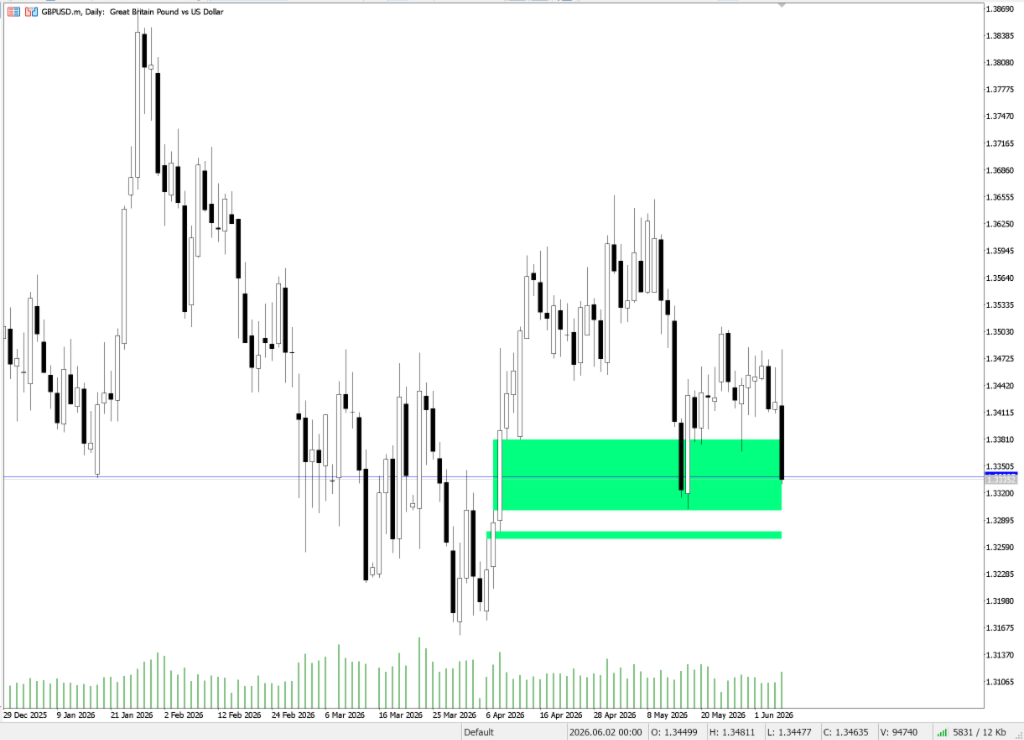
FVG Indicator is a powerful technical analysis tool designed to identify and draw Fair Value Gaps (FVG) automatically on your chart. Fair Value Gaps represent market imbalances where price moves rapidly in one direction, leaving behind a liquidity void. These zones frequently act as magnetic price levels that the market returns to retest and fill before continuing its original move.
This indicator plots clean, customizable rectangles directly on the chart to mark active imbalance levels, automatically cleaning up the chart when those levels are mitigated.
Key Features:
- Real-Time Detection: Automatically scans the three-candle patterns to identify bullish and bearish imbalances instantly.
- Automatic Mitigation Cleanup: When price retraces and tests the boundaries of a gap, the indicator can automatically delete the object, keeping your chart clean and focused only on fresh, untested levels.
- Size Filtering: Filter out minor market noise by setting a minimum gap size in pips.
- Expiration Control: Set a maximum bar limit to stop tracking very old gaps that are no longer relevant to your intraday strategy.
- Complete Customization: Easily adjust colors, borders, and fills to match your template.
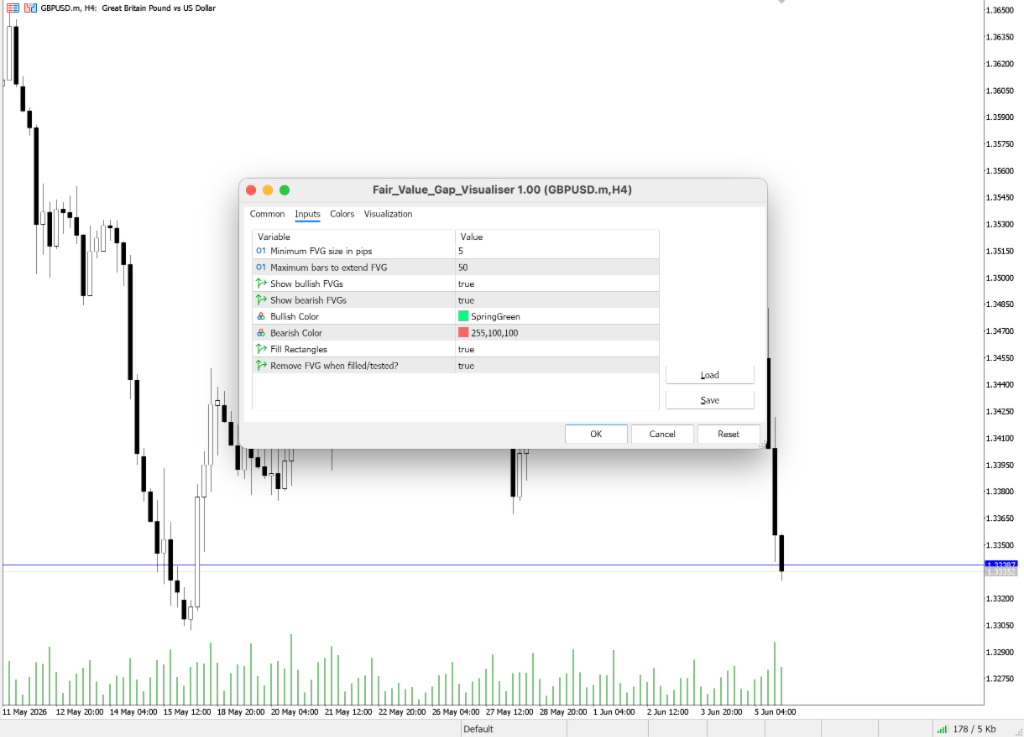
Indicator Inputs and Parameters:
- MinFVGSizePips: The minimum vertical size of the gap (in pips) required for the indicator to draw a zone. Prevents cluttering the chart with minor imbalances.
- MaxFVGBars: The maximum number of bars the rectangle will extend forward before it automatically deactivates.
- ShowBullishFVG: Toggle the display of bullish imbalance zones (gaps between the high of Candle 1 and the low of Candle 3).
- ShowBearishFVG: Toggle the display of bearish imbalance zones (gaps between the low of Candle 1 and the high of Candle 3).
- ColorBullish: Customize the color of bullish imbalance rectangles.
- ColorBearish: Customize the color of bearish imbalance rectangles.
- FillBackground: Choose whether the plotted zones are filled solid or remain hollow outlines.
- RemoveMitigated: If true, the indicator deletes the rectangle as soon as price breaches the gap's level, highlighting only active trading zones.