Gold Smart Trend Predictor
- Indicadores
- Versão: 1.0

Professional XAUUSD H1 trend indicator with non-repainting signals, ATR-based SL/TP levels, forecast visualization, dashboard analytics, and Telegram alerts.
Designed for traders who want fewer but higher-quality gold trend entries instead of noisy scalping signals.
The indicator combines:
- multi-EMA trend structure,
- ADX trend-strength filtering,
- stochastic momentum confirmation,
- higher-timeframe direction alignment,
- volatility-adaptive risk levels.
Signals are generated only on closed candles and never repaint.
Best Use Case
- Symbol: XAUUSD (Gold)
- Timeframe: H1
- Trading style: intraday swing / trend-following
- Market condition: trending markets
The indicator performs best during directional gold movements and intentionally avoids weak sideways conditions.
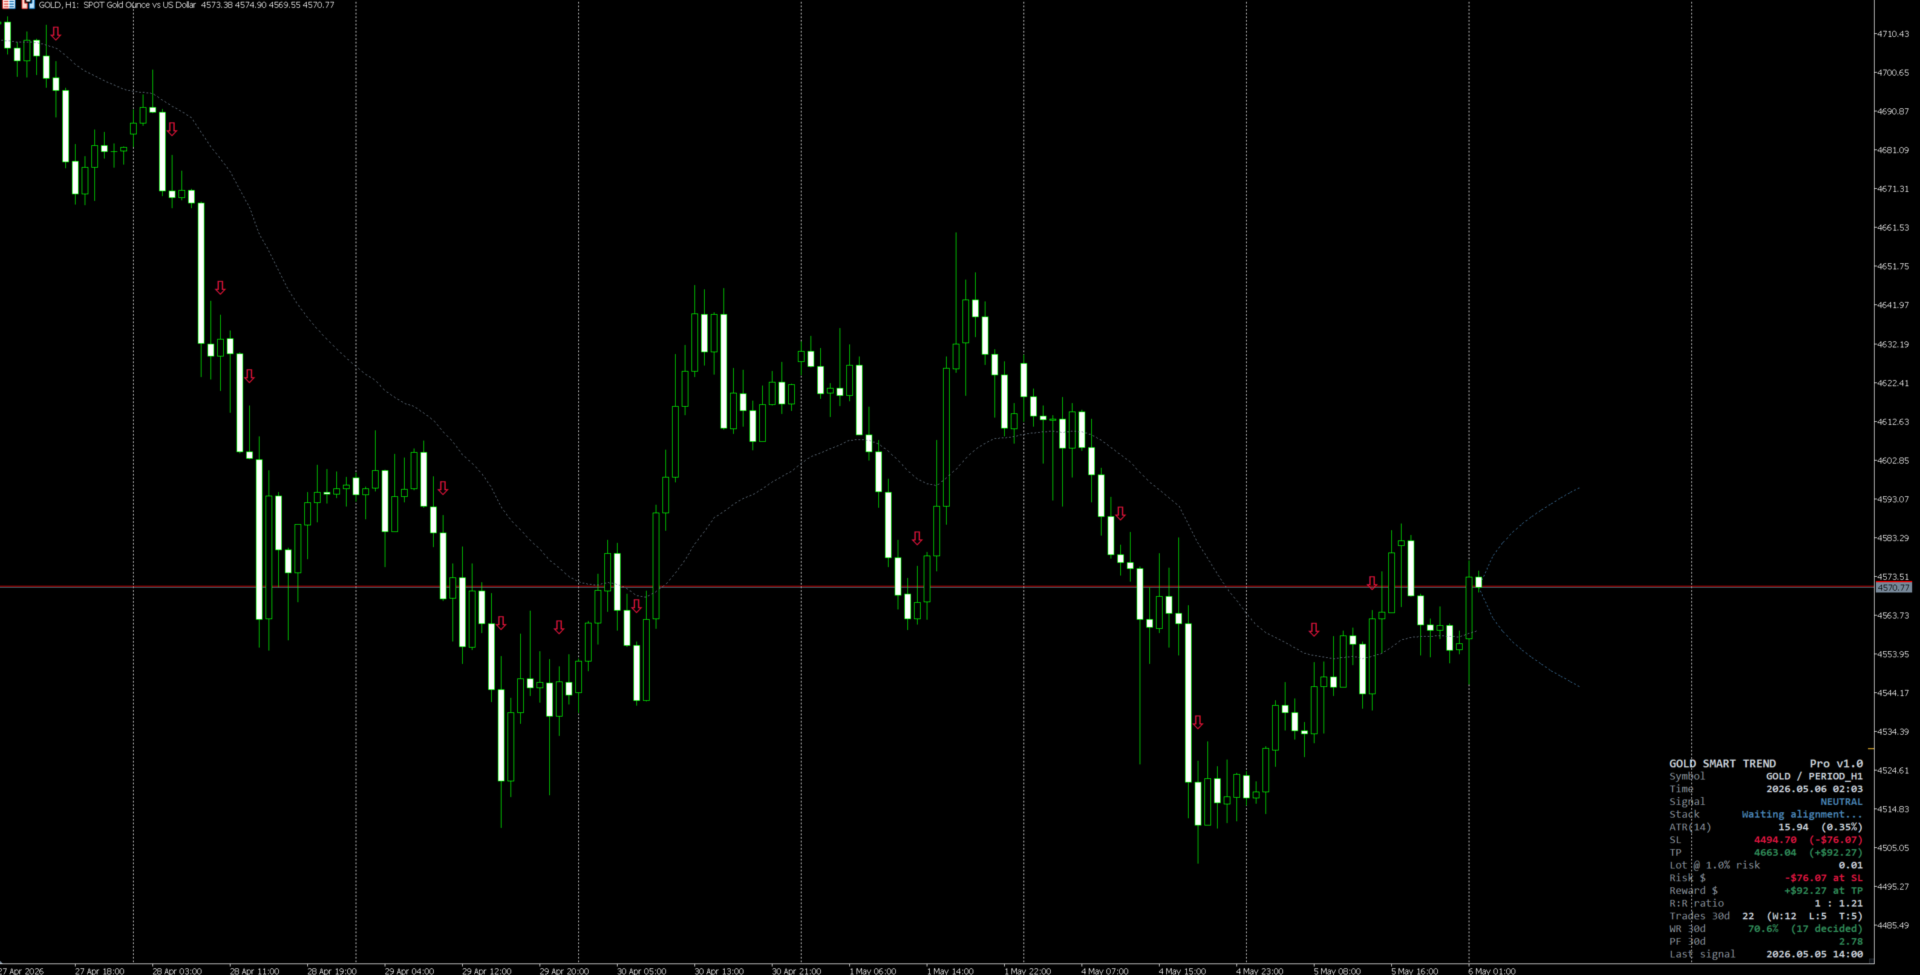
What the Indicator DoesWhen all trend filters align:
- the indicator generates a BUY or SELL signal,
- projects a 10-hour forecast zone,
- calculates ATR-based Stop Loss and Take Profit levels,
- displays suggested lot sizing based on risk percentage,
- optionally sends Telegram alerts.
When conditions are unclear, the indicator stays neutral and shows no signal.
The goal is simple:
Clear trend confirmation instead of constant market noise.
Core FeaturesNon-Repainting Signals
All calculations are performed only on fully closed candles.
Signals never move or disappear after a candle closes.
Multi-Factor Trend Engine
The signal engine combines:
- Fast/slow EMA trend direction
- ADX trend-strength filter
- 7-EMA ribbon alignment
- Stochastic momentum confirmation
- Higher-timeframe EMA alignment
A signal appears only when all components agree.
This significantly reduces false entries during weak market conditions.
Forecast VisualizationWhen a signal appears, the indicator draws:
- projected phantom candles,
- a volatility expansion channel,
- directional bias for the next ~10 hours.
This helps visualize expected movement and market pressure.
ATR-Based Risk ManagementThe indicator automatically displays:
- Entry reference price
- Stop Loss level
- Take Profit level
- Reward-to-risk ratio
- Suggested lot size
Default setup:
- Risk/Reward ≈ 1 : 1.21
The on-chart dashboard shows:
- current market state,
- ATR volatility,
- SL/TP distances,
- lot-size suggestion,
- live signal statistics,
- win-rate estimate,
- profit-factor proxy.
The dashboard uses only the trader’s local chart history.
Alert SystemSupported alert channels:
- MetaTrader popup alerts
- Sound alerts
- Telegram notifications
Telegram alerts require:
- enabling WebRequest,
- whitelisting https://api.telegram.org ,
- entering bot token and chat ID.
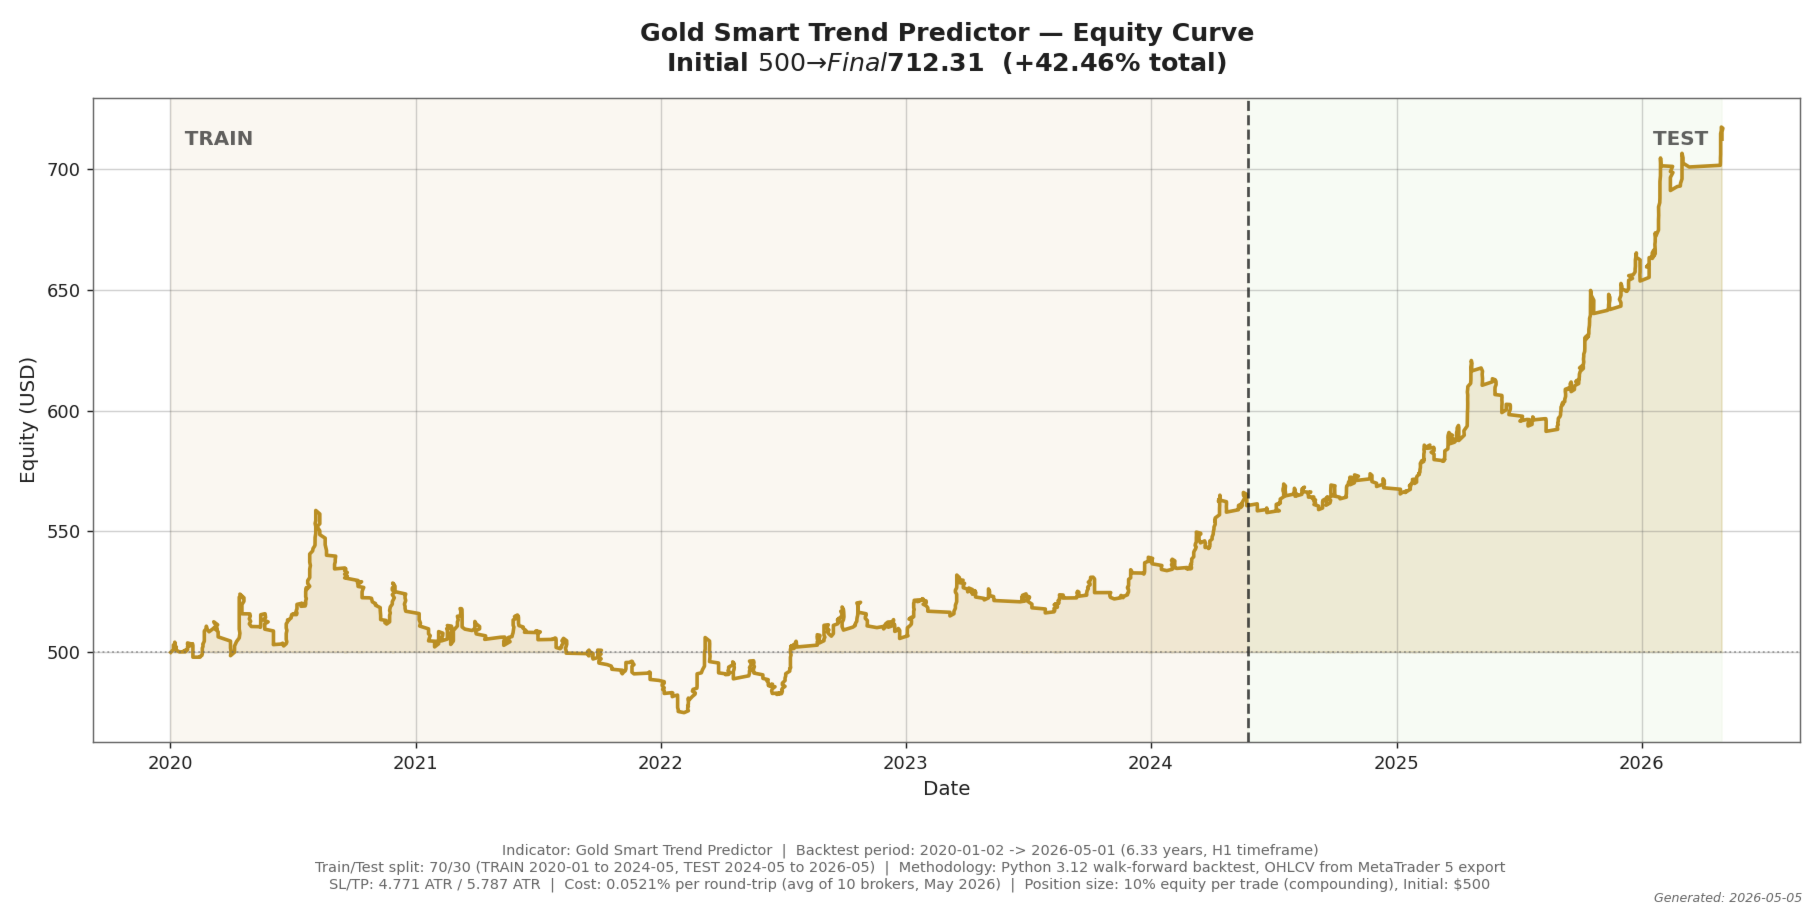
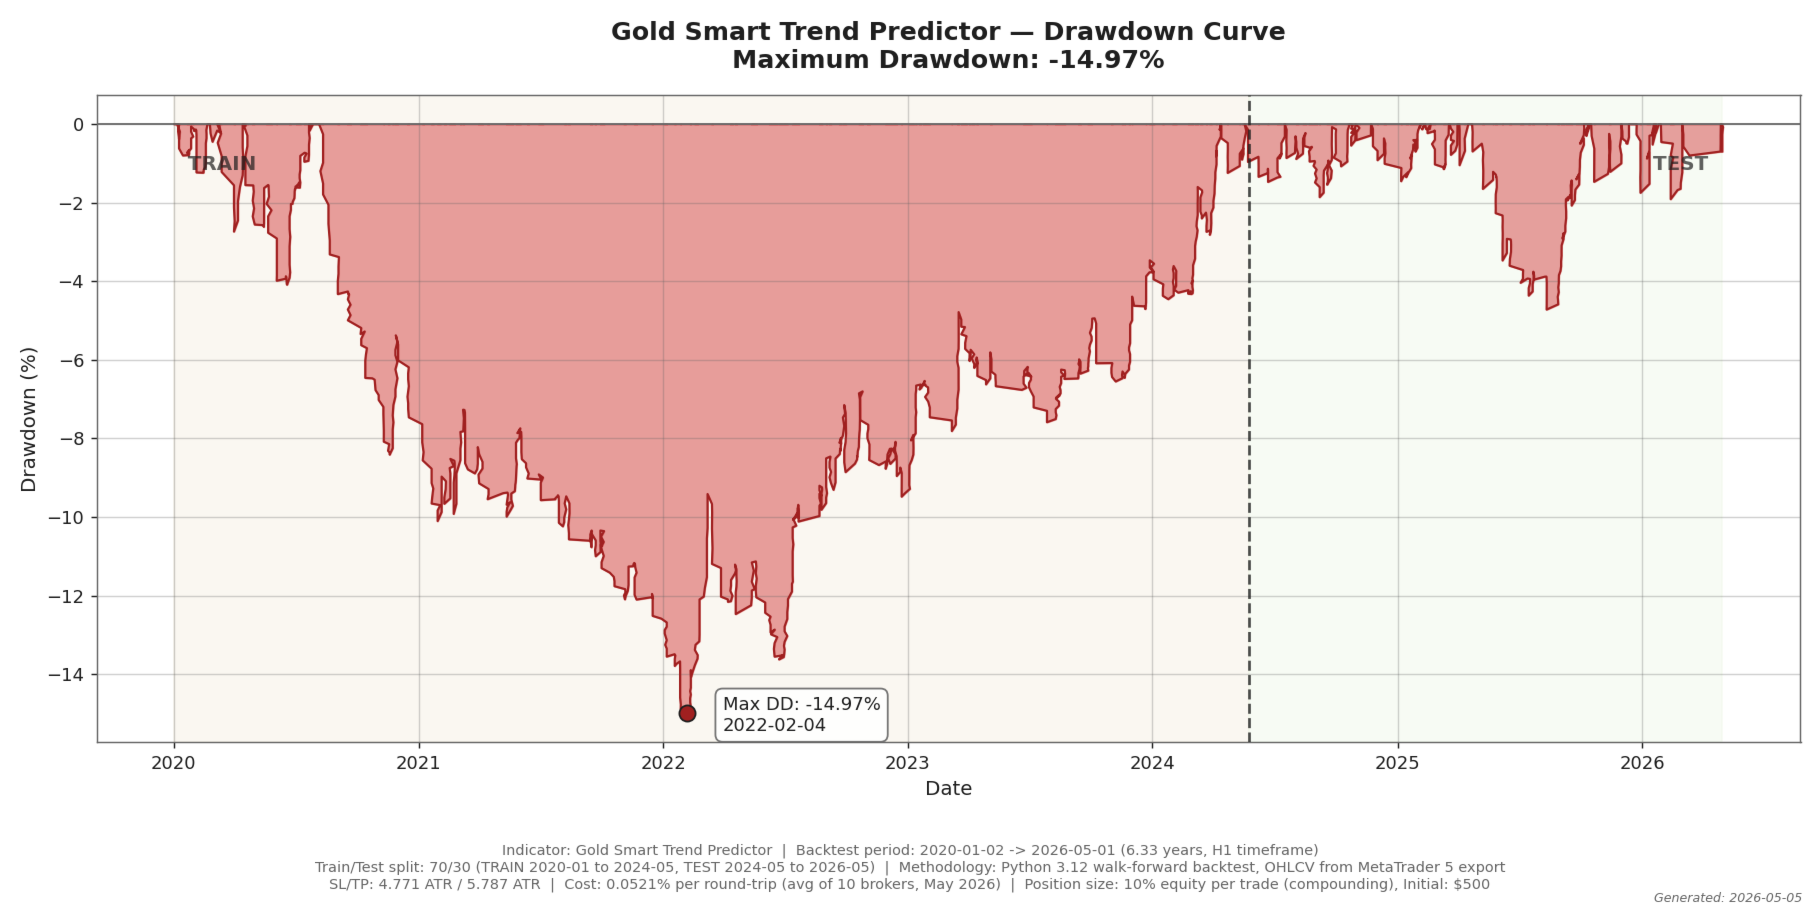
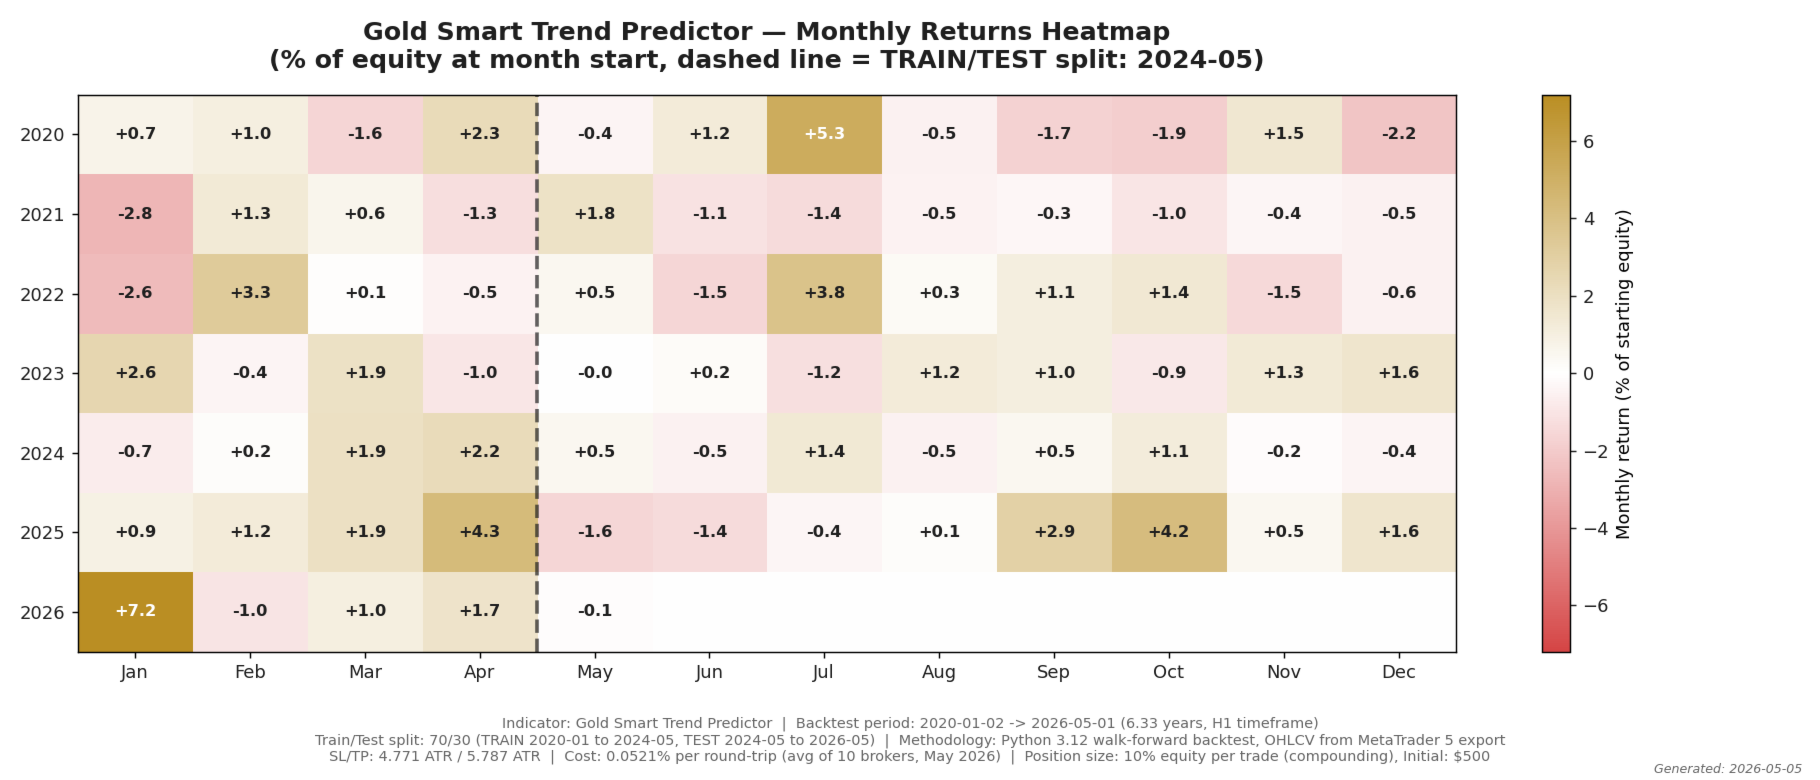
Calibration period:
- January 2020 → April 2026
Out-of-sample test window:
- 2025 → April 2026
Results:
- Win Rate: 65.0%
- Profit Factor: 2.06
- 590 tracked setups
Full historical window:
- Win Rate: 55.6%
- Profit Factor: 1.36
- Max Drawdown: 14.97%
These are historical backtest results and not guarantees of future performance.
Recommended SettingsDefault parameters are already calibrated for XAUUSD H1.
Changing engine settings may invalidate the reference backtest statistics.
Requirements- Symbol: XAUUSD
- Timeframe: H1
- Minimum history: 1500 bars
- This indicator does NOT place trades automatically.
- It is an analytical decision-support tool.
- Best results are typically achieved when combined with discretionary market structure analysis.
Trading involves substantial risk.
This indicator is provided for educational and informational purposes only and does not constitute financial advice or a guarantee of future results.

O usuário não deixou nenhum comentário para sua avaliação