DiNapoli MACDP pro
- Indicadores
-
Vito Bijac
 Professional trader and indicator developer with a focus on DiNapoli methodology and leading price action tools. I build indicators that get ahead of the market — not ones that explain what already happened.
 - Versão: 1.0
- Ativações: 5
DiNapoli MACDP
The Edge Before The Cross
IN SHORT: The DiNapoli MACDP calculates the exact price at which a MACD crossover will occur on the next candle — before it happens. One clean line on your chart. No guesswork. Pure mathematics.
You have been here before.
You watch the MACD. You wait for the cross. By the time it confirms, the candle is already closed — sometimes two or three candles deep into the move. You either chase it and get caught at the worst possible entry, or you stay out and watch it run without you. Either way you lose. Not because your analysis was wrong. Because your tool was too slow.
This is not a personal failing. It is a mathematical limitation built into every standard MACD on every platform in the world. The indicator is lagging by design. It was never built to give you early entries. It was built to confirm what already happened.
Joe DiNapoli — internationally recognized trader, author of the landmark book Trading With DiNapoli Levels, and a methodology taught in over 60 countries — solved this problem decades ago. He developed a mathematical formula that uses the precise relationship between the Fast EMA, Slow EMA, and Signal line to calculate exactly where price needs to be for a crossover to occur on the very next candle. Not approximately. Not directionally. Exactly.
That formula is this indicator.
The result is a single dashed line plotted directly on your price chart. It updates silently on every candle close. When price is approaching that line, a MACD crossover is about to happen. You are no longer reacting. You are anticipating. You can position yourself before the signal fires, set a tighter stop, and let the crossover work in your favor instead of against your entry.
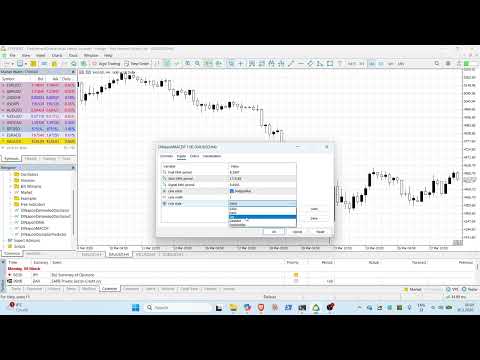
What your chart looks like with this indicator:
One clean dashed line on your main price chart. No subwindow. No complexity. No noise. Just the level that matters — the price where everything changes on the next close. It sits quietly on your chart and updates automatically. You will wonder how you traded MACD without it.
What makes it different:
Every other MACD tool on the market shows you what already happened. This one shows you what is about to happen — derived not from prediction or pattern recognition but from the hard mathematics of exponential moving average convergence. It uses DiNapoli's exact parameters: Fast EMA 8, Slow EMA 17, Signal EMA 9 — the settings he refined through decades of professional trading and published for the world to verify.
This is not a black box. The formula is based entirely on published DiNapoli methodology. Every value this indicator produces can be verified by hand using the documented calculation. There are no hidden algorithms, no curve-fitted secrets. Just DiNapoli's mathematics, implemented precisely.
Who this is for: You already use MACD in your trading. You are not a beginner looking for a magic signal — you understand momentum and you use MACD as part of a real process. You are frustrated with late entries and you want to get ahead of the cross instead of chasing it. This tool was built specifically for you.
Key features:
- Plots directly on main price chart as a single clean dashed line
- Updates on every candle close with absolute zero repainting
- Uses authentic DiNapoli EMA parameters (8, 17, 9)
- Fully customizable color, width, and line style
- Works on every instrument and every timeframe
- Lightweight with zero impact on platform performance
- Simple to understand — if you know MACD you will master this instantly
Stop reacting to crossovers that already happened. Start positioning before they do.