Quantum Trend Scanner
- Indicadores
-
Niccyril Chirindo
 Technology Executive | Critical Infrastructure Security Systems Specialist | Software Developer | Cisco Network Engineer | MQL5 Developer
 - Versão: 3.0
- Atualizado: 10 março 2026
- Ativações: 15
QUANTUM TREND SCANNER
Professional Multi-Timeframe Trend Analysis Dashboard
Quantum Trend Scanner is an advanced technical indicator designed to analyze market trends across multiple timeframes and currency pairs simultaneously. The indicator provides traders with comprehensive market insights through three integrated analytical panels.
Quantum Trend Scanner Guide is Here
What It Does
The indicator monitors 30 currency pairs across 9 timeframes (M1, M5, M15, M30, H1, H4, D1, W1, MN1) and presents the data through three dashboard panels. It uses a combination of exponential moving averages, momentum analysis, and market structure evaluation to identify trend direction and strength.
Key Features
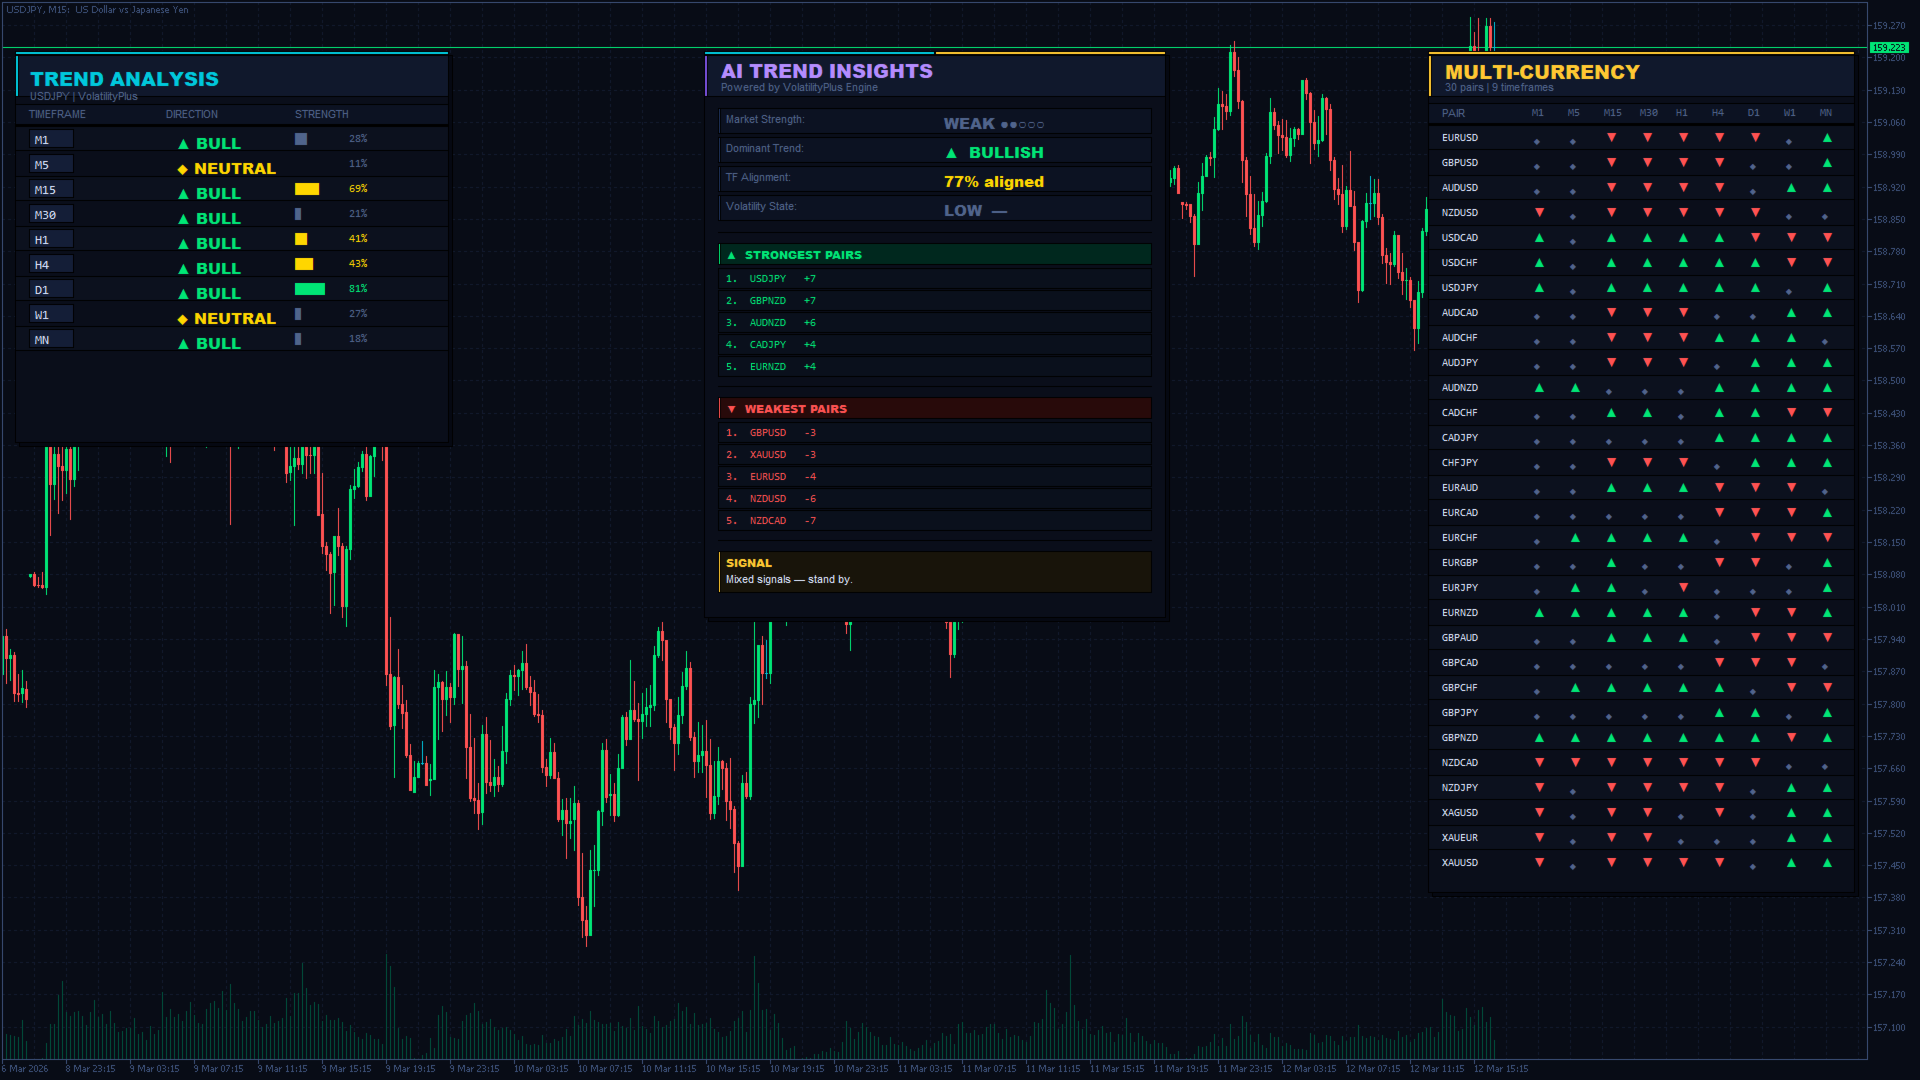
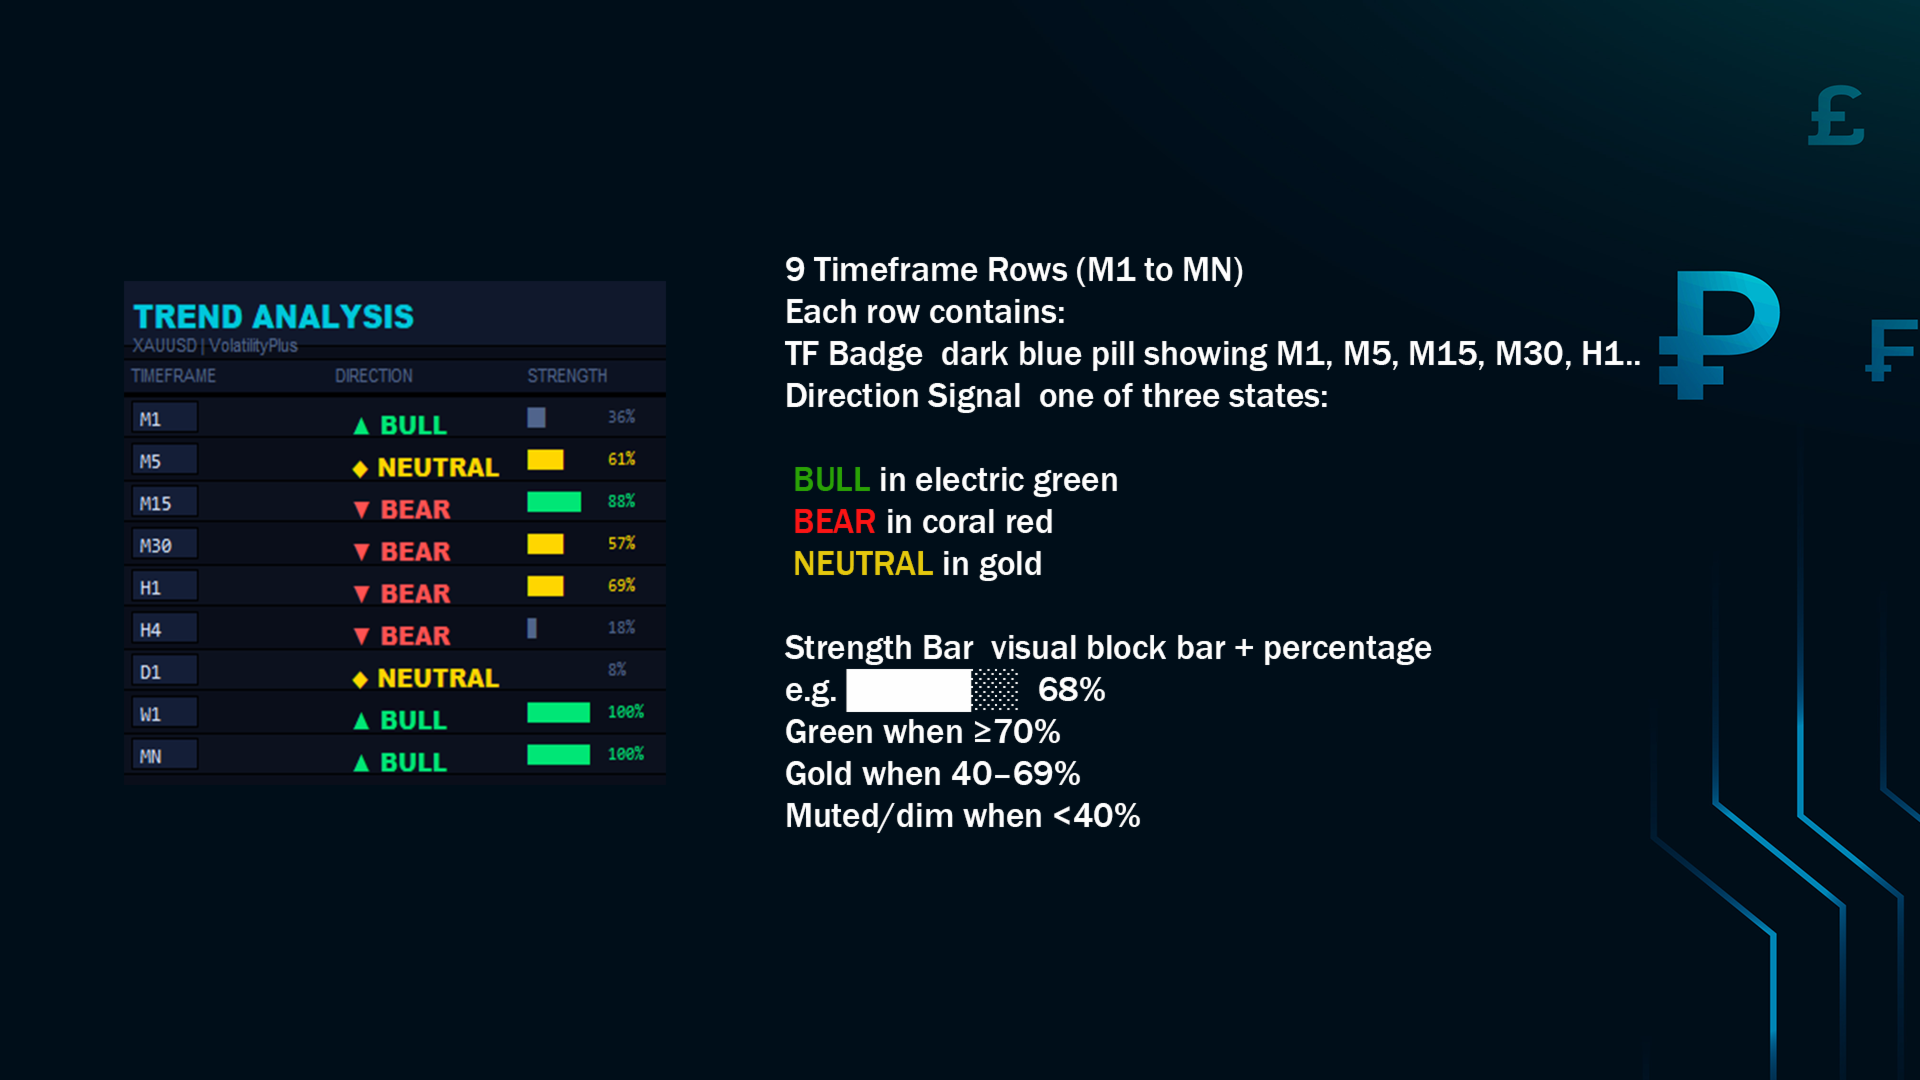
Trend Analysis Panel: Displays the current symbol across all timeframes with trend direction and strength indicators. Each timeframe shows BUY, SELL, or neutral signals with an intensity rating from 0 to 100.
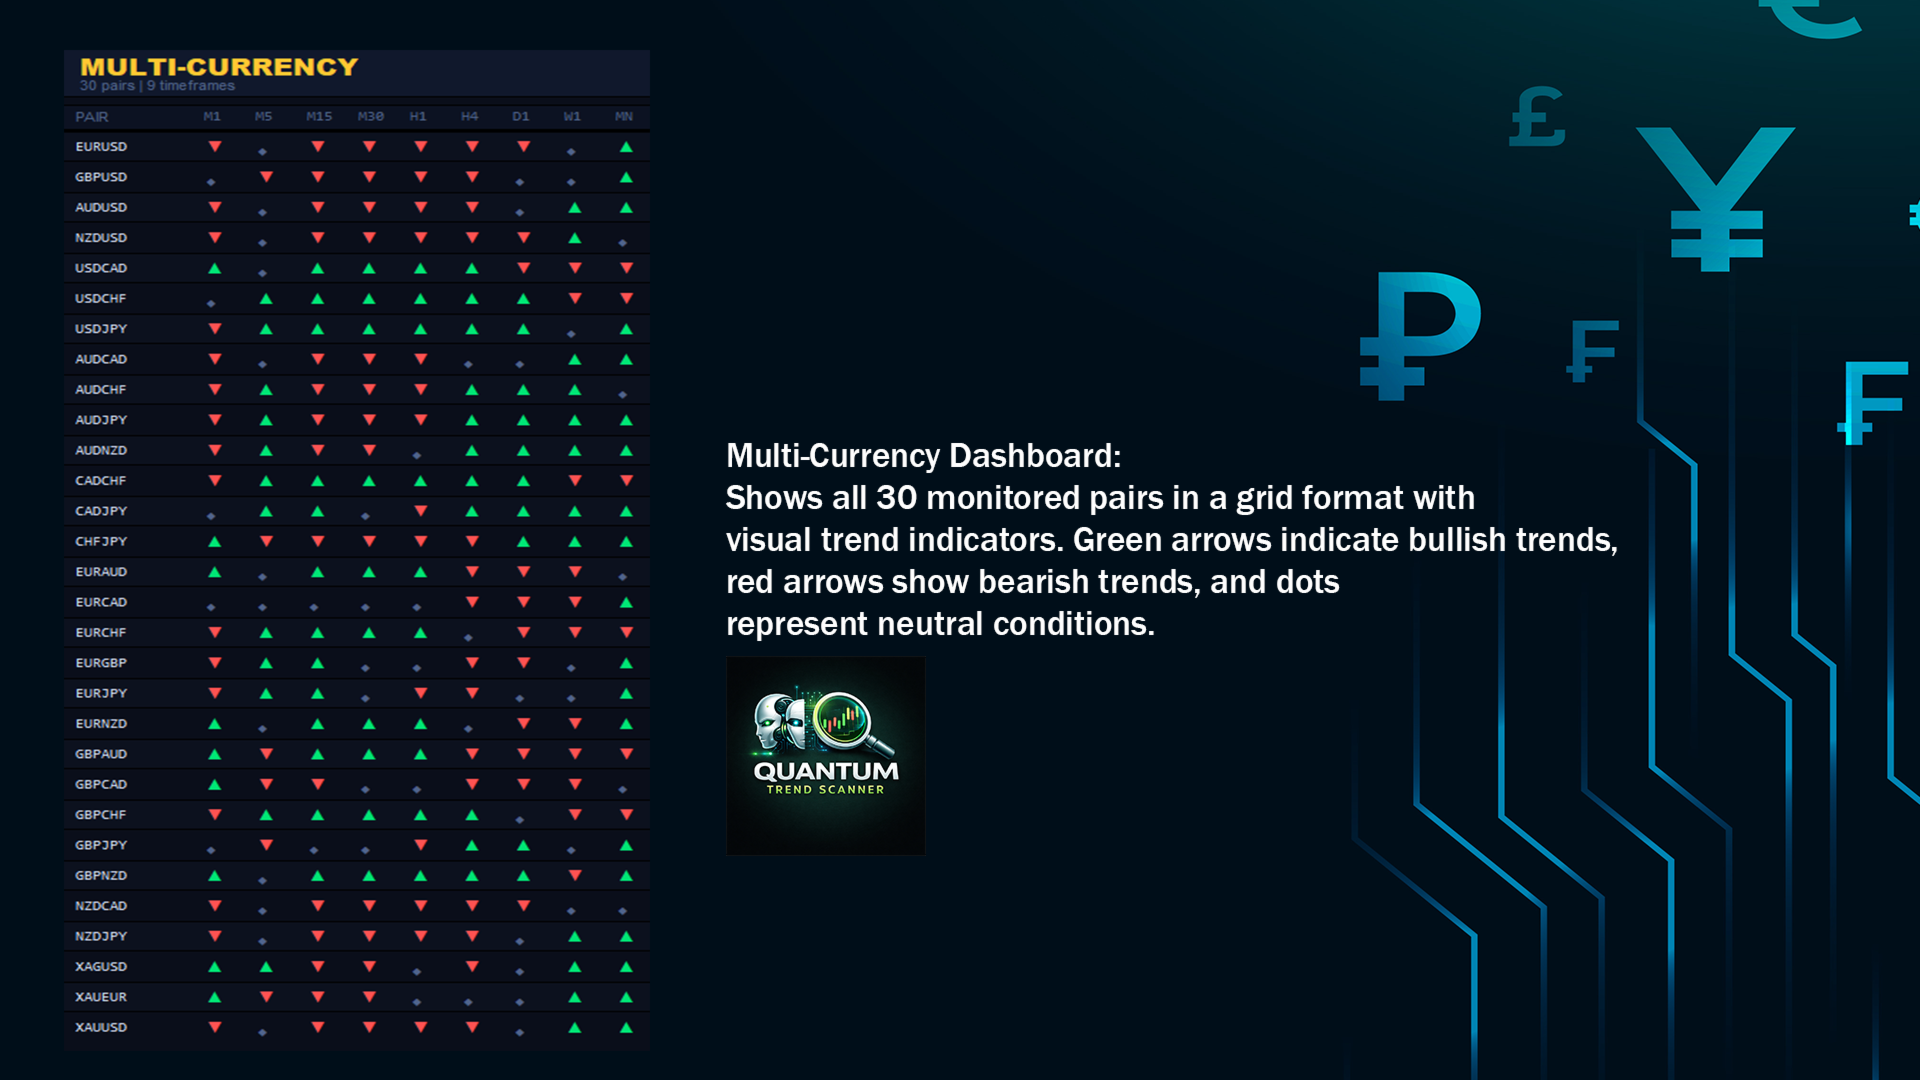
Multi-Currency Dashboard: Shows all 30 monitored pairs in a grid format with visual trend indicators. Green arrows indicate bullish trends, red arrows show bearish trends, and dots represent neutral conditions.
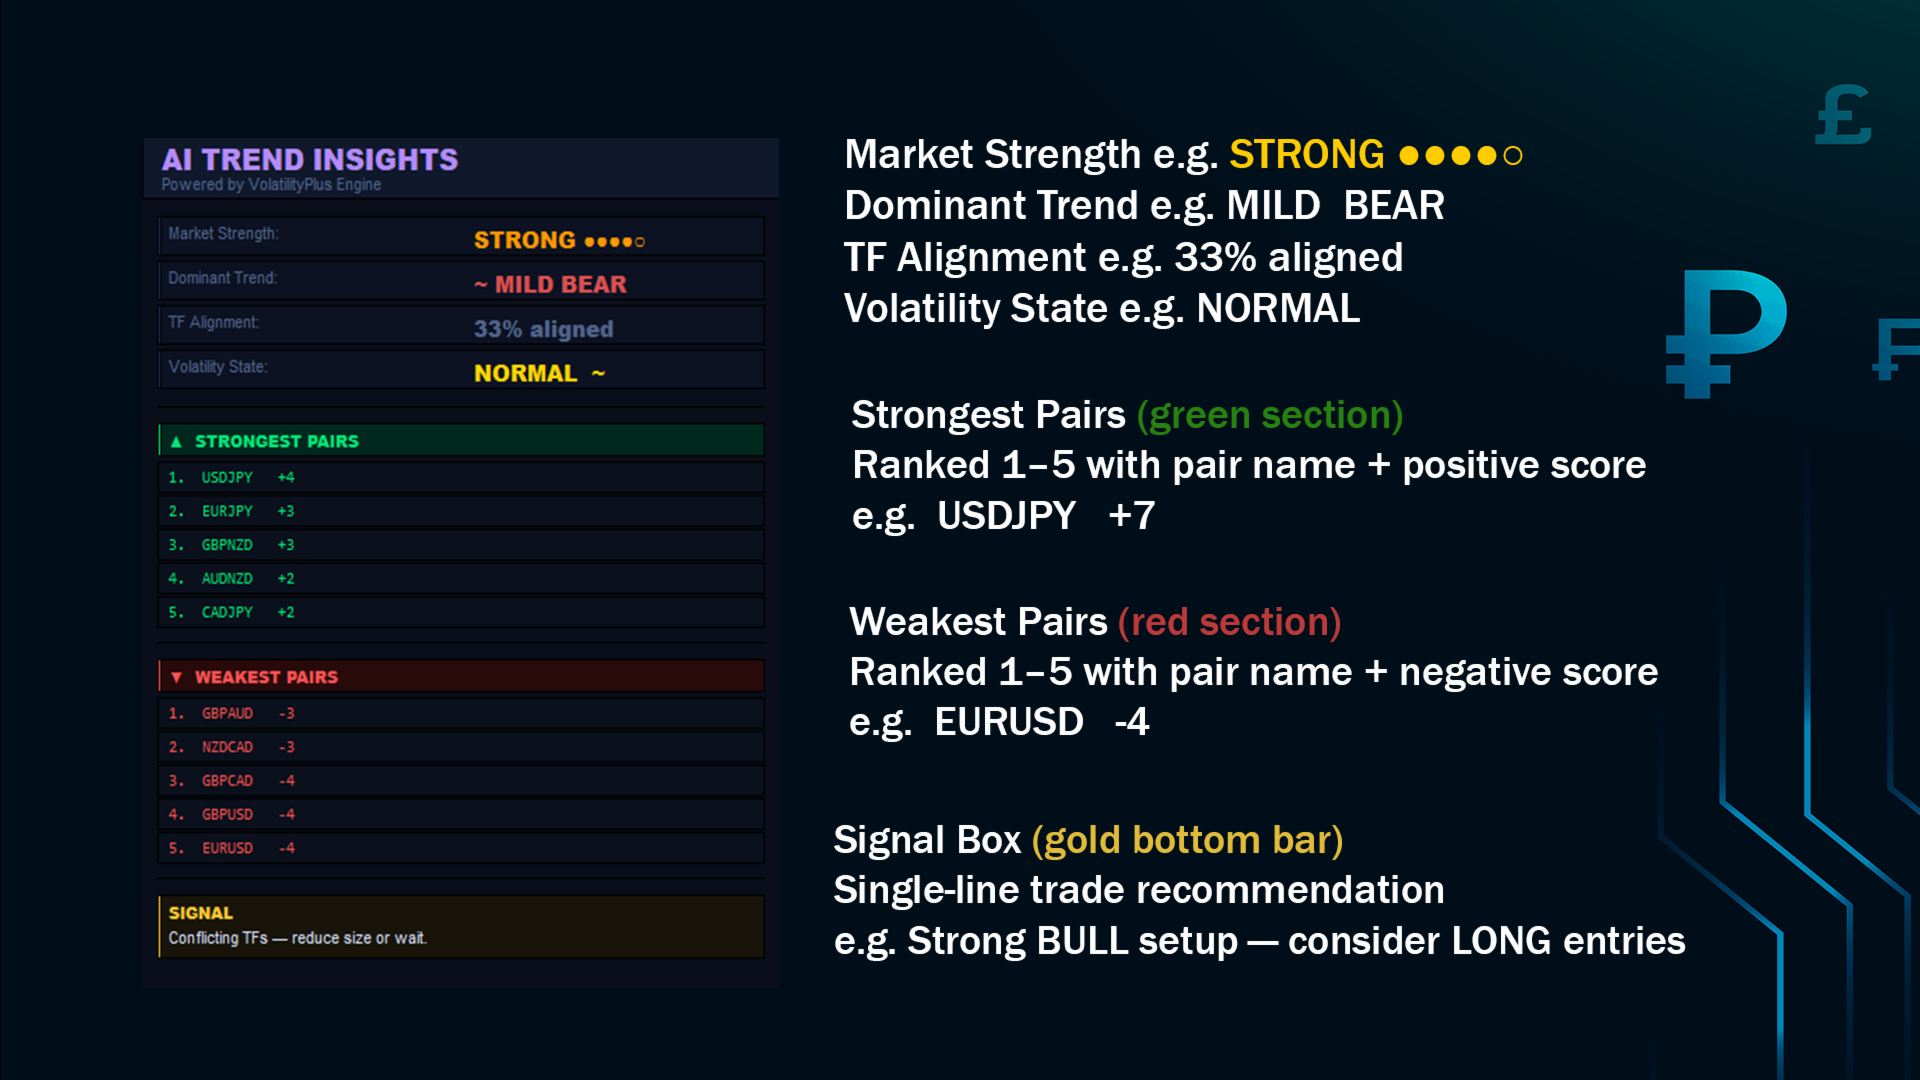
Market Insights Panel: Provides calculated market metrics including overall market strength, dominant trend direction, timeframe alignment percentage, and volatility assessment. The panel also ranks the top five strongest and weakest trending pairs.
Technical Approach
The indicator calculates trends using three confirmation methods: EMAS, price momentum evaluation with ATR-based thresholds, and market structure analysis through swing highs and lows. All three methods must align before confirming a strong trend signal.
Trend strength is measured using a directional movement calculation.
Input Parameters
TrendPeriod: Period for trend calculation (default 14) IntensityPeriod: Period for strength analysis (default 20) ShowLeftPanel, ShowRightPanel, ShowAIPanel: Toggle individual panels BaseFontSize: Adjust text size for different screen resolutions Panel position settings: Customize dashboard locations
Usage Recommendations
This indicator is designed for traders who analyze multiple currency pairs and timeframes. It works on all currency pairs and timeframes. The tool is suitable for trend-following strategies and helps identify high-probability setups when multiple timeframes align.
For optimal use, traders should focus on pairs showing alignment across 6 or more timeframes with intensity readings above 60. Lower timeframes can be used for entry timing when higher timeframes show trend agreement.
Important Notes
This is a technical analysis tool that displays historical and current market data. It does not place trades automatically. Trading decisions should be based on proper analysis and risk management principles.
The indicator updates every 30 seconds and recalculates trend values on new bar formation to minimize flickering and provide stable signals.
System Requirements
MetaTrader 5 platform


This is an amazing indicator. Thank you Niccyril.