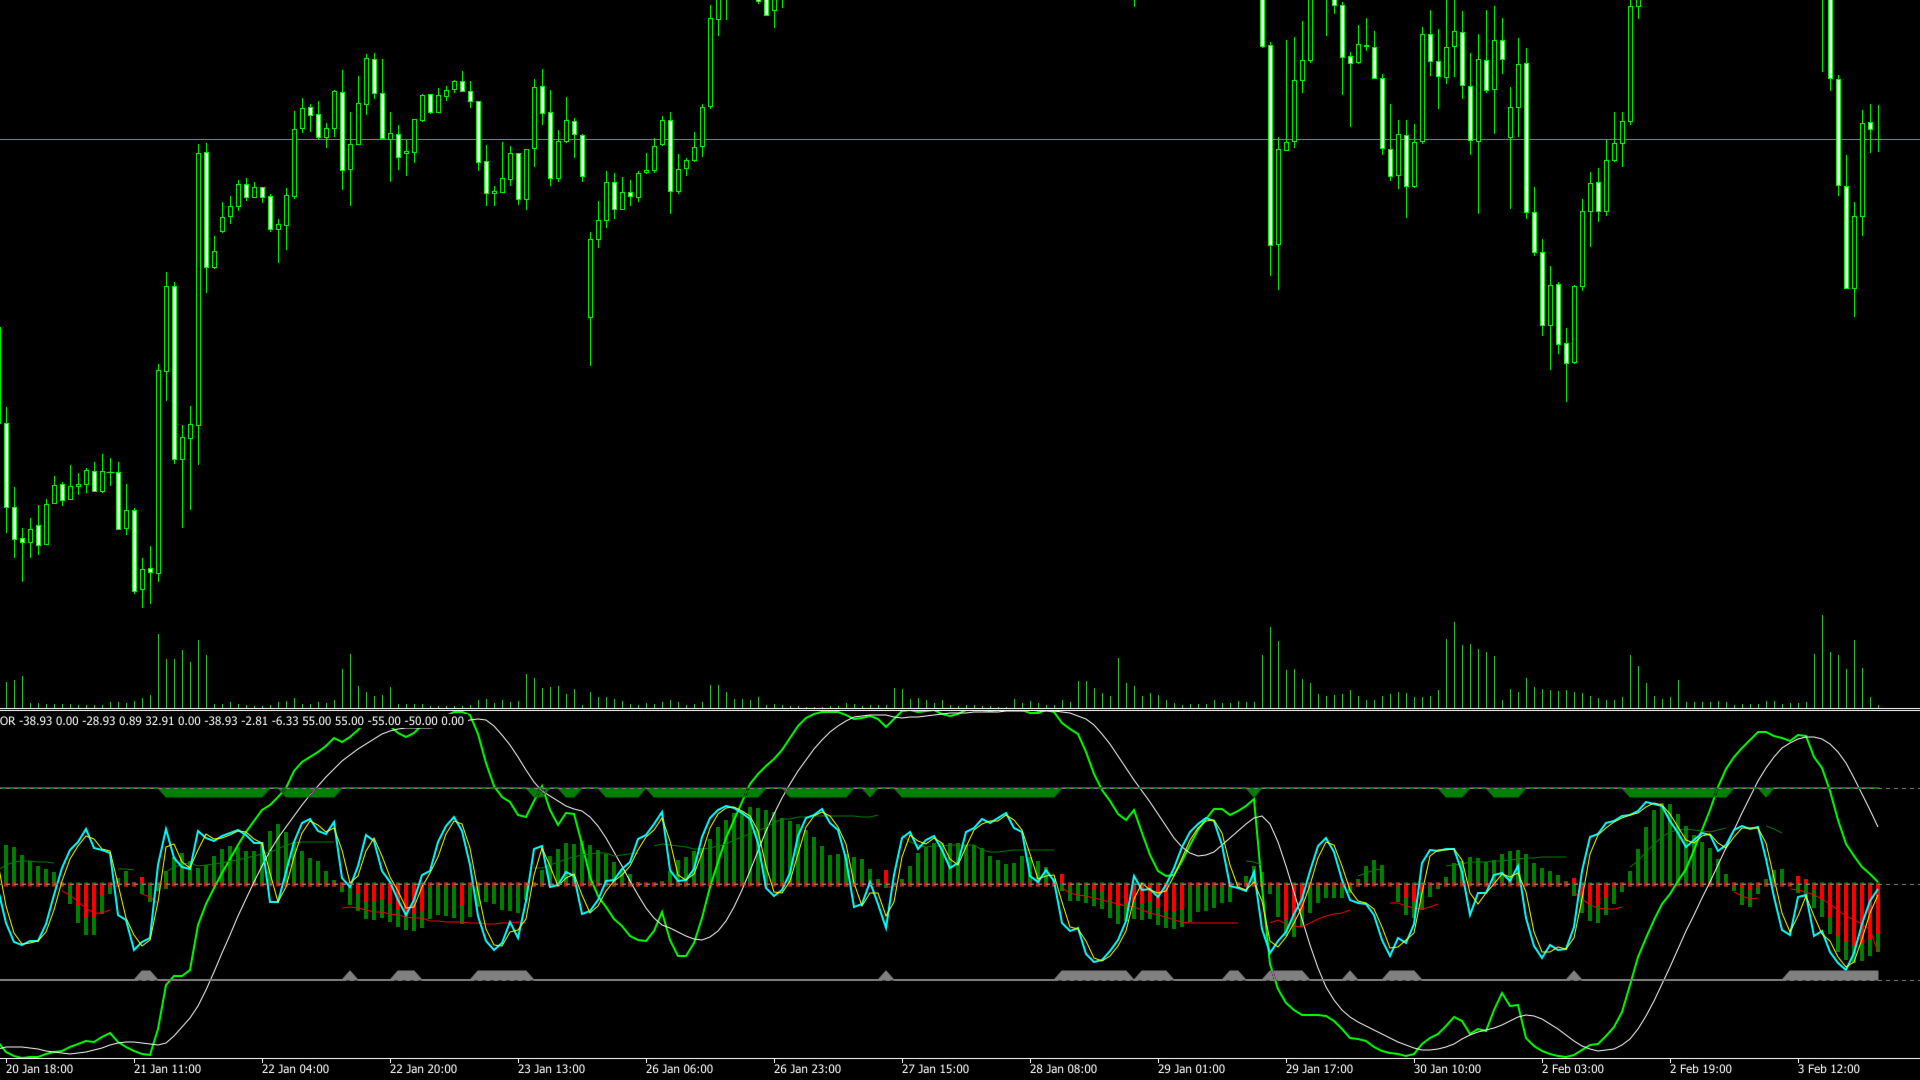
Matrix Oscillator

MATRIX OSCILLATOR - Summary Guide🎯 WHAT IS IT?

A multi-component oscillator that combines:

  • Smart Money Flow (MFI-based histogram)
  • Net Score (Trend strength from -100 to +100)
  • Signal Line (Crossover reference)
  • Confluence Zones (Confirmation areas)
  • PhiSmoother Technology (Advanced noise filtering)

─────────────────────────────────────┘

✅ STRONG BUY SIGNALS
Component Condition
Confluence Green zone filled (top)
Money Flow Green bars above zero
MFI Threshold MFI above green threshold line
Net Score Positive value
Net Score Color GREEN (above signal line)
❌ STRONG SELL SIGNALS
Component Condition
Confluence Red zone filled (bottom)
Money Flow Red bars below zero
MFI Threshold MFI below red threshold line
Net Score Negative value
Net Score Color RED (below signal line)
⚠️ CAUTION SIGNALS
  • No confluence zone filled
  • Net Score near zero
  • MFI and Net Score disagree
  • Recent crossover (wait for confirmation)
📈 NET SCORE INTERPRETATION
Range Meaning
+75 to +100 Very strong uptrend
+50 to +75 Strong uptrend
+25 to +50 Moderate uptrend
0 to +25 Weak uptrend
0 to -25 Weak downtrend
-25 to -50 Moderate downtrend
-50 to -75 Strong downtrend
-75 to -100 Very strong downtrend
🔧 KEY INPUT PARAMETERSSmart Money Flow

text

Money Flow Length: 10 (MFI calculation period) Smooth: 4 (Smoothing factor)

Cluster Settings

text

Cluster Dispersion: 4 (MA spacing) Upper Trim: 0 (Remove short MAs) Lower Trim: 0 (Remove long MAs)

Signal Settings

text

Signal Filter: PhiSmoother Signal Length: 20

Display Options

text

Show Money Flow: true Show Confluence Areas: true Show Hyper Wave: false

📋 TRADING STRATEGIESStrategy 1: Confluence Entry

text

LONG: ├── Green confluence zone appears ├── Net Score positive and GREEN ├── Enter next candle └── Stop below recent low SHORT: ├── Red confluence zone appears ├── Net Score negative and RED ├── Enter next candle └── Stop above recent high

Strategy 2: Crossover Entry

text

BUY: Net Score crosses ABOVE Signal line SELL: Net Score crosses BELOW Signal line Filter: Only trade with confluence confirmation

Strategy 3: MFI Acceleration

text

BUY: MFI breaks above bullish threshold SELL: MFI breaks below bearish threshold Confirm: Net Score agrees with direction

Strategy 4: Extreme Reversal

text

SELL Setup: Net Score above +75, turns RED BUY Setup: Net Score below -75, turns GREEN

🎚️ SETTINGS BY TRADING STYLEScalping (M1-M15)

text

Money Flow Length: 7 Smooth: 3 Cluster Dispersion: 3 Signal Length: 10

Day Trading (M15-H1)

text

Money Flow Length: 10 Smooth: 4 Cluster Dispersion: 4 Signal Length: 20

Swing Trading (H4-Daily)

text

Money Flow Length: 14 Smooth: 5 Cluster Dispersion: 5 Signal Length: 30

Position Trading (Daily-Weekly)

text

Money Flow Length: 21 Smooth: 7 Cluster Dispersion: 6 Signal Length: 50

📊 SIGNAL PRIORITY

text

1. HIGHEST: Confluence Zone Active └── Both MFI and Oscillator agree 2. HIGH: Net Score / Signal Crossover └── Momentum shift detected 3. MEDIUM: MFI Threshold Break └── Acceleration in money flow 4. LOW: Net Score Zero Cross └── Trend direction change 5. LOWEST: Individual signals └── Use for confirmation only

✅ DO's

text

✓ Wait for confluence confirmation ✓ Check higher timeframe trend ✓ Combine with support/resistance ✓ Use proper risk management (1-2%) ✓ Backtest on your market/timeframe ✓ Journal trades with readings

❌ DON'Ts

text

✗ Trade against strong confluence ✗ Ignore divergences ✗ Over-leverage on signals ✗ Trade every crossover ✗ Rely solely on this indicator ✗ Trade news without caution

🔍 DIVERGENCE DETECTIONBullish Divergence

text

Price: Lower Lows Net Score: Higher Lows Result: Expect UP reversal

Bearish Divergence

text

Price: Higher Highs Net Score: Lower Highs Result: Expect DOWN reversal

📱 QUICK REFERENCE

text

╔════════════════════════════════════════════╗ ║ QUICK DECISION GUIDE ║ ╠════════════════════════════════════════════╣ ║ ║ ║ 🟢 BUY when ALL true: ║ ║ • Green confluence filled ║ ║ • Green MFI above threshold ║ ║ • Net Score GREEN & positive ║ ║ ║ ║ 🔴 SELL when ALL true: ║ ║ • Red confluence filled ║ ║ • Red MFI below threshold ║ ║ • Net Score RED & negative ║ ║ ║ ║ ⏸️ WAIT when: ║ ║ • No confluence ║ ║ • Mixed signals ║ ║ • Net Score near zero ║ ║ ║ ║ ⚠️ REVERSAL WARNING: ║ ║ • Net Score above +75 or below -75 ║ ║ • Color changes at extremes ║ ║ ║ ╚════════════════════════════════════════════╝

🛠️ INSTALLATION
  1. Copy .mq5 file to MQL5\Indicators folder
  2. Open MetaEditor, compile (F7)
  3. Drag indicator to chart
  4. Configure settings
  5. Click OK
⚙️ TROUBLESHOOTING
Problem Solution
Not showing Check Experts tab for errors
Flat lines Load more history
Compilation error Update MT5, recompile
No MFI data Use pair with tick volume
📌 KEY TAKEAWAYS
  1. Confluence is king - Only trade when zones are filled
  2. Color matters - Green = bullish momentum, Red = bearish
  3. Extremes reverse - Watch +75/-75 levels
  4. Confirm with MFI - Money flow validates trend
  5. Higher TF wins - Check daily trend first
  6. Patience pays - Wait for clear signals

Produtos recomendados
Algo Pumping
Ihor Otkydach
4.76 (21)
PUMPING STATION – Sua estratégia pessoal “tudo incluído” Apresentamos o PUMPING STATION — um indicador revolucionário para Forex que vai transformar sua maneira de operar em uma experiência empolgante e eficaz. Este não é apenas um assistente, mas sim um sistema de trading completo com algoritmos poderosos que vão te ajudar a operar de forma mais estável. Ao adquirir este produto, você recebe GRATUITAMENTE: Arquivos de configuração exclusivos: para uma configuração automática e desempenho máxim
SyntheticaFX Boom and Crash
Hendrik Lodewyk Coetsee
5 (1)
SyntheticaFX Boom and Crash  is a powerful tool designed to highlight potential spike opportunities in the market, exclusively for traders focusing on Crash and Boom indices. This indicator is strictly optimized to operate on the 3-minute (M3) timeframe and supports only the following pairs: Crash 1000 Index , Crash 900 Index , Crash 600 Index , Crash 500 Index , Crash 300 Index , Boom 1000 Index , Boom 900 Index , Boom 600 Index , Boom 500 Index , and Boom 300 Index . It will not display signa
Range Directional Force Indicator – Designed for You to Optimize! The Range Directional Force Indicator is a cutting-edge tool designed to empower traders by visualizing market dynamics and directional strength. Built to offer insights into market trends and reversals, this indicator is an invaluable asset for traders seeking precision in their strategies. However, it is important to note that this indicator is not optimized, leaving room for you to tailor it to your unique trading preferences.
Introduction to the Manual Backtesting Indicator on MQL5 The MetaTrader platform provides an excellent backtesting tool for evaluating Expert Advisors (EAs). However, when it comes to manually backtesting a strategy to assess its effectiveness, this tool has some limitations: You cannot manually draw zones or trend lines while in backtesting mode. You cannot switch timeframes to check time alignment. For example, if my strategy requires additional confirmation from a higher timeframe (HTF), this
Ultimate Boom and Crash Indicator The Ultimate Boom and Crash Indicator is a cutting-edge tool developed by  Coetsee Digital , designed to identify potential spike opportunities in the market. Crafted for traders focusing on Deriv and Weltrade synthetic markets, this indicator is optimized to operate exclusively on the 3-minute (M3), 5-minute (M5), 15-minute (M15), 30-minute (M30), and 1-hour (H1) timeframes and supports only the following pairs: PainX 1200, PainX 999, PainX 800, PainX 600, Pai
This indicator builds upon the previously posted Nadaraya-Watson smoothers. Here we have created an envelope indicator based on Kernel Smoothing with integrated alerts from crosses between the price and envelope extremities. Unlike the Nadaraya-Watson estimator, this indicator follows a contrarian methodology. Please note that by default this indicator can be subject to repainting. Users can use a non-repainting smoothing method available from the settings. The triangle labels are designed so
Overview TriParity AfterShock PRO Scanner é um indicador de painel discricionário para MetaTrader 5. Nesta descrição, uma tríade significa a relação entre três pares de moedas ou instrumentos. O Scanner analisa várias tríades e timeframes em um único painel e ajuda o trader a organizar uma watchlist de forma mais estruturada. Seu objetivo é reduzir a sobrecarga de gráficos, comparar candidatos lado a lado e destacar condições que mereçam uma análise mais detalhada. Este produto não executa arbit
Jita Indicator Pro MT5 | All Timeframes Professional Trend Agreement System – Premium Edition ($500) What Is Jita Indicator Pro? Jita Indicator Pro is a structured trend-confirmation system designed for serious traders who value precision, alignment, and controlled signal behavior. It combines: Advanced band-based trend direction logic ATR-driven structural trigger engine Dual-confirmation agreement system Locked history update design This indicator prints signals only when multiple conditions
Divergent Stochastic Filter II Catch Reversals Early, Filter Noise, Trade with Confidence The Edge: Why This Stochastic is Different  Every trader knows the Stochastic oscillator. But knowing when to trust its signals, that's the real challenge. The Divergent Stochastic Filter II transforms this classic indicator into a precision reversal detection system by adding critical elements: divergence intelligence, signal filtering and exhaustion detection.  While standard Stochastic oscillators fire s
Supply and Demand Monster
Tsog Erdene Borjigon Enkhkhudulmur
Supply and demand zones are at the heart of   supply and demand trading . These zones are areas that show  liquidity at a specific price.  The supply zone is also called the distribution zone, while the demand zone is called the accumulation zone.   Our indicator automatically draw supply and demand zones in Metatrader 5. It give opportunity to understand trading zone and avoiding risk.
FiveStarFX Gold Reversal Edge Professional automated trading solution designed for structured execution and controlled risk management in the Gold market. Built for traders who value discipline, precision, and consistency. Key Features Fully automated trading One trade at a time (controlled exposure) Fixed Stop Loss and Take Profit Smart Break-Even protection Profit lock with buffer Step-based trailing management Spread protection system Works on any broker Trade Management The E
FREE
Buy Sell Chill Indicator
Santino Emanuele Ventre
Take the stress out of trading with the Buy Sell Chill Indicator —your ultimate companion for effortless trend identification. This easy-to-use tool gives you a clear visual arrow to show the direction the market is about to take, making trading decisions as simple and "chill" as possible. Why Choose the Buy Sell Chill Indicator? Relaxed and Intuitive : Designed to make trading less stressful and more enjoyable by giving you straightforward signals with no clutter. Customizable Features : ATR Pe
BUY & SELL ARROW INDICATOR - Professional Trading Signals!  CRYSTAL CLEAR TRADING SIGNALS WITH PRECISION ACCURACY. WORKS ON ALL TIME FRAME, BEST ON 1HR TIME FRAME WHAT MAKES THIS INDICATOR REVOLUTIONARY?  NO REPAINTING - NO GUESSWORK - NO REGRETS! 100% ACCURATE SIGNALS that never change or disappear ZERO OFFSET - Signals appear exactly when they should PERFECT PRECISION.  INSTANT VISUAL CLARITY CRYSTAL CLEAR BLUE ARROWS for BUY signals STRIKING PINK ARROWS for SELL signals CLEAN CHART INTERF
Protocol
Vincent Georges David Ferrier
PROTOCOL - Institutional Liquidity Grab & SMC Elite Liquidity Grab & Advanced SMC Execution ( MT4 Available here ) Dynamic Trend Sniper MT5 (available here) LIMITED RELEASE & PRICING NOTICE Launch Special: Available for $299 USD for the first 7 days only . After this period, the price will strictly increase to $399 USD. Prop Firm Protection Protocol: Major Prop Firms enforce strict copy-trading and trade-crowding policies. To protect the statistical edge of this algorithm and ensure our
Manyal trading system, CovEchoTrend Robot, focuses on reliability and flexibility. By employing statistical analysis methods to study the relationships between the base indicator and market patterns, the system enables a deeper understanding of market processes. Intelligent pattern analysis: The application of statistical data processing helps identify key trend reversal points more accurately, signaling significant market shifts. Informed decision-making is based on the intersection of indicato
ToolBox 360 is the swiss knife of all indicators. It is full packed with useful tools to help you with your trading. It can be used to find best entry and exit points and help you to decide if you should open a trade or not. It shows market trends, candlestick formations outside / inside bars and you can sett time based allerts. Main features: Time based Fibonacci lines Choose a start and end time and the indicator shows you Fibonacci lines within the selected time range including range high a
Indicador RSI Multi-Timeframe Liberte o poder da análise multi-timeframe com o nosso intuitivo Indicador RSI! Obtenha uma perspetiva abrangente sobre o momentum do mercado em vários timeframes, tudo num único gráfico. O nosso Indicador RSI Multi-Timeframe permite-lhe acompanhar o Índice de Força Relativa (RSI) com um período consistente em cinco timeframes personalizáveis, capacitando-o a tomar decisões de trading mais informadas. Principais Características: Visualização Simultânea de Multi-Time
Xau Marti MT5
BILLY ARANDUQUE ABCEDE
Get the EA for FREE Just sign up and use my broker. Broker Link :  https://fbs.partners?ibl=684451&ibp=26113188 Setfile Here :  https://drive.google.com/file/d/1ZKvGf5KaUTZvrt2YE98a18sp7nzGUpVf/view?usp=sharing MT4 Version Here :  https://www.mql5.com/en/market/product/136465 XAU Marti The Smart Choice for Gold & Forex Traders -  Profit Potential! Why This EA Stands Out: RSI-POWERED ENTRIES   - Combines the reliability of RSI indicators with advanced money management for high-probabi
RBreaker
Zhong Long Wu
RBreaker Gold Indicators é uma estratégia de negociação intradiária de curto prazo para futuros de ouro que combina duas abordagens: o seguimento de tendência e as reversões intradiárias. Ela permite capturar lucros durante mercados em tendência e também realizar lucros oportunamente e operar na direção oposta quando o mercado se reverte. Esta estratégia foi classificada por 15 anos consecutivos entre as dez estratégias de negociação mais lucrativas pela revista americana Futures Truth. Ela pos
WanaScalper
Isaac Wanasolo
1 (1)
A scalping indicator based on mathematical patterns, which on average gives signals with relatively small SL, and also occasionally helps to catch big moves in the markets (more information in the video) This indicator has three main types of notifications: The first type warns of a possible/upcoming signal on the next bar The second type indicates the presence of a ready signal to enter the market/open a position The third type is for SL and TP levels - you will be notified every time price re
PREngulfing
Slobodan Manovski
PR EA - Engulfing Pattern Trading System Automated Engulfing Pattern Detection with MA Confirmation The PR EA is a Meta Trader 5 expert advisor that identifies and trades bullish/bearish engulfing candlestick patterns when confirmed by a moving average filter. Designed for swing trading on 30-minute charts with compatibility for M15 and H1 time frames. Key Features: Pattern Recognition - Detects valid bullish/bearish engulfing candle formations Trend Confirmation - 238-period SMA filter
Heatmap Indicator
Ganegama Ganithage Rumesh Erangana
XAUUSD Heat Map Scalping Indicator Perfect for 1M, 3M, 5M, 15M Scalping on Gold (XAUUSD) Take your scalping to the next level with this exclusive Heat Map indicator , designed and optimized specifically for XAUUSD . This tool is a powerful visual assistant that helps you instantly identify market strength, pressure zones, and potential entry points in real time. Key Features: Optimized for Fast Scalping : Works best on 1-minute, 3-minute, 5-minute, and 15-minute timeframes Specializ
Ferramentas para ganhar e pesquisar. O núcleo dos sinais de negociação e estratégia é baseado no algoritmo do autor para a formação de padrões de previsão de preços. Aplicável a qualquer instrumento! Complementado com um sistema de controle baseado no MA "Nine-Tailed Fox" , atualizando e ajustando o sinal com a maior precisão possível para o mercado, instrumento e período de trabalho. Elegíveis: Todos os instrumentos em todos os mercados (há exceções). Para quem é: fundos de hedge, gestores d
Price Magnet — Price Density and Attraction Levels Indicator Price Magnet is a professional analytical tool designed to identify key support and resistance levels based on statistical Price Density. The indicator analyzes a specified historical period and detects price levels where the market spent the most time. These zones act as “magnets,” attracting price action or forming a structural base for potential reversals. Unlike traditional Volume Profile tools, Price Magnet focuses on price-time d
The Future of Trading is Here: AI-Driven Precision Stop guessing where the market will turn. The AI ZigZag Predictor is a sophisticated trading tool that integrates advanced Machine Learning (ONNX) models directly into MetaTrader 5. Designed specifically for high-volatility assets like Gold (XAUUSD) , this indicator analyzes complex candlestick patterns and time-session data to predict high-probability trend reversals. How It Works Unlike standard indicators that rely on lagging formulas, our sy
Xtrade Trend Detector
Dago Elkana Samuel Dadie
Xtrade Trend Detector is an indicator capable of finding the best opportunities to take a position in any stock market. Indeed, it is a great tool for scalpers but also for Daytraders. You could therefore use it to identify areas to trade, it fits easily on a chart. I use it to detect trends on Big timeframes and take positions on Small timeframes. Don't hesitate to give me a feedback if you test it.
AanIsnaini Signal Matrix MT5 PRO Institutional-Grade Market Regime & Trend Dashboard (Zero-Repaint) STOP TRADING WITH LAG. START TRADING WITH MATH. The free version (v1.3) gave you visibility. The PRO Version gives you the edge . AanIsnaini Signal Matrix PRO is not just an update—it is a complete algorithmic rewrite of my popular signal dashboard. While the free version relies on standard indicators (which lag and react slowly), the PRO version utilizes  Digital Signal Processing (DSP) , Zero-L
Rainbow EA MT5
Jamal El Alama
Description : Rainbow EA MT5 is a simple Expert advisor based on   Rainbow MT5 indicator witch is based on Moving average with period 34. The indicator is incorporated in the EA, therefore, it is not required for the EA to operate, but if you wish, you can download it from   my product page . The Expert Advisor settings are as follows : Suitable for Timeframes up to H1 The parameters below can be set according to your trading rules. StopLoss ( Stop Loss in pips) TakeProfit ( Take Profit in pips
Correlation Matrix Pro - Scanner de Hedge Multi-Moedas Entenda as relações entre pares de moedas em tempo real! Uma poderosa ferramenta de análise que ajuda você a visualizar relações estatísticas entre até 6 pares de moedas simultaneamente. Perfeito para gestão de portfólio, diversificação de riscos e estratégias de hedge. RECURSOS PRINCIPAIS - Correlação de Pearson em tempo real com retornos logarítmicos - Monitore até 6 pares de moedas simultaneamente - Detecção automática de timeframe - Per
FREE
CCI Multi Dashboard MT5
Andrew Ingosi Likare
5 (1)
The CCI Trend Dashboard is an advanced technical analysis tool available that provides a dashboard interface for traders to analyze multiple symbols and timeframes at once. It uses the Commodity Channel Index (CCI) in combination with currency strength and volumes to analyze market trends. The tool is user-friendly and suitable for both beginner and advanced traders. Note:  The values are derived from the CCI values of the respective symbol and timeframe using the specified period from the sett
Os compradores deste produto também adquirem
Azimuth Pro
Ottaviano De Cicco
5 (6)
PROMOÇÃO DE LANÇAMENTO O preço do Azimuth Pro está inicialmente definido em 299$ para os primeiros 100compradores. O preço final será de 499$ . A DIFERENÇA ENTRE ENTRADAS RETAIL E INSTITUCIONAIS NÃO É O INDICADOR — É A LOCALIZAÇÃO. A maioria dos traders entra em níveis de preço arbitrários, perseguindo momentum ou reagindo a sinais atrasados. As instituições esperam o preço atingir níveis estruturados onde oferta e demanda realmente mudam. Azimuth Pro mapeia esses níveis automaticamente: VWA
Divergence Bomber
Ihor Otkydach
4.9 (86)
Cada comprador deste indicador recebe adicionalmente, e de forma gratuita: A ferramenta exclusiva "Bomber Utility", que acompanha automaticamente cada operação, define os níveis de Stop Loss e Take Profit e fecha operações de acordo com as regras da estratégia; Arquivos de configuração (set files) para ajustar o indicador em diferentes ativos; Set files para configurar o Bomber Utility nos modos: "Risco Mínimo", "Risco Balanceado" e "Estratégia de Espera"; Um vídeo tutorial passo a passo que aju
OmniSync Projection
Antonio-alin Teculescu
5 (1)
Chronos Fractal Engine is an innovative price projection indicator for MetaTrader 5, designed to transform your technical analysis by intelligently identifying and projecting historical price patterns. Built upon an advanced correlation algorithm and the fractal principles of the market, this powerful tool visualizes potential future price movements, giving you a unique edge in your trading decisions. What is Chronos Fractal Engine? At its core, the Chronos Fractal Engine employs a sophisticat
RFI levels PRO MT5
Roman Podpora
3.67 (3)
O indicador mostra com precisão os pontos de reversão e as zonas de retorno de preço onde o   Principais players . Você identifica onde novas tendências estão se formando e toma decisões com máxima precisão, mantendo o controle sobre cada negociação. VERSION MT4     -    Revela seu potencial máximo quando combinado com o indicador   TREND LINES PRO. O que o indicador mostra: Estruturas de reversão e níveis de reversão com ativação no início de uma nova tendência. Exibição dos níveis de   TAKE P
Btmm state engine pro
Garry James Goodchild
5 (3)
BTMM State Engine Pro is a MetaTrader 5 indicator for traders who use the Beat The Market Maker approach: Asian session context, kill zone timing, level progression, peak formation detection, and a multi-pair scanner from a single chart. It combines cycle state logic with a built-in scanner dashboard so you do not need the same tool on many charts at once. What it does Draws the Asian session range; session times can follow broker server offset or be set in inputs. Tracks level progression (L
RelicusRoad Pro: Sistema Operacional Quantitativo de Mercado 70% DE DESCONTO ACESSO VITALÍCIO (TEMPO LIMITADO) - JUNTE-SE A 2.000+ TRADERS Por que a maioria dos traders falha mesmo com indicadores "perfeitos"? Porque eles operam Conceitos Únicos no vácuo. Um sinal sem contexto é uma aposta. Você precisa de CONFLUÊNCIA . RelicusRoad Pro não é um simples indicador de seta. É um Ecossistema Quantitativo de Mercado completo. Ele mapeia a "Estrada do Valor Justo", distinguindo ruído de rupturas estru
Bill Williams Advanced
Siarhei Vashchylka
5 (11)
Bill Williams Advanced is designed for automatic chart analysis using Bill Williams' "Profitunity" system. The indicator analyzes four timeframes at once. Manual (Be sure to read before purchasing) Advantages 1. Analyzes the chart using Bill Williams' "Profitunity" system. Signals are displayed in a table in the corner of the screen and on the price chart. 2. Finds all known AO and AC signals, as well as zone signals. Equipped with a trend filter based on the Alligator. 3. Finds "Divergence Bar
CGE Trading Suite
Carl Gustav Johan Ekstrom
5 (1)
CGE Trading Suite delivers the analytical edge typically reserved for professional trading desks. The platform integrates a full suite of analytical tools into one seamless workflow: dynamic grid mapping, liquidity behavior analysis, ECM, trend lines, MIDAS, trade cycles, and directional channel projections. Together, these provide a unified view of market structure and momentum. Directional clarity is further enhanced by the capital flow index, which measures currency basket strength to identif
ARIPoint
Temirlan Kdyrkhan
ARIPoint is a powerful trading companion designed to generate high-probability entry signals with dynamic TP/SL/DP levels based on volatility. Built-in performance tracking shows win/loss stats, PP1/PP2 hits, and success rates all updated live. Key Features: Buy/Sell signals with adaptive volatility bands Real-time TP/SL/DP levels based on ATR Built-in MA Filter with optional ATR/StdDev volatility Performance stats panel (Success, Profit/Loss, PP1/PP2) Alerts via popup, sound, push, or email Cu
LINHAS DE TENDÊNCIA PRO   -   Ajuda a entender onde o mercado está realmente mudando de direção. O indicador mostra inversões de tendência reais e pontos onde os principais participantes retornam ao mercado. Você vê     Linhas BOS   Análise de tendências e níveis-chave em prazos maiores — sem configurações complexas ou ruídos desnecessários. Os sinais não são repintados e permanecem no gráfico após o fechamento da barra. VERSÃO MT4   -   Revela seu potencial máximo quando combinado com o   indic
PZ Trend Trading MT5
PZ TRADING SLU
3.8 (5)
O Trend Trading é um indicador projetado para lucrar o máximo possível com as tendências que ocorrem no mercado, cronometrando retrocessos e rupturas. Ele encontra oportunidades de negociação analisando o que o preço está fazendo durante as tendências estabelecidas. [ Guia de instalação | Guia de atualização | Solução de problemas | FAQ | Todos os produtos ] Negocie mercados financeiros com confiança e eficiência Lucre com as tendências estabelecidas sem ser chicoteado Reconhecer retrocessos
Ultimate SMC Indicator
Hicham Mahmoud Almoustafa
1 (1)
Ultimate SMC PRO – Smart Money Concepts Indicator (Order Blocks, FVG, Liquidity, BOS) for MetaTrader 5  Ultimate SMC PRO is a professional trading indicator designed to visualize Smart Money Concepts directly on the chart. The indicator combines several institutional trading tools in one system to help traders identify potential high-probability trading zones. ULTIMATE SMC INDICATOR — COMPLETE TRADING GUIDE +   SMC Bridge The indicator analyzes market structure, liquidity behavior an
PZ Day Trading MT5
PZ TRADING SLU
2.83 (6)
Este indicador detecta reversões de preços em zigue-zague, usando apenas análise de ação de preços e um canal donchiano. Ele foi projetado especificamente para negociações de curto prazo, sem repintar ou retroceder. É uma ferramenta fantástica para traders astutos, com o objetivo de aumentar o tempo de suas operações. [ Guia de instalação | Guia de atualização | Solução de problemas | FAQ | Todos os produtos ] Surpreendentemente fácil de negociar Fornece valor em cada período de tempo Impleme
Grabber System MT5
Ihor Otkydach
4.83 (23)
Apresento a você um excelente indicador técnico: Grabber, que funciona como uma estratégia de trading “tudo incluído”, pronta para usar. Em um único código estão integradas ferramentas poderosas de análise técnica de mercado, sinais de entrada (setas), funções de alertas e notificações push. Cada comprador deste indicador também recebe gratuitamente: Utilitário Grabber: ferramenta para gerenciamento automático de ordens abertas Vídeo tutorial passo a passo: como instalar, configurar e operar com
Apresentando       Quantum Breakout PRO   , o inovador Indicador MQL5 que está transformando a maneira como você negocia Breakout Zones! Desenvolvido por uma equipe de traders experientes com experiência comercial de mais de 13 anos,       Quantum Breakout PRO       foi projetado para impulsionar sua jornada comercial a novos patamares com sua estratégia de zona de fuga inovadora e dinâmica. O Quantum Breakout Indicator lhe dará setas de sinal em zonas de breakout com 5 zonas-alvo de lucro e su
Quantum TrendPulse
Bogdan Ion Puscasu
5 (22)
Apresentando   Quantum TrendPulse   , a ferramenta de negociação definitiva que combina o poder do   SuperTrend   ,   RSI   e   Stochastic   em um indicador abrangente para maximizar seu potencial de negociação. Projetado para traders que buscam precisão e eficiência, este indicador ajuda você a identificar tendências de mercado, mudanças de momentum e pontos de entrada e saída ideais com confiança. Principais características: Integração SuperTrend:   siga facilmente a tendência predominante do
Weltrade Spike Sentinel
Batsirayi L Marango
5 (1)
Introducing Indicator for PainX and GainX Indices Traders on Weltrade Get ready to experience the power of trading with our indicator, specifically designed for Weltrade   broker's PainX and GainX Indices.  Advanced Strategies for Unbeatable Insights Our indicator employs sophisticated strategies to analyze market trends, pinpointing optimal entry and exit points.  Optimized for Maximum Performance To ensure optimal results, our indicator is carefully calibrated for 5-minute timeframe charts on
Gartley Hunter Multi
Siarhei Vashchylka
5 (11)
Gartley Hunter Multi - An indicator for searching for harmonic patterns simultaneously on dozens of trading instruments and on all possible timeframes. Manual (Be sure to read before purchasing) | Version for MT4 Advantages 1. Patterns: Gartley, Butterfly, Shark, Crab. Bat, Alternate Bat, Deep Crab, Cypher 2. Simultaneous search for patterns on dozens of trading instruments and on all possible timeframes 3. Search for patterns of all possible sizes. From the smallest to the largest 4. All fou
AriX
Temirlan Kdyrkhan
1 (4)
AriX Indicator for MT5 A powerful trend-following and signal-evaluation tool AriX is a custom MT5 indicator that combines Moving Averages and ATR-based risk/reward logic to generate clear buy/sell signals. It visualizes dynamic SL/TP levels, evaluates past trade outcomes, and displays win/loss statistics in a clean on-chart panel. Key features include: Buy/Sell signals based on MA crossovers ATR-based SL/TP1/TP2/TP3 levels with visual lines and labels Signal outcome tracking with real-time stat
Meravith MT5
Ivan Stefanov
5 (1)
Ferramenta dos market makers. O Meravith irá: Analisar todos os timeframes e exibir a tendência atual em vigor. Destacar zonas de liquidez (equilíbrio de volume) onde o volume comprador e vendedor é igual. Mostrar todos os níveis de liquidez de diferentes timeframes diretamente no seu gráfico. Gerar e apresentar análise de mercado em formato de texto para sua referência. Calcular alvos, níveis de suporte e pontos de stop-loss com base na tendência atual. Calcular a relação risco/retorno das suas
Easy SMC Trading
Israr Hussain Shah
4 (1)
Análise de Tendência Estrutural com Auto RR e Scanner de BOS Versão: 1.0 Visão Geral A Análise de Tendência Estrutural com Auto RR é um sistema de negociação abrangente, concebido para traders que dependem da Ação do Preço e da Estrutura de Mercado. Combina um filtro de tendência suavizado com a deteção de Pontos de Oscilação e sinais de Ruptura de Estrutura (BOS) para gerar configurações de negociação de alta probabilidade. O principal diferencial desta ferramenta é a sua Gestão de Risco Aut
Trend Forecaster
Alexey Minkov
5 (7)
The Trend Forecaster indicator utilizes a unique proprietary algorithm to determine entry points for a breakout trading strategy. The indicator identifies price clusters, analyzes price movement near levels, and provides a signal when the price breaks through a level. The Trend Forecaster indicator is suitable for all financial assets, including currencies (Forex), metals, stocks, indices, and cryptocurrencies. You can also adjust the indicator to work on any time frames, although it is recommen
Shock Pullback
Suleiman Alhawamdah
5 (1)
De forma simples, você pode começar a operar quando o movimento dos números brancos — conhecidos como "pips" — começar a aparecer ao lado do candle atual. Os "pips" brancos indicam que uma operação de compra ou venda está ativa e se movendo na direção correta, conforme indicado pela cor branca. Quando o movimento dos pips brancos para e se transforma em uma cor verde estática, isso sinaliza o fim do momento atual. A cor verde dos números representa o lucro total obtido em "pips", independenteme
Antes de tudo, vale ressaltar que esta Ferramenta de Negociação é um Indicador Não Repintante, Não Redesenhante e Não Atrasado, o que a torna ideal para negociação profissional. Curso online, manual do utilizador e demonstração. O Indicador de Conceitos de Ação de Preço Inteligente é uma ferramenta muito poderosa tanto para traders novos quanto experientes. Ele combina mais de 20 indicadores úteis em um único, combinando ideias avançadas de negociação como Análise do Trader do Círculo Interno
Advanced Supply Demand MT5
Bernhard Schweigert
4.53 (15)
Atualmente com 33% de desconto! A melhor solução para qualquer Trader Novato ou especialista! Este indicador é uma ferramenta de negociação exclusiva, de alta qualidade e acessível porque incorporamos uma série de recursos proprietários e uma nova fórmula. Com esta atualização, você poderá mostrar fusos horários duplos. Você não só será capaz de mostrar um TF mais alto, mas também mostrar ambos, o TF do gráfico, MAIS o TF mais alto: MOSTRANDO ZONAS ANINHADAS. Todos os traders de Oferta e Demanda
ZIVA Signal Intelligence
Hassan Abdullah Hassan Al Balushi
ZIVA Signal Intelligence An Adaptive, Modular Market Intelligence System ZIVA Signal Intelligence is not positioned as a conventional trading indicator. It is a fully integrated, proprietary market intelligence system engineered to deliver structured, high-precision interpretation of price behavior within a controlled analytical environment. Developed through an independent architectural approach, ZIVA does not rely on, derive from, or replicate existing indicators. It represents a standalone
PZ Swing Trading MT5
PZ TRADING SLU
5 (5)
Swing Trading é o primeiro indicador projetado para detectar oscilações na direção da tendência e possíveis oscilações de reversão. Ele usa a abordagem de negociação de linha de base, amplamente descrita na literatura de negociação. O indicador estuda vários vetores de preço e tempo para rastrear a direção da tendência agregada e detecta situações nas quais o mercado está sobrevendido ou sobrecomprado em excesso e pronto para corrigir. [ Guia de instalação | Guia de atualização | Solução de prob
Ace Trend
Mikhail Sergeev
5 (3)
Apresentamos-lhe um indicador revolucionário que muda as regras do jogo no mundo da negociação de tendências. O indicador foi projetado para repensar o desempenho e elevar sua experiência de negociação a uma altura sem precedentes. Nosso indicador possui uma combinação única de recursos avançados que o diferenciam da concorrência. A tecnologia de ponta "Real Pricing Factors" oferece estabilidade incomparável, mesmo nas condições de mercado mais desafiadoras e voláteis. Diga adeus a padrões instá
O indicador " Dynamic Scalper System MT5 " foi desenvolvido para o método de scalping, operando dentro de ondas de tendência. Testado nos principais pares de moedas e ouro, é possível a compatibilidade com outros instrumentos de negociação. Fornece sinais para a abertura de posições de curto prazo ao longo da tendência, com suporte adicional para o movimento dos preços. O princípio do indicador: As setas grandes determinam a direção da tendência. Um algoritmo para gerar sinais de scalping sob
Este é um indicador para MT5 que fornece sinais precisos para entrar em uma negociação sem redesenhar. Ele pode ser aplicado a qualquer ativo financeiro: forex, criptomoedas, metais, ações, índices. Ele fornecerá estimativas bastante precisas e informará quando é melhor abrir e fechar um negócio. Assista o vídeo (6:22) com um exemplo de processamento de apenas um sinal que compensou o indicador! A maioria dos traders melhora seus resultados de negociação durante a primeira semana de negociação c
Mais do autor
Phantom Flow
Mahmoud Ahmed Abdou Ali
5 (1)
This indicator is a hybrid SMC + Trend + Oscillator tool that draws market-structure objects on the chart and also plots trend shift lines + arrows and a colored oscillator histogram. It includes these modules: Phantom Shift (ATR trend shift / trailing bands) Swing Structure (BOS/CHoCH + swing points) Internal Structure (iBOS/iCHoCH) Order Blocks (swing + internal) Equal Highs / Equal Lows (EQH / EQL) Fair Value Gaps (FVG) Premium / Discount zones (range zones) Phantom Oscillator (MA
FREE
Institutional QQE Oscillator (IQO) Description The Institutional QQE Oscillator (IQO) is a "momentum volatility" filter. Unlike a standard RSI which is jagged and noisy, the QQE uses a smoothing technique and a "Volatility Stop" mechanism (the yellow dotted line) on the RSI itself. Blue Line (Fast): The Smoothed RSI momentum. Yellow Dotted Line (Slow): The Volatility Threshold. Signal: When the Blue line crosses the Yellow line, it indicates a shift in true momentum, filtering out fake-outs. How
FREE
Candle Color RSI
Mahmoud Ahmed Abdou Ali
Candle color RSI (Relative Strength Index) indicators change candlestick colors on the price chart to visually show RSI conditions like overbought/oversold levels or bullish/bearish momentum, using colors like red for overbought/bearish and green for oversold/bullish, helping traders spot reversals or strength at a glance without looking at the separate RSI pane. These custom indicators often color candles red above 70 (overbought), green below 30 (oversold), and keep default colors in between
FREE
Here is the full professional description for your indicator, rebranded as Institutional Trend Candles (ITC) . You can use this text for your Market documentation, user manual, or simply to understand exactly how your tool functions. Institutional Trend Candles (ITC) v1.0 Overview Institutional Trend Candles (ITC) is a specialized trend-following system designed to filter out "retail noise" and visualize the true directional flow of the market. Built specifically for high-volatility assets like
FREE
Supply and Demand X
Mahmoud Ahmed Abdou Ali
Supply and demand in trading describes how buyer (demand) and seller (supply) actions set asset prices, with high demand/low supply raising prices (premium) and low demand/high supply lowering them (discount); traders identify these imbalances as "zones" on charts (e.g., Rally-Base-Rally for demand, Drop-Base-Drop for supply) to find potential entry/exit points, aiming to buy at discount demand zones and sell at premium supply zones, using volume and price action to confirm institutional acti
FREE
MA Ribbon
Mahmoud Ahmed Abdou Ali
The MA ribbon is not a single indicator but rather an overlay of multiple moving averages (typically four to eight or more) of varying lengths plotted on the same price chart.  Visual Appearance: The resulting lines create a flowing, ribbon-like pattern across the price chart. Components: Traders can use different types of moving averages, such as Simple Moving Averages (SMA) or Exponential Moving Averages (EMA), and adjust the time periods (e.g., 10, 20, 30, 40, 50, and 60 periods) to suit t
FREE
MM Ultimate Pro Analyzer v10.0 - USER GUIDEBASIC USAGEStep 1: Add to Chart Open any chart in MetaTrader 5 Go to Navigator → Indicators Find MM Ultimate Pro Analyzer Drag it onto your chart A settings window will appear Step 2: Configure for Your Timeframe Choose settings based on what you trade: Timeframe NumberOfCandles VolumeAveragePeriod M1-M5 (Scalping) 10-20 50 M15-M30 (Day Trading) 5-10 30 H1-H4 (Swing Trading) 3-7 20 D1+ (Position Trading) 3-5 14 Step 3: Understand the Button Bar At the t
Description The Institutional Cycle Filter (ICF) is a sophisticated trend-following tool that replaces standard moving averages with a "Signal Dot" system. It is designed to minimize lag while maintaining smoothness, making it highly effective for identifying trend reversals in volatile markets like Gold. How It Works (The Logic) Cosine Weighting: Unlike a Simple Moving Average (SMA) or Exponential Moving Average (EMA), this algorithm uses a Cosine function to calculate weights. This allows the
FREE
Accurate Signal Pro
Mahmoud Ahmed Abdou Ali
3 (2)
Accurate Signal ARC is a non-repainting trend & reversal signal indicator designed for MT4 . It uses ATR-weighted volatility logic combined with adaptive price channels to detect high-probability BUY and SELL points directly on the chart. How It Works Calculates a dynamic volatility channel using weighted ATR Detects trend direction (river state) and switches only when price decisively breaks the channel Filters noise using spread-aware true range Draws clear arrows : Lime Arrow → BUY si
FREE
Gann Square of Nine
Mahmoud Ahmed Abdou Ali
Here is the full technical and strategic description for the Gann Square of 9 indicator. Full Name Gann Square of 9 - Intraday Levels (v2.0) Overview This is a mathematical Support & Resistance indicator based on W.D. Gann's "Square of 9" theory. Unlike moving averages which lag behind price, this indicator is predictive . It calculates static price levels at the very beginning of the trading day (based on the Daily Open) and projects them forward. These levels act as a "road map" for the day,
FREE
The best eveR
Mahmoud Ahmed Abdou Ali
Indicator Name: "The Range Master" Core Purpose The Range Master is an advanced, multi-timeframe technical indicator designed to identify market consolidation (sideways ranging) and subsequent high-momentum breakout opportunities. It helps traders visually confirm when price action transitions from low-volatility accumulation to high-volatility trend initiation. ️ Functional Description (What it Does) The Range Master performs three primary, interconnected functions: Range Mapping , Breakout
FREE
Indicator: The DEMA MACD Zone Divergence This is a powerful, multi-timeframe trend-following indicator based on the Moving Average Convergence Divergence (MACD) , but enhanced using Double Exponential Moving Averages (DEMA) for reduced lag. Its main function is to paint the background of the price chart with color-coded rectangular zones, clearly signaling the current momentum phase and potential shifts in market control (bullish or bearish). Core Purpose To visually map the strength and phas
FREE
Footprint MT5
Mahmoud Ahmed Abdou Ali
Footprint charts in MetaTrader 5 (MT5) provide traders with a detailed view of market activity, allowing for better analysis of price movements and trading decisions. What is a Footprint Chart? A footprint chart is a specialized visualization tool that displays market data beyond traditional candlestick or bar charts. It reveals how volume was distributed at each price level within a specific time frame, often segmented by bid and ask activity. This level of detail helps traders understand the
Trading Simulator X
Mahmoud Ahmed Abdou Ali
TradePanel Pro Indicator Testing & Trading Simulator Core Purpose (Clear & Honest) TradePanel Pro is a manual trading simulator designed to test indicators, signals, and strategies in real market conditions — without relying on automated logic. You see the signal → you click → you evaluate the result . What TradePanel Pro Is (Correct Positioning) Manual BUY / SELL execution panel Layered entries (multi-order testing) Real-time TP / SL behavior Trailing stop simulation Profit /
Edge loophole detector
Mahmoud Ahmed Abdou Ali
Quantitative Session Breakout Profiler & Data Miner Executive Summary: The "London Hunter v18.0" is not merely a buy/sell signal indicator; it is a statistical data mining engine . Its core idea is that market openings (London, NY, Asia) are not random, but distinct "micro-regimes." By measuring the specific "physics" of price movement (speed, pullback, candle size) during these opening windows, the system identifies which specific conditions lead to successful breakouts and which lead to fakeou
Institutional Physics Engine (IPE) v4.20 Market Structure, Liquidity & Valuation Diagnostic System WHAT THIS TOOL IS Institutional Physics Engine (IPE) is a real-time market diagnostics indicator that analyzes price using behavioral physics, liquidity response, supply & demand pressure, and equilibrium valuation. It does not predict price and does not generate blind buy/sell signals. Instead, it answers three professional trading questions: Where is fair value right now? Who is in con
Universal Strategy Validator: Turn Any Indicator into a Backtested Strategy Headline: Stop guessing if an indicator works. See the win rate, profit factor, and drawdown instantly—without writing a single line of code. Overview: The Universal Strategy Validator (USV) is a powerful analytical engine that connects to any MetaTrader 5 indicator. It reads the signal buffers (arrows, lines, or histograms) and runs a real-time simulation across historical data. It applies professional-grade filtering,
Candle Density Boxes
Mahmoud Ahmed Abdou Ali
Candle Density Boxes Indicator  Summary The Candle Density Boxes (CDB) indicator is an algorithmic tool that identifies price zones where candles cluster with high frequency. Through empirical analysis, we demonstrate that these zones exhibit statistically significant mean-reversion properties, with return frequencies ranging from 76–80% across multiple instruments. Key Findings: Zones with 6+ candle touches show 90%+ return probability Rank-based hierarchy provides clear reliability classifica
Summary (What Changed & Why It Matters) Traditional FVG indicators suffer from three structural flaws : Detection and mitigation are coupled Wicks and bodies are treated identically Partial mitigation is not preserved This indicator introduces a new FVG model where: Detection ≠ Mitigation Wick interaction ≠ Body acceptance FVGs decay progressively , not instantly This transforms FVGs from a static drawing tool into a dynamic price-acceptance model .
3D Intensity Balls with Volume Boost Indicator v1.4 A sophisticated MetaTrader 5 custom indicator that visualizes price-level trading intensity using dynamically-sized, photorealistic 3D spheres rendered on the chart canvas, enhanced with volume-based scaling and advanced visual effects. Core Functionality Price Distribution Analysis: Divides each candle's price range into configurable levels (default: 50) Samples tick data to measure time-at-price (price dwell intensity) Visualizes concentra
All Symbols monitoring
Mahmoud Ahmed Abdou Ali
# All Trading Symbols Monitoring ## Version 9.43 | MT5 Indicator (Dual Mode) > An advanced multi-symbol trading monitor that watches all available broker symbols simultaneously, detects breakout opportunities, scores signal quality, and manages both paper and live trades - all displayed in a live on-chart dashboard. --- ## What This Tool Does - [ All Trading Symbols Monitoring ]( #all-trading-symbols-monitoring )   - [ Version 9.43 | MT5 Indicator (Dual Mode) ]( #version-943--mt5-indicator-
Lux Algo
Mahmoud Ahmed Abdou Ali
This system is a Self-Optimizing Algorithmic Framework . Unlike static indicators, it uses a Recursive Feedback Loop to "learn" the current market regime and adjust its sensitivity in real-time. Because it calculates every step based solely on current and past data, it is a Real-Time Model with no repainting, no bias, and no lookahead. How the "AI" Operates Performance-Based Learning: The system constantly "grades" its own accuracy. If the market is trending cleanly, it increases its sensitivit
VolumeProfilePerCandle v4.4 This is a comprehensive per-candle volume profile / footprint chart indicator for MetaTrader 5, rendered entirely via a canvas overlay (CCanvas). It's a single-file, zero-buffer indicator that draws directly onto the chart window using pixel-level graphics. Here's a complete breakdown: Core Concept For every visible candle, the indicator divides the bar's price range into configurable price levels (up to 50) and counts how much trading activity occurred at each level
Filtro:
Sem comentários
Responder ao comentário