VSA Text Indicator MT5
- Indicadores
- Eda Kaya
- Versão: 2.1
VSA Text Indicator MetaTrader 5
The VSA Text Indicator on the MetaTrader 5 platform is built on the "Volume Spread Analysis" (VSA) methodology. It is designed for the simultaneous analysis of trading volume and candlestick behavior. This tool is developed to detect smart money activity by providing accurate, text-based signals directly on the chart, helping traders identify key market entry and exit points.
«Indicator Installation & User Guide»
MT5 Indicator Installation | VSA Text Indicator MT4 | ALL Products By TradingFinderLab | Best MT5 Indicator: Refined Order Block Indicator for MT5 | Best MT5 Utility: Trade Assistant Expert TF MT5 | TP & SL Tool: Risk Reward Ratio Calculator RRR MT5 | Prop Firm Protector: Trade Assist Prop Firm Plus TF Expert MT5 | Money Management + DrawDown Protector: Trade Panel Prop Firm Drawdawn Limiter Pro MT5
VSA Text Indicator Specifications
| Category | ICT – Signal & Forecast – Smart Money |
| Platform | MetaTrader 5 |
| Skill Level | Intermediate |
| Indicator Type | Continuation – Reversal |
| Time Frame | Multi-Time Frame |
| Trading Style | Intraday Trading |
| Market | All Markets |
Overview of the Indicator
The Volume Spread Analysis (VSA) Text Indicator analyzes candlestick behavior in conjunction with trading volume to accurately detect supply and demand pressure in the market. It displays these insights as text signals directly on the chart, with each signal representing a specific market condition:
- Upthrust – A failed attempt to break through resistance
- No Demand Bar – Weak buying interest accompanied by low volume
- Stopping Volume – Increased volume halting a downtrend
- Reverse Upthrust – Buying reaction at a support level
- No Supply Bar – Lack of selling pressure near market bottoms
- Effort to Move Up – A bullish move supported by strong volume
- Effort to Move Down – A bearish move driven by high selling volume
Uptrend Conditions
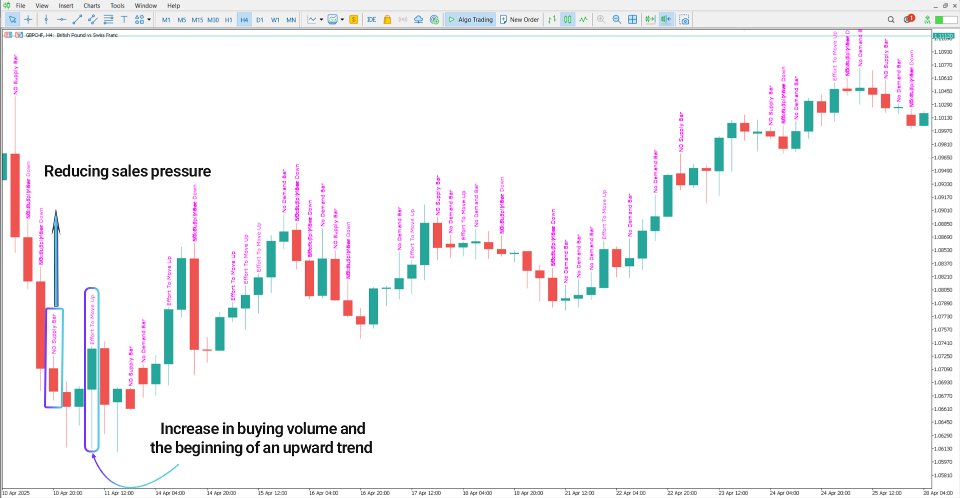
The chart below displays the 4-hour timeframe of the GBP/CHF currency pair. At the end of a downtrend, a rise in volume along with increasing prices and the appearance of the "Effort to Move Up" signal indicate growing buyer pressure and suggest a potential trend reversal.
Downtrend Conditions
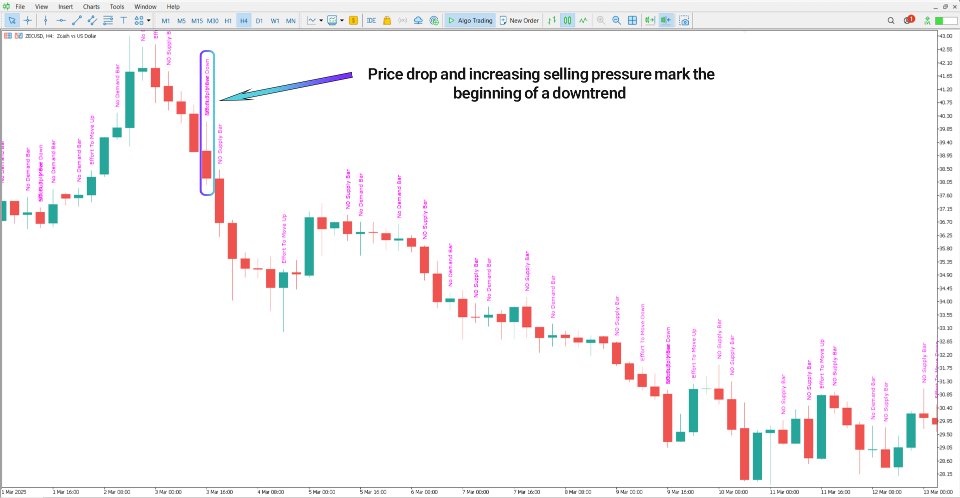
The 4-hour chart of the Zcash (ZEC/USD) cryptocurrency illustrates a clear downtrend. In this case, the “Effort to Move Down” signal, coupled with a price decline and rising volume, confirms strong selling pressure and presents a potential short trade opportunity.
VSA Text Indicator Settings
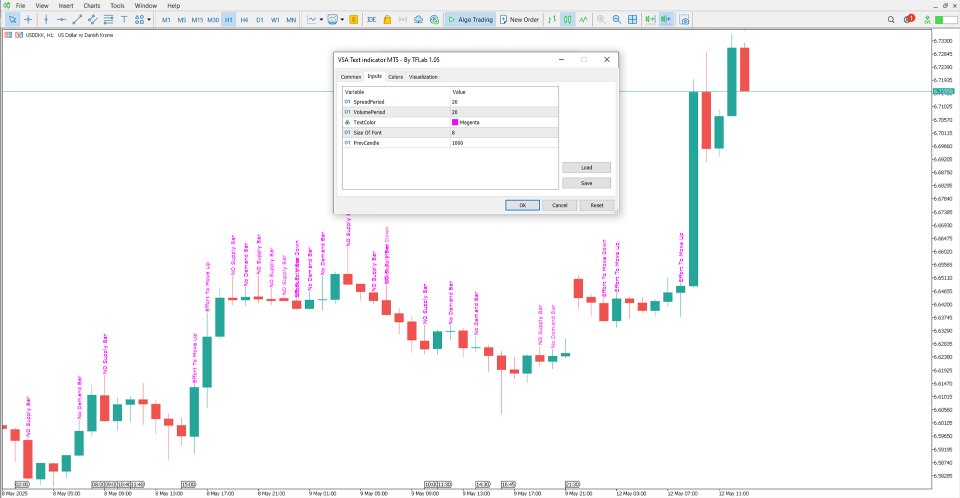
The customizable settings panel of the VSA Text Indicator includes the following options:
- Spread Period – Number of candles used to evaluate candle spread
- Volume Period – Number of candles analyzed for trading volume
- Text Color – Color of the signal text displayed on the chart
- Size of Font – Font size used for chart annotations
- Prev Candle – Reference candle for generating signals
Conclusion
The VSA Text Indicator is based on the principles of volume-price analysis in technical trading. By evaluating both volume and candle closing behavior simultaneously, it generates signals such as Upthrust, No Demand, and Effort to Move Up, and displays them directly on the chart in an easy-to-read text format.
