Support Resistance Peaks Indicator
- Indicadores
- Versão: 1.40
- Atualizado: 22 setembro 2022
- Ativações: 5

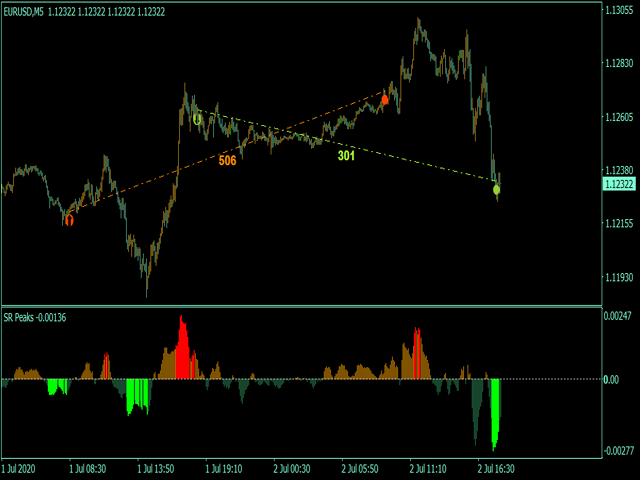
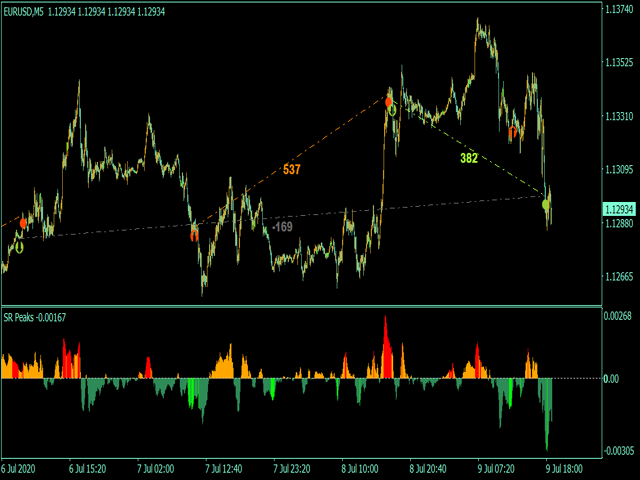
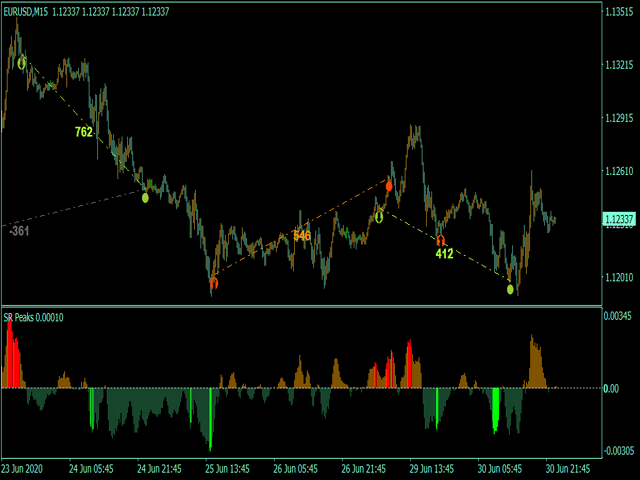
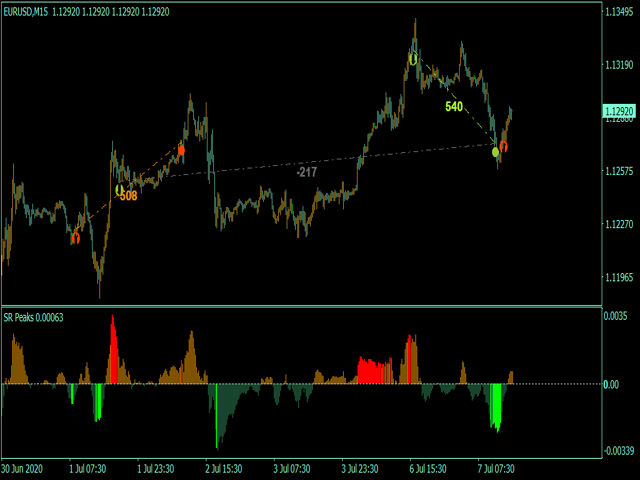
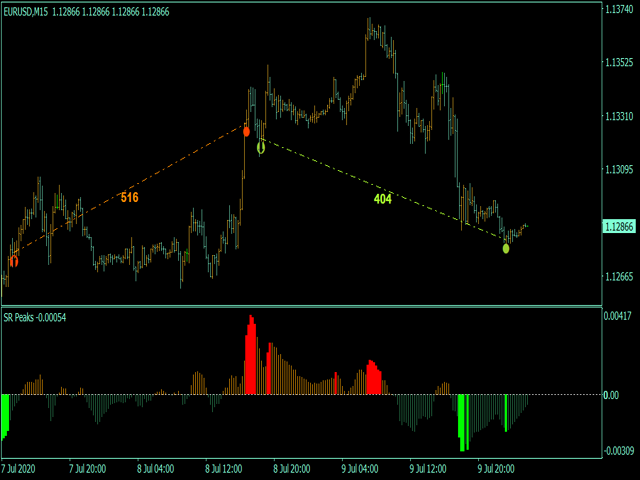
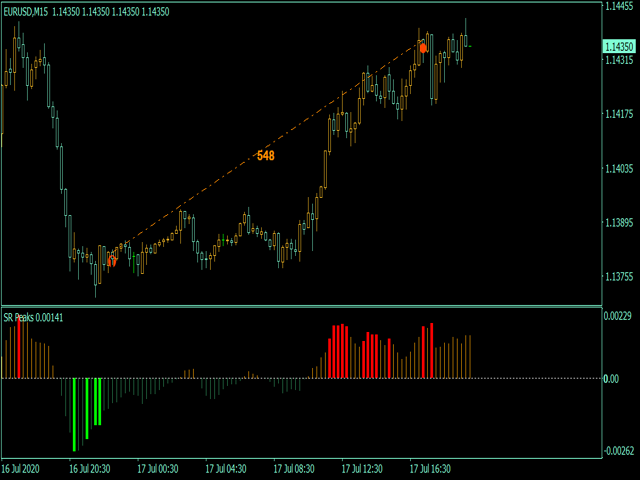
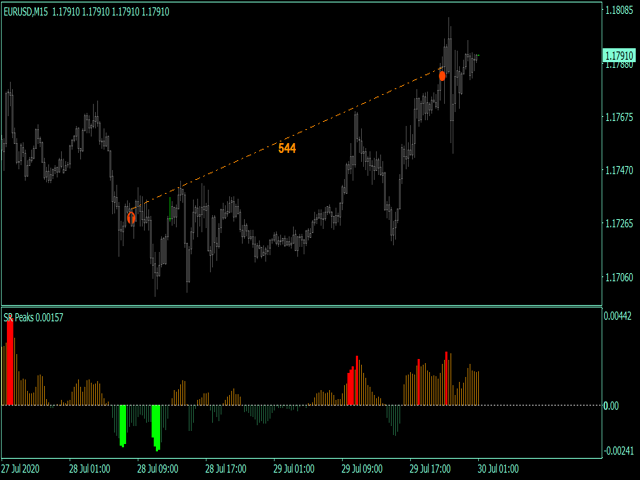
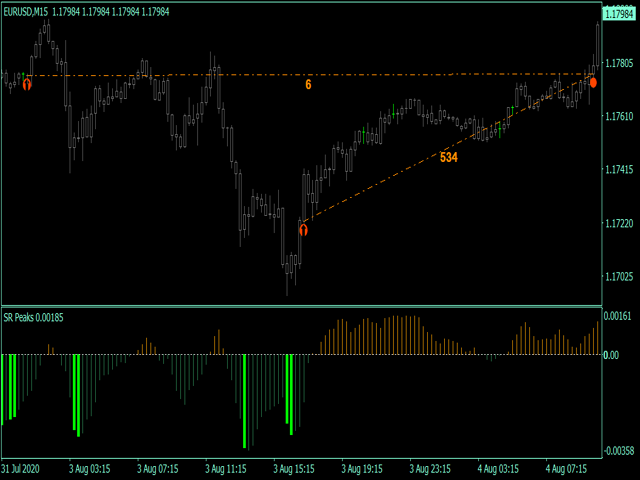
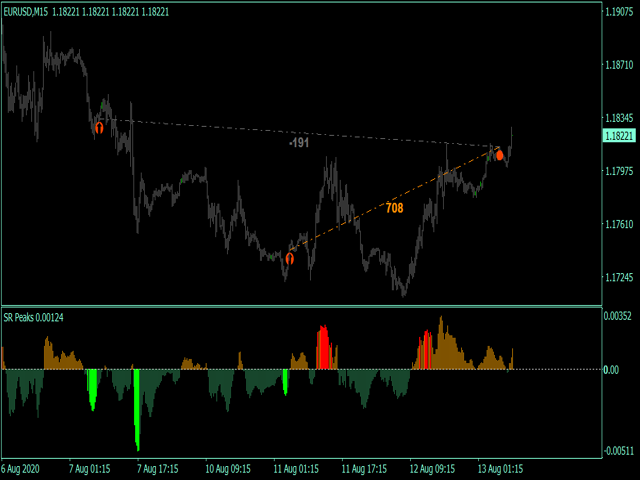
SupportResistancePeaks Indicator indicator - is the combination of dynamic support/resitance and price action pattern. As a rule support/resistance indicators uses already calculated, history levels. The most disadvantage of this method - new(incomming) levels always are not the same as were on history, in other words accuracy is not so high as expected. My indicator is looking for dynamic/live levels that are forming right now after trend lost it's power and choppy market starts. As a rule exactly this place becomes new support/resistance level. And we can plot and order. After few time starts new trend, my indicator allows to take avail position and stand up market noise. Indicator represents full trading system with enter & exit points.
Main Indicator's Features
- Signals are not repaint,non-late or disappear(exept cases when system recalculates all history datas,refreshing main settings);
- Every signal comes at the open of new bar(system uses only confirmed signals);
- Indicator has Alerts, Mail and Push notifications(allow to trade out of PC, from smartphone/mobile app);
- System is 100% autoadaptive no need manual adjusting. Just set up and start trading.
Recommendations for trading
- M1,M5, M15 timeframes, for long-term trading - 1hour;
- EURUSD,GBPUSD,USDCAD,GBPJPY, All Crypto;