Divergence of Correlation

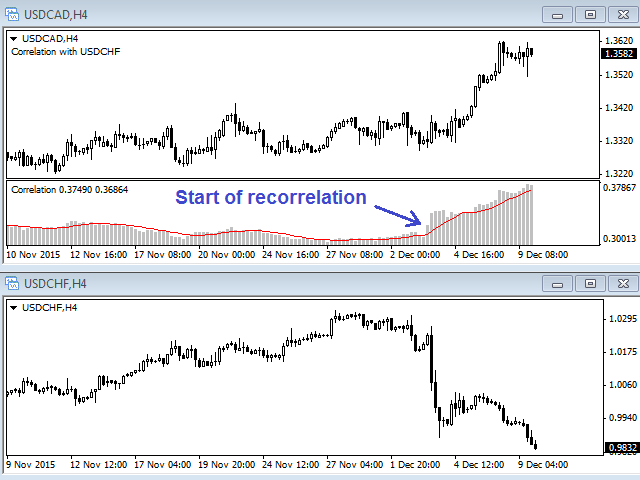
This is an indicator of trading instruments' correlation. It shows the difference of price values of two symbols.

The increase in price divergence and the reduction of price divergence can be seen as signals to transactions. The indicator can be used for hedge strategies.

The indicator sends Alerts and Push-notifications to the mobile app about the crossing of the moving averages of Envelopes.

The indicator has a simple setup. You need to put him in the window of the traded instrument and choose settings:

  • Correlated_Symbol - select the trading instrument, for which the difference of the correlation is to be calculated (symbol name is entered manually).
  • Reverse - switch on inverse correlation.
  • SignalSMA - select a period of the signal simple moving average.
  • Envelopes_Period - selecting the period of signal simple moving averages of Envelopes.
  • Envelopes_Deviation - percentage of moving Envelopes offset from the average value.
  • Alerts_of_crossing_Envelopes - enable notifications.


Produtos recomendados
The indicator detects and displays Shark harmonic pattern (see the screenshot). The pattern is plotted by the extreme values of the ZigZag indicator (included in the resources, no need to install). After detecting the pattern, the indicator notifies of that by a pop-up window, a mobile notification and an email. The indicator highlights the process of the pattern formation and not just the complete pattern. In the former case, it is displayed in the contour triangles. After the pattern is comple
Wise Men Indicator demo
Bohdan Kasyanenko
3 (2)
The indicator displays signals according to the strategy of Bill Williams on the chart. Demo version of the indicator has the same features as the paid, except that it can work only on a demo account . Signal "First Wise Man" is formed when there is a divergent bar with angulation.  Bullish divergent bar - with lower minimum and closing price in the upper half. Bearish divergent bar - higher maximum and the closing price at the bottom half. Angulation is formed when all three lines of Alligator
FREE
Alpha Trend sign has been a very popular trading tool in our company for a long time. It can verify our trading system and clearly indicate trading signals, and the signals will not drift. Main functions: Based on the market display of active areas, indicators can be used to intuitively determine whether the current market trend belongs to a trend market or a volatile market. And enter the market according to the indicator arrows, with green arrows indicating buy and red arrows indicating se
Ppr PA
Yury Emeliyanov
4.75 (4)
"Ppr PA" is a unique technical indicator created to identify "PPR" patterns on the currency charts of the MT4 trading platform. These patterns can indicate possible reversals or continuation of the trend, providing traders with valuable signals to enter the market. Features: Automatic PPR Detection:   The indicator automatically identifies and marks PPR patterns with arrows on the chart. Visual Signals:   Green and red arrows indicate the optimal points for buying and selling, respectively. Ar
FREE
O indicador Crypto_Forex "Auto FIBO Pro" é uma ótima ferramenta auxiliar na negociação! - O indicador calcula e coloca automaticamente no gráfico os níveis de Fibonacci e as linhas de tendência locais (cor vermelha). - Os níveis de Fibonacci indicam áreas-chave onde o preço pode reverter. - Os níveis mais importantes são 23,6%, 38,2%, 50% e 61,8%. - Pode utilizá-lo para scalping de reversão ou para negociação de grelha de zona. - Existem muitas oportunidades para melhorar o seu sistema atual u
Indicador Balance of Power (BOP) com suporte multi-timeframe, sinais visuais personalizáveis e sistema de alertas configurável. Serviços de programação freelance, atualizações e outros produtos TrueTL estão disponíveis no meu perfil MQL5 . Feedbacks e avaliações são muito apreciados! O que é o BOP? Balance of Power (BOP) é um oscilador que mede a força dos compradores em relação aos vendedores comparando a variação do preço com o range da vela. O indicador é calculado como (Fechamento - Abert
FREE
Indicador Average True Range (ATR) com suporte multi-timeframe, sinais visuais personalizáveis e sistema de alertas configurável. Serviços de programação freelance, atualizações e outros produtos TrueTL estão disponíveis no meu perfil MQL5 . Feedbacks e avaliações são muito apreciados! O que é o ATR? O Average True Range (ATR), desenvolvido por J. Welles Wilder, é um indicador técnico que mede a volatilidade do mercado. Ele calcula a média do True Range durante um período especificado. O True
FREE
This indicator scans for you up to 30 trading instruments and up to 8 timeframes for occurrences of the high probability reversal patterns: Double Tops/Bottoms with fake breakouts . Please read also the blog post " Professional Trading With Double Tops/Bottoms And Divergences! " which explains the concepts behind the ULTIMATE Double Top/Bottom indicator and how you can use a professional top-down approach. This FREE Version of the Scanner scans only EURUSD and GBPUSD. The full version of the sca
FREE
This scanner shows the trend values based on crossovers of two moving averages for up to 30 instruments and 8 time frames. You can get alerts via MT4, Email and Push-Notification as soon as the direction of the trend changes. This is the FREE version of the indicator: https://www.mql5.com/en/market/product/29159 Important Information How you can maximize the potential of the scanner, please read here: www.mql5.com/en/blogs/post/718074 You have many possibilities to use the scanner. Here are tw
FREE
Trend Ray
Andriy Sydoruk
The indicator shows the potential trend direction by cyclical-wave dependence. Thus, all the rays of the intersection will be optimal rays, in the direction of which the price is expected to move, taking into account the indicator period. Rays can be used as a direction for potential market movement. But we must not forget that the approach must be comprehensive, the indicator signals require additional information to enter the market.
UPD1 Rsi Dots Dashboard
Vitaliy Kuznetsov
5 (2)
O indicador mostra sinais baseados no oscilador RSI terminal no gráfico. É possível filtrar sinais repetidos. Aqui, o oscilador é usado para procurar um sinal reverso. É recomendado como um ponto de entrada em estratégias de swing e negociação a partir de níveis. Um painel multi-moeda está disponível. Com ele, você pode alternar facilmente entre os gráficos. Nas discussões de produtos, você pode sugerir um algoritmo no qual pode incorporar um painel. Parametro. Configurações Principais. Bar
FREE
The indicator detects and displays 3 Drives harmonic pattern (see the screenshot). The pattern is plotted by the extreme values of the ZigZag indicator (included in the resources, no need to install). After detecting the pattern, the indicator notifies of that by a pop-up window, a mobile notification and an email. The indicator highlights the process of the pattern formation and not just the complete pattern. In the former case, it is displayed in the contour triangles. After the pattern is com
Take Your Trading Experience To the   Next Level ! and get the Magic Bollinger Bands Diamond Indicator MagicBB Diamond Indicator is MT4 Indicator which can suggest signals for you while on MT4. The indicator is created with Non Lag Bollinger Bands strategy for the best entries. This is a system to target 10 to 20 pips per trade. The indicator will give alerts on the pair where signal was originated including timeframe. If signal sent, you then enter your trade and set the recommended pips target
WAD Stoch
Yonny Pascal Ekwa Mezui
WAD Divergence + Stochastic Overview WAD Divergence + Stochastic is a technical indicator designed to assist traders in identifying potential market turning points. It combines price behavior with momentum confirmation to highlight areas where buying or selling pressure may be shifting. The indicator works directly on the chart and provides clear visual signals to support decision-making in fast-moving markets. How It Works The indicator analyzes the relationship between price movement and inte
FREE
RSI TrendLine Divergency Message is an indicator for the MetaTrader 4 trading platform. Unlike the original indicator, this three in one version has a system of alerts that inform on market situation changes. It consists of the following signals: when the Main line crosses the levels of extreme zones and 50% level; when the Main line crosses the Trend line in the indicator window; divergence on the last bar. Parameters of levels of extremum, 50-level and divergence are adjustable. Parameters La
FlatBreakout
Aleksei Vorontsov
FlatBreakout (Free Version) Flat Range Detector and Breakout Panel for MT4 — GBPUSD Only FlatBreakout is the free version of the professional FlatBreakoutPro indicator, specially designed for flat (range) detection and breakout signals on the GBPUSD pair only. Perfect for traders who want to experience the unique fractal logic of FlatBreakout and test breakout signals on a live market without limitations. Who Is This Product For? For traders who prefer to trade breakout of flat ranges (breakout,
FREE
YOU CAN NOW DOWNLOAD FREE VERSIONS OF OUR PAID INDICATORS . IT'S OUR WAY OF GIVING BACK TO THE COMMUNITY ! >>>    GO HERE TO DOWNLOAD V1 Scalper is an easy to use tool designed for trend scalping. It tries to spot good entry points in a major trend by using swing high and lows formed along the trend . This tool can be used on Fx Pairs , Indices , Commodities and stocks. Not often  but in some signals , the arrow might repaint on the current candle so extra confirmation tools are advised for tr
FREE
Trend PA
Mikhail Nazarenko
5 (3)
The Trend PA indicator uses   Price Action   and its own filtering algorithm to determine the trend. This approach helps to accurately determine entry points and the current trend on any timeframe. The indicator uses its own algorithm for analyzing price changes and Price Action. Which gives you the advantage of recognizing, without delay, a new nascent trend with fewer false positives. Trend filtering conditions can be selected in the settings individually for your trading style. The indicator
OrderBlock TS Roman
Vladislav Vlastovskii
3.8 (5)
Индикатор строит блоки заказов (БЗ) по торговой системе (ТС) Романа. Поиск блоков осуществляется одновременно на двух таймфремах: текущем и старшем (определяемым в настройках). Для оптимизации и игнорирования устаревших блоков в настройках задается ограничение количества дней в пределах которых осуществляется поиск блоков. Блоки строятся по правилам ТС состоящем из трех шагов: какую свечу вынесли (что?); какой свечой вынесли (чем?); правило отрисовки (как?).
FREE
Extremum Reverse Bar
Yurij Izyumov
2.8 (5)
This indicator has been created for finding the probable reversal points of the symbol price. A small candlestick reversal pattern is used it its operation in conjunction with a filter of extremums. The indicator is not redrawn! If the extremum filter is disabled, the indicator shows all points that have a pattern. If the extremum filter is enabled, the condition works – if the history Previous bars 1 candles back contains higher candles and they are farther than the Previous bars 2 candle, such
FREE
Auto Fibonacci displays the 38.2, 61.8, and 78.6 Fib levels directly on the chart, helping traders who use these key retracement zones consistently for trade planning or confluence. Drawing Fibonacci levels manually over and over again can take time, especially when done with wick-to-wick precision. Auto Fibonacci removes that friction by detecting the latest trend leg and placing the main Fibonacci levels automatically. Key Benefits Shows only the major Fibonacci levels to keep the chart clean
FREE
O Pivot Point Fibo RSJ é um indicador que traça as linhas de suporte e resistência do dia usando as proporções   de Fibonacci. Este indicador espetacular cria até 7 níveis de suporte e resistência por meio do Pivot Point usando proporções de Fibonacci. É fantástico como os preços respeitam cada nível deste suporte e resistência, onde é possível perceber possíveis pontos de entrada / saída de uma operação. Recursos Até 7 níveis de suporte e 7 níveis de resistência Defina as cores dos níveis indi
FREE
MACDivergence MTF
Pavel Zamoshnikov
4.29 (7)
Advanced ideas of the popular MACD indicator: It detects and displays classic and reverse divergences (three methods of detecting divergences). It uses different color to highlight an uptrend and a downtrend. Two methods of determining a trend: а) MACD crosses the 0 level (classic signal); б) MACD crosses its own average (early signal). This is a multi-timeframe indicator: it can display MACD data from other timeframes. Two methods of drawing: classic histogram and line. It generates sound and v
Quantum Falcon Signal Free is a smart visual trading indicator for MetaTrader 4 designed for Forex and Gold traders. The indicator combines: • Trend analysis • RSI momentum confirmation • MACD momentum filtering • ATR volatility filtering • Higher timeframe confirmation • Smart exit signal detection Main Features: • Smart Buy and Sell signals • Exit Buy / Exit Sell alerts • Real-time dashboard on chart • Professional candle arrows • Multi-timeframe trend confirmation • ATR market volatility filt
FREE
This indicator is a perfect tool able to compare which brokers have the lower latency. It shows us immediately which brokers are slower or faster. When you see the dot icon on the line, it means this broker is the faster one and the red line (Broker_A) is the slower one. See the example on the screenshot. How It Works? This indicator shares the prices information to and from the "shared" common data folder. It compares all the prices. The price is based on average by (Ask + Bid) / 2. There are
FREE
PZ Pivot Points
PZ TRADING SLU
4.6 (10)
This indicator displays pivot points in the chart, including historical vales, and supports many calculation modes for Pivot Points and S/R levels. [ Installation Guide | Update Guide | Troubleshooting | FAQ | All Products  |  Get Help ] It plots historical levels for backtesting purposes It allows you to select the reference timeframe It implements different Pivot Point calculation modes It implements different SR calculation modes It implements customizable colors and sizes Calculation Mode
FREE
Price Magnet — Price Density and Attraction Levels Indicator Price Magnet is a professional analytical tool designed to identify key support and resistance levels based on statistical Price Density. The indicator analyzes a specified historical period and detects price levels where the market spent the most time. These zones act as “magnets,” attracting price action or forming a structural base for potential reversals. Unlike traditional Volume Profile tools, Price Magnet focuses on price-time d
.....................................hi....................... ................for showing high s and low s and support and resistanses .....................we have a lot of ways............................... it can be helpful for finding trends , higher highs , higher lows , lower highs , lower lows .......................today i write on of thems.......................... ........................you can enter the number of last support and resistanses .........................and it will dra
FREE
Padrões Harmônicos são mais bem utilizados para prever pontos de virada no mercado. Esses padrões oferecem uma alta taxa de vitória e diversas oportunidades de negociação em um único dia de negociação. Nosso indicador identifica os Padrões Harmônicos mais populares com base nos princípios descritos na literatura de Negociação Harmônica. NOTAS IMPORTANTES: O indicador não repinta, não atrasa (detecta um padrão no ponto D) e não REDRAW (o padrão é válido ou cancelado). COMO USAR: Arraste e solte o
FREE
This indicator shows the latest untouched support and resistance as horizontal lines. The indicator can show support/resistance from higher timeframes. With this indicator you can e.g. easily see the support/resistance of the timeframes H4, D1 and W1 on a H1 chart, which can be a big advantage while time your entry on H1. This is the FREE version of the indicator: Support Resistance Multi Time Frame The free version works only on EURUSD and GBPUSD! Parameters referenceTF: the timeframe from whi
FREE
Os compradores deste produto também adquirem
Genesis Matrix Pro is a professional multi-timeframe trend detection indicator designed to help traders identify high-quality market alignment with clarity and structure. It combines 12 different technical indicators into one visual alignment matrix, allowing traders to quickly see when market conditions are bullish, bearish, or neutral. A signal is generated only when the selected strategies are aligned, helping reduce noise and improve decision-making. PLEASE CONTACT ME AFTER PURCHASE TO GET
Gann Made Easy
Oleg Rodin
4.83 (163)
Gann Made Easy é um sistema de negociação Forex profissional e fácil de usar, baseado nos melhores princípios de negociação usando a teoria do sr. W. D. Gann. O indicador fornece sinais precisos de COMPRA e VENDA, incluindo níveis de Stop Loss e Take Profit. Você pode negociar mesmo em movimento usando notificações PUSH. Entre em contato comigo após a compra para receber instruções de negociação e ótimos indicadores extras gratuitamente! Provavelmente você já ouviu muitas vezes sobre os métodos
The Propfolio Master Suite is the ultimate all-in-one analytical workstation for professional traders. Combining the power of the Beat The Market Maker (BTMM) methodology, Smart Money Concepts (SND/Liquidity), and Advanced Volume Profile, this suite replaces multiple different indicators with one optimized engine. Monitor up to 14 pairs simultaneously from a single chart, instantly identify market cycles, and seamlessly map institutional footprints with the click of a button. The Command Center
Scalper Inside PRO
Alexey Minkov
4.74 (69)
Scalper Inside PRO Scalper Inside PRO is an intraday trend and scalping indicator for MetaTrader 4 that uses an exclusive algorithm to quickly detect market direction and key target levels. It automatically calculates entry, exit and multiple profit targets, and shows detailed performance statistics so you can see how different instruments and strategies performed. This helps you choose the most suitable trading instruments for the current market conditions. Additionally, you can easily integrat
M1 Sniper
Oleg Rodin
5 (23)
O M1 SNIPER é um sistema indicador de negociação fácil de usar. É um indicador de seta projetado para o período M1. O indicador pode ser usado como um sistema independente para scalping no período M1 e pode ser usado como parte do seu sistema de negociação existente. Embora este sistema de negociação tenha sido projetado especificamente para negociação no M1, ele também pode ser usado em outros períodos. Originalmente, desenvolvi este método para negociar XAUUSD e BTCUSD. Mas considero-o útil ta
O sistema PRO Renko é um sistema de negociação altamente preciso especialmente concebido para a negociação de gráficos RENKO. Trata-se de um sistema universal que pode ser aplicado a vários instrumentos de negociação. O sistema neutraliza eficazmente o chamado ruído de mercado, dando-lhe acesso a sinais de inversão precisos. O indicador é muito fácil de usar e tem apenas um parâmetro responsável pela geração de sinal. Você pode facilmente adaptar a ferramenta a qualquer instrumento de negocia
Auto Optimized Parabolic RSI: Avançado Motor de Momentum 3D A maioria dos indicadores de varejo falha porque depende de parâmetros estáticos que quebram no momento em que a volatilidade do mercado muda. O Auto Optimized Parabolic RSI resolve o problema de "obsolescência do indicador" recalculando continuamente a sua própria vantagem matemática, trazendo uma adaptação quantitativa de nível institucional diretamente para o seu terminal MT5. A Vantagem Principal: Otimização 3D em Memória Personaliz
NAM Order Blocks
NAM TECH GROUP, CORP.
3.67 (3)
Indicador de detecção de blocos de pedidos de multi-timeframe MT4. Características - Totalmente personalizável no painel de controle do gráfico, fornece interação completa. - Oculte e mostre o painel de controle onde quiser. - Detectar OBs em vários períodos de tempo. - Selecione a quantidade de OBs para exibir. - Interface de usuário de OBs diferente. - Filtros diferentes em OBs. - Alerta de proximidade OB. - Linhas ADR de alta e baixa. - Serviço de notificação (alertas de tela | not
Quants HL Break
Ferhat Mutlu
5 (2)
Cálculo avançado feito por pura ação de preço para encontrar breakouts LH e HL. Isso lhe dará ótimos pontos de reversão no mercado. Os sinais LH e HL também podem ser usados ​​para os rompimentos do traingle. Uma vez que o rompimento acontece, ele indica uma forte reversão. Bom filtro para médias móveis. Eu sugiro usar isso com indicadores de tendência. Pode ser usado como uma confirmação extra para suporte e resistência, indicadores de oferta e demanda. Mais detalhes podem ser encontrados no
Dynamic Forex28 Navigator
Bernhard Schweigert
4.43 (7)
Dynamic Forex28 Navigator - A ferramenta de negociação Forex de última geração. ATUALMENTE 49% DE DESCONTO. Dynamic Forex28 Navigator é a evolução dos nossos indicadores populares de longa data, combinando o poder de três em um: Indicador Advanced Currency Strength28 (695 avaliações) + Advanced Currency IMPULSE com ALERTA (520 avaliações) + Sinais CS28 Combo (Bônus). Detalhes sobre o indicador https://www.mql5.com/en/blogs/post/758844 O que o Next-Generation Strength Indicator oferece?  Tudo
PZ Harmonacci Patterns
PZ TRADING SLU
3.17 (6)
Este é sem dúvida o indicador de reconhecimento automático de formação de preço harmônico mais completo que você pode encontrar para a MetaTrader Platform. Ele detecta 19 padrões diferentes, leva as projeções de Fibonacci tão a sério quanto você, exibe a Zona de Reversão Potencial (PRZ) e encontra níveis adequados de stop loss e take-profit. [ Guia de instalação | Guia de atualização | Solução de problemas | FAQ | Todos os produtos ] Detecta 19 formações harmônicas de preços diferentes Traça
RFI levels PRO
Roman Podpora
5 (1)
O indicador mostra com precisão os pontos de reversão e as zonas de retorno de preço onde o   Principais players . Você identifica onde novas tendências estão se formando e toma decisões com máxima precisão, mantendo o controle sobre cada negociação. VERSION MT5     -     Revela seu potencial máximo quando combinado com o indicador   TREND LINES PRO. O que o indicador mostra: Estruturas de reversão e níveis de reversão com ativação no início de uma nova tendência. Exibição dos níveis de   TAKE
Trend Catcher ind
Ramil Minniakhmetov
INDICADOR TREND CATCHER O Indicador Trend Catcher analisa os movimentos de preços do mercado, utilizando uma combinação de indicadores de análise de tendências adaptativos, proprietários e personalizados pelo autor. Identifica a verdadeira direção do mercado, filtrando o ruído de curto prazo e focando a força do momentum subjacente, a expansão da volatilidade e o comportamento da estrutura de preços. Utiliza também uma combinação de indicadores personalizados de suavização e filtragem de tendê
O Apollo SR Master é um indicador de Suporte/Resistência com recursos especiais que tornam a negociação com zonas de Suporte/Resistência mais fácil e confiável. O indicador calcula as zonas de Suporte/Resistência em tempo real, sem qualquer atraso, detectando topos e fundos de preço locais. Em seguida, para confirmar a área de Suporte/Resistência recém-formada, o indicador exibe um sinal especial que indica que a zona pode ser considerada e usada como um sinal de VENDA ou COMPRA. Nesse caso, a f
Grabber System
Ihor Otkydach
5 (2)
Apresento a você um excelente indicador técnico: Grabber, que funciona como uma estratégia de trading “tudo incluído”, pronta para usar. Em um único código estão integradas ferramentas poderosas de análise técnica de mercado, sinais de entrada (setas), funções de alertas e notificações push. Cada comprador deste indicador também recebe gratuitamente: Utilitário Grabber: ferramenta para gerenciamento automático de ordens abertas Vídeo tutorial passo a passo: como instalar, configurar e operar com
Day Trader Master é um sistema de negociação completo para day traders. O sistema é composto por dois indicadores. Um indicador é um sinal de seta para comprar e vender. É o indicador de seta que você obtém. Eu fornecerei o segundo indicador gratuitamente. O segundo indicador é um indicador de tendência especialmente projetado para ser usado em conjunto com essas setas. OS INDICADORES NÃO SE REPETEM E NÃO SE ATRASAM! A utilização deste sistema é muito simples. Você só precisa seguir os sinais de
Sinal de tendência GoldRush Arrow O indicador Sinal de tendência GoldRush Arrow fornece uma análise precisa e em tempo real das tendências, adaptada para scalpers de alta velocidade e curto prazo em XAU/USD. Criada especificamente para o intervalo de tempo de 1 minuto, esta ferramenta exibe setas direcionais para pontos de entrada claros, permitindo que os scalpers naveguem em condições de mercado voláteis com confiança. O indicador consiste em setas de alerta PRIMÁRIAS e SECUNDÁRIAS. Os sin
Introduction to Fractal Pattern Scanner Fractal Indicator refers to the technical indicator that makes use of the fractal geometry found in the financial market. Fractal Pattern Scanner is the advanced Fractal Indicator that brings the latest trading technology after the extensive research and development work in the fractal geometry in the financial market. The most important feature in Fractal Pattern Scanner is the ability to measure the turning point probability as well as the trend probabi
ACTUALMENTE COM 40% DE DESCONTO A melhor solução para qualquer novato ou comerciante especializado! Este Indicador é uma ferramenta comercial única, de alta qualidade e acessível, porque incorporámos uma série de características proprietárias e uma nova fórmula. Com apenas UM gráfico, pode ler a força da moeda para 28 pares de Forex! Imagine como a sua negociação irá melhorar porque é capaz de apontar o ponto exacto do gatilho de uma nova tendência ou oportunidade de escalada? Manual do util
Advanced Supply Demand
Bernhard Schweigert
4.91 (300)
Atualmente com 40% de desconto! A melhor solução para qualquer Trader Novato ou especialista! Este indicador é uma ferramenta de negociação exclusiva, de alta qualidade e acessível porque incorporamos uma série de recursos proprietários e uma nova fórmula. Com esta atualização, você poderá mostrar fusos horários duplos. Você não só será capaz de mostrar um TF mais alto, mas também mostrar ambos, o TF do gráfico, MAIS o TF mais alto: MOSTRANDO ZONAS ANINHADAS. Todos os traders de Oferta e Demanda
Market Structure Patterns MT4
Samuel Manoel De Souza
5 (18)
Market Structure Patterns   é um indicador baseado em   smart money concepts   que apresenta elementos de   SMC/ICT   capazes de elevar suas decisões de negociação a um novo patamar. Aproveite os   alertas ,   notificações   push   e   mensagens  por  e-mail   para ser informado sobre quando um elemento se forma no gráfico, o preço cruza um nível e/ou entra em uma região delimitada por uma retângulo. Desenvolvedores podem acessar valores dos elementos do indicador por meio de   variáveis globais
Advanced UT BOT ALERTS for MT4 Sistema profissional de detecção de tendência com múltiplos filtros | Motor UT BOT aprimorado Nós fornecemos apenas indicadores de alta qualidade. Advanced UT BOT foi desenvolvido para uso profissional, com lógica de sinal estável e cálculo seguro que evita atrasos ou atualizações incorretas. Ele não redesenha, remove nem altera sinais passados. Todos os sinais de BUY e SELL são gerados somente após o fechamento da vela , garantindo estabilidade e precisão. No modo
Entre em contato comigo após a compra para obter um EA de bônus baseado neste indicador. A Self Optimizing Double MA Strategy é uma ferramenta de trading de nível profissional projetada para eliminar a adivinhação na escolha de parâmetros. Impulsionada por um motor de auto-otimização integrado, adapta-se continuamente às mudanças nas condições do mercado, simulando milhares de combinações de parâmetros em segundo plano para manter uma vantagem estatística. Em vez de depender de configurações es
Se você negocia Forex, ter informações detalhadas sobre a força das moedas e a correlação entre os pares pode levar suas operações a um novo patamar. A correlação ajudará a reduzir o risco pela metade, enquanto a análise de força ajudará a maximizar os lucros. Este indicador oferece uma abordagem híbrida para selecionar os pares de moedas mais adequados, combinando análise de força e correlação entre pares de moedas. Como usar a Análise de Força das Moedas Suponha que sua estratégia de negociaç
KURAMA GOLD SIGNAL PRO (MT4) — Sistema Completo de Trading XAUUSD com Filtro de 7 Camadas, TP/SL Automático e Pontuação de Qualidade SEM REPINTURA. SEM REDESENHO. SEM ATRASO. Cada sinal é permanente. O que você vê é o que recebe. BÔNUS: Compre a licença vitalícia e receba AI Zone Radar (valor $59) + manual PDF completo GRÁTIS. Me envie uma mensagem após a compra. AI Zone Radar: https://www.mql5.com/en/market/product/175834 CONFIADO POR TRADERS: Já utilizado por uma comunidade ativa de trader
O indicador " Dynamic Scalper System " foi desenvolvido para o método de scalping, operando dentro de ondas de tendência. Testado nos principais pares de moedas e ouro, é possível a compatibilidade com outros instrumentos de negociação. Fornece sinais para a abertura de posições de curto prazo ao longo da tendência, com suporte adicional para o movimento dos preços. O princípio do indicador: As setas grandes determinam a direção da tendência. Um algoritmo para gerar sinais de scalping sob a fo
Um padrão de cabeça e ombros é uma formação de gráfico que se assemelha a uma linha de base com três picos, os dois externos têm altura próxima e o meio é o mais alto. Ele prevê uma reversão de tendência de alta para baixa e acredita-se ser um dos padrões de reversão de tendência mais confiáveis. É um dos vários padrões principais que sinaliza, com diferentes graus de precisão, que uma tendência está chegando ao fim. [ Guia de instalação | Guia de atualização | Solução de problemas | FAQ | Todo
PZ Double Top Bottom
PZ TRADING SLU
5 (1)
Esse indicador encontra padrões duplos de reversão superior e dupla e gera sinais de negociação usando breakouts. [ Guia de instalação | Guia de atualização | Solução de problemas | FAQ | Todos os produtos ] Sinais de negociação claros Cores e tamanhos personalizáveis Implementa estatísticas de desempenho Níveis personalizáveis de retração de fibonacci Ele exibe níveis adequados de stop-loss e take-profit Implementa alertas de email / som / visuais Esses padrões podem se expandir e o indicado
Special offer : ALL TOOLS , just $35 each! New tools   will be   $30   for the   first week   or the   first 3 purchases !  Trading Tools Channel on MQL5 : Join my MQL5 channel to update the latest news from me O Indicador de Padrão de Reversão de Três Barras oferece uma ferramenta poderosa para traders, identificando e destacando automaticamente padrões de reversão de três barras diretamente no gráfico de preços. Este indicador é um recurso valioso para detectar reversões potenciais de tendênc
Um indicador técnico que estrutura gráficos e identifica movimentos cíclicos de preços. Pode funcionar em qualquer gráfico. Vários tipos de notificações. Existem setas adicionais no próprio gráfico. Sem redesenhar a história, trabalha no fecho da vela. TF recomendado a partir de M5 e superior. Parâmetros fáceis de utilizar e configurar. Ao utilizar 2 indicadores com parâmetros diferentes, pode utilizá-los sem outros indicadores. Tem 2 parâmetros de entrada Ciclicidade e duração do sinal Estes
Mais do autor
The indicator places levels on the chart: day and week high, day and week low. When the price crosses the high's level upwards or the low's level downwards, the indicator beeps and send a notification (Alert and Push-notification on mobile phone ) indicating a direction and an instrument by which crossing has occurred, and also draws arrows. Visual parameters: Day_Width   - daily level width. Days_Alerts - enabling Alerts. Days_Arrows   - enabling drawing arrows. Day_High   - color of daily high
This is a full-fledged Price Action trading system based on the searching for entry points at the moment when the price breaks the trend lines. The indicator finds and draws the lines of support, resistance and horizontal levels. When the price crosses these lines, the indicator gives signal Alert and sends a Push notification. You can also draw your own lines, and the indicator will also work with them and give signal Alerts and Push notifications about price crossing all your lines. Your own
Filtro:
Sem comentários
Responder ao comentário