Conheça o Mercado MQL5 no YouTube, assista aos vídeos tutoriais
Como comprar um robô de negociação ou indicador?
Execute seu EA na
hospedagem virtual
hospedagem virtual
Teste indicadores/robôs de negociação antes de comprá-los
Quer ganhar dinheiro no Mercado?
Como apresentar um produto para o consumidor final?
Indicadores Técnicos para MetaTrader 5 - 50
The Percentage Average True Range (ATR) indicator measures market volatility by calculating the ATR of a selected asset and expressing it in one of three customizable formats: Percentage (%) relative to the current price, enabling easy comparison across assets with different price ranges. Basis Points (bps), where 1 bps equals 0.01%. Real ATR values, representing the raw ATR in price terms. By normalizing ATR values using percentage or basis points, this indicator allows for direct comparison of
FREE

The indicator is based on the relationship between two sets of Stochastic lines. The first set consists of 6 Stochastic with periods: 5, 8, 10, 12, 14, 16. The second set consists of 6 Stochastic with periods: 34, 39, 44, 50, 55, 60. These periods are customizable. Input parameters Stochastic MA Method Method of calculation ===== Short-term ===== Stochastic #1 %K Period Stochastic #2 %K Period Stochastic #3 %K Period Stochastic #4 %K Period Stochastic #5 %K Period Stochastic #6 %K Period Short
FREE

NewTest https://backoffice.aurum.foundation/u/DHXP1U
Boa tarde. Preparamos um novo produto para traders e analistas de mercado. Nosso indicador VolumeSpreadtompson-foi criado para ver a influência dos participantes institucionais do mercado no preço atual. O indicador mostra os níveis de variação do spread por unidade de tempo com seus valores principais. A prática mostra que a mudança nos volumes está associada a um aviso e à antecipação da atividade especulativa, especialmente em momentos -
FREE

This indicator shows the strength of each currency compared to the US dollar by calculating the rate of change in price over a specified time period. When you open the indicator, you'll see a list of different currencies on the price chart. Each currency will have a numerical value indicating its strength level compared to the US dollar, where: If the value is higher than the US dollar, it will be displayed in green, meaning that currency is stronger than the dollar. If the value is lower than t
FREE

The Commitments of Traders Ratio Indicator is one of these things you never thought about it before you really see the magic behind it. The indicator shows the Ratio of long/short positions released by the CFTC once a week.
If you have a look on the Sreenshot you can see two (three) zones of interest. Important note: MAs are not available in version 1.0. Zone 1: The Switches (Red -> Green, Green -> Red) Zone 2: MA cross Zone 3: If you combine this with the COX indicator an additional zone will
FREE

ToolBot Probabilistic Analysis - GRATUITO Um eficaz indicador para suas negociações
O indicador toolbot traz o cálculo de candles e uma análise de probabilística para que você tenha mais segurança em suas negociações.
Teste também nosso indicador de topos e fundos GRATUITO : https://www.mql5.com/pt/market/product/52385#description Teste também nosso indicador de (RSI, ATR, ADX, OBV) GRATUITO : https://www.mql5.com/pt/market/product/53448#description
Teste nosso EA ToolBot gr
FREE

Daily Weekly Monthly High Low - Your Ultimate Tool for Precision Market Analysis
The 200 free download promotion has ended. The price has now been updated. Thank you, everyone!
Love it? Hate it? Let me know in a review! Feature requests and ideas for new tools are highly appreciated. :)
Try "The AUDCAD Trader":
https://www.mql5.com/en/market/product/151841 Overview:
Elevate your trading strategy with Daily Weekly Monthly High Low , a sophisticated MQL5 indicator designed to pinpoint c

About This Indicator: RSI vs SMA Oscillator: A Comprehensive Technical Analysis Tool for Better View of Market Price
The RSI vs SMA Oscillator is a powerful technical analysis tool designed to understanding Market Price Fluctuation for buy or sell signals. This user-friendly Oscillator good for both novice and experienced traders, providing valuable insights into market trends and price movements. Key Features: - RSI Cross Alert: The indicator is based on the Relative Strength Index (RSI), a pop
FREE

This indicator is based on the MACD indicator
Also, some candlestick patterns are used in it to identify better signals
Can be used in all symbols
Can be used in all time frames
Easy to use method
Adequate settings
Settings: period: The number of candles used to calculate signals. pFast: Like the MACD indicator settings pSlow: Like the MACD indicator settings
alarmShow: If you want to receive an alert in Metatrader after receiving the signal, enable this setting alarmShowNoti: If you want to
FREE
O Indicador Average Force é uma ferramenta de análise técnica projetada para medir a força dos movimentos de preço, analisando o momentum e a volatilidade. Baseia-se no Force Index , que combina mudanças de preço e volume, mas utiliza um mecanismo de suavização para oferecer uma leitura mais clara e estável da dinâmica do mercado.
Principais Características: • Medição da força do impulso e da tendência – Ajuda a identificar a pressão de compra ou venda. • Cálculo suavizado do Force
FREE

Descripción corta Consensus MTF es un indicador gratuito de alineación multi-timeframe diseñado para mostrar el contexto real del mercado .
No genera señales de entrada ni salida. Su objetivo es ayudar a evitar operar cuando el mercado no está alineado . Descripción completa Consensus MTF analiza la dirección del mercado en varios timeframes simultáneamente, evaluando la posición del precio respecto a su nivel de equilibrio en cada marco temporal. Cada timeframe se clasifica de forma indep
FREE
MultiTimeFrame Double Screener MT5 — HiddenEdge MultiTimeFrame Double Screener MT5 is a professional dashboard that monitors multi-timeframe trend bias across multiple symbols from a single chart.
It uses dual confirmation to reduce noise and keep readings consistent across all windows. Functional Overview Computes bias per symbol using closed candles and a time anchor (H1 by default) to avoid historical repaint. Applies dual confirmation: bias reading + optional N-bar validation on the anchor
FREE

This is a demo version of the Candle Absorption Full indicator. It has limitations on operation. This indicator detects the Engulfing candlestick pattern and draws the corresponding market entry signal.
Features It works only with EURUSD on timeframes M1 and M5. The indicator analyzes a combination of 2 or 3 candlesticks depending on settings. The number of pre-calculated bars (signals) is configurable. The indicator can send an alert to notify of a found signal. Signal can be filtered by setti
FREE

O Indicador TRIXe é a combinação do indicador TRIX (Triple Exponential Moving Average) com adição de um sinal tipo EMA (Exponential Moving Average). Fornece sinais de continuidade de tendência e inicio de uma nova tendência. Os pontos de entrada e saída de operações ocorrem quando as curvas do indicador se cruzam. Tem melhor desempenho quando combinado com outros indicadores.
FREE

Double Correlation indicator (free) plots two windowed correlations in a separate window. the size of window is taken as input before the two symbols to correlate to. Two symbols are taken as an input parameters as well as period length. and the two correlations are computed with the currently shown symbol ex: input GBPJPY and AUDNZD. current symbol EURUSD then the following will be computed corr(EURUSD,GBPJPY) and corr(EURUSD,AUDNZD) The indicator can be useful to run a multi-symbol pair trad
FREE

A simple tick indicator of Bid and Ask prices. The period separator (1 minute) is displayed as a histogram. Parameters Show Bid Line - show/hide the Bid line; Show Ask Line - show/hide the Ask line; Show Labels - show/hide the last price values.
FREE

RSI Scanner, Multiple Symbols and Timeframes, Graphical User Interface An indicator that scans multiple symbols added from the market watch and timeframes and displays result in a graphical panel. Features: Multi symbol Multi timeframe Alerts and Notifications Live Monitoring Sorting modes One click to change symbol and timeframe Inputs for RSI and scanner settings
FREE
This indicator is a trading strategy designed to find high-probability entry points by combining two very popular indicators: Bollinger Bands (BB) and the Relative Strength Index (RSI) . The core idea is "dual confirmation" : a trade signal is only considered valid when both indicators agree. This helps filter out many of the false signals that occur when using just a single indicator, thereby increasing the reliability of each entry. Bollinger Bands are used to identify relative price value zon
FREE

Simple alternate MACD version like the one used in tradingview. Two lines (MACD & signal line) and a histogram. This MACD version can be used in many different ways. Potential trades are the crossing of the MACD & signal line, the crossing of the MACD through the 0-line of the histogram, the MACD being under the 0-line of the histogram or the movement of the histogram itself. A combination of these potential signals on different timeframes can be very precise, but always needs additional confirm
FREE

Are you having trouble with too many events in the economic calendar? This reduces to the minimum number you need. You can filter by country code importance any key words and you can receive alerts before the set time of the event. ++++++++++++++ If country code is blank, display available code on the expert tab. You need to turn off the automatic calendar update setting in MT5. Any sound file of .wav format in Sounds directory. The length of keyword characters is limited by MT5.
FREE

Este indicador tem como principal finalidade, mostrar qual o spread atual do ativo em que o indicador foi colocado. Conforme as fotos, de forma visual e dentro do próprio gráfico é possível visualizar o valor do spread no momento atual, é possível alterar a posição vertical do texto e a posição horizontal, além do tamanho da fonte e cor do texto.
Aurélio Machado
FREE
RCH FX Spread + Bar Close Countdown Indicator
What This Indicator Does
A simple, professional tool that displays real-time spread information and bar closing countdown directly
on your MT5 charts.
Key Features
• Real-time spread display - Shows current spread in pips or points
• Bar close countdown timer - Exact seconds remaining until current bar closes
• Customizable alerts - Audio notification before bar closes
• Fully adjustable display - Position, colors, fonts, and sizing options
• Works o
FREE

RSI talking, use all your senses while trading!
The idea When trading your eyes might be very stressed. Therefore I programmed the RSItalking. Trade what you see and what you hear !
Function This indicator says "rsioverbought" when rsi is over a threshold value (default 75%) and "rsioversold" if it is under a lower threshold (default 25%). When you keep a long position be adviced to realize profit when the indicator tells you "rsioverbought" and vice versa. You will find an explanation of the
FREE

Based on two MA line indicators.
Looking at the histogram, if the value is greater than 0, the uptrend will increase, the bigger the value, the stronger the uptrend will be and vice versa, if the value is less than 0, the downtrend will decrease, the smaller the value, the stronger the downtrend . The necessary condition when entering a buy order is that the first histogram is greater than 0 and the current candle is closed, and enter the order when the second histogram appears. The necessary
FREE

This is a Free Display Dashboard for The ArbitrageATR Recovery MT5 EA. This indicator is used to track existing Total hedge positions (Account Summary) , Balance, Equity, P/L and Symbols, Correlation Status. Please adjust size and colours according to your desired preference. Feel free to message me if there are any queries required. Please note that this an indicator and not an Expert Advisor.
LINK TO THE EA: https://www.mql5.com/en/market/product/131269?source=Site+Market+Product+Page#descr
FREE

这是一个组合指标分析趋势、支撑阻力、买卖点。运用了均线MA、布林带、KDJ、CCI、RSI。 主图上下线是布林带上下线,采用的是20周期和2.3标准差可以用来支撑阻力。 中间的是分析趋势的均线,趋势分析是用均线多周期: 为涨趋势,反之为下跌趋势。在同一种颜色,基本说明趋势没有发生变化。 子图是由 KDJ、CCI、RSI三个指标组成,大于70超买,小于30超卖, 智能提示是运用了算法,主要计算布林带, KDJ、CCI、RSI指标
有三个或四个指标超出市场常态就会发出提示行情可能反转。 子图指标运用了很多数据,刚刚开始加载会有点慢,耐心等待就可以 这个指标是主图指标,还要再下我发布的RCD分析,这样就刚刚好组成一套分析 电脑分辨率的文本大小请设置100%,不然字体会不一样
FREE

This is an ordinary MACD indicator displayed in the main window according to the selected chart style, i.e. Bars, Candlesticks or Line. When you switch the chart type, the indicator display also changes. Unfortunately I could not improve the chart type switching speed. After switching, there are delays before the arrival of a new tick.
The indicator parameters Fast EMA period Slow EMA period Signal SMA period Applied price
FREE

El indicador técnico Non Lag MA (Non-Lagged Moving Average) es una variante de la media móvil que busca reducir el retraso inherente a las medias móviles tradicionales.
Pros: - Menos retraso: Al estar diseñado para reducir el retraso, el Non Lag MA puede proporcionar señales más rápidas que las medias móviles tradicionales. - Tendencias claras: Las líneas del Non Lag MA muestran claramente las tendencias alcistas y bajistas, lo que facilita la interpretación de la dirección del mercado. - Pers
FREE

O indicador de intervalo de tempo Wormhole para o MetaTrader 5 (MT5) não é apenas mais uma ferramenta de negociação — é a sua vantagem competitiva nos mercados financeiros. Projetado tanto para traders iniciantes quanto profissionais, o Wormhole transforma a maneira como você analisa dados e toma decisões, garantindo que você esteja sempre à frente. Por que você precisa do indicador Wormhole (gratuito) Supere a concorrência: A capacidade de visualizar dois intervalos de tempo no mesmo gráfico si
FREE

Un indicador técnico de múltiples osciladores es una herramienta de análisis que combina varios osciladores para proporcionar una visión más completa de la dinámica del mercado. Los osciladores son fórmulas matemáticas que se calculan a partir de los datos de los precios y se representan gráficamente para ayudar a identificar la tendencia actual, el sentimiento del mercado y posibles puntos de giro.
**¿Para qué sirve?** Este indicador sirve para identificar condiciones de sobrecompra y sobreve
FREE

VORTEX OSCILLATOR: Master the Volume Flow VORTEX OSCILLATOR is a high-performance trading tool that reimagines the classic Vortex indicator as an ultra-responsive precision oscillator. Designed for traders who demand absolute clarity, it fuses price action with Tick Volume to reveal the true momentum behind every market move. Why VORTEX OSCILLATOR is a Game Changer Most indicators only track price, often reacting too late. VORTEX OSCILLATOR uses a sophisticated Volume-Weighted Flow algorit
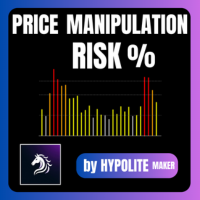
Price Manipulation Risk Indicator Advanced Tool for Market Risk Evaluation & Manipulation Detection Price Manipulation Risk Indicator is a professional tool designed to measure the current risk level in the market.
It evaluates price behavior, market activity, and candle dynamics to detect unstable or potentially manipulated environments. This indicator helps traders avoid traps , filter false signals , and improve timing in both entries and exits. Product Purpose Provide an immediate a
What It Does This indicator shows up to 5 moving averages from any higher timeframe on your current chart. Instead of switching timeframes to see the bigger picture, you get the trend information in one place. Example: Trading on 1-hour chart while displaying Daily moving averages to see the longer-term trend. Key Features Flexible Configuration Display up to 5 moving averages with individual enable/disable options Choose any higher timeframe as your source (4-hour, Daily, Weekly, Monthly, etc.)
FREE

candlestick time it a useful indicator ,it help to keep you alert with the candlestick time ,how far to be completed at the chosen period , it help to keep you patience which is a biggest thing that holds trades down ,try it to improve you way of trading. it work on any broker any time frame and any symbol. you can customize the color on input. it can work on multiple timeframe. Thank you !
FREE

La **Media Móvil de Tercera Generación (TGMMA)** es una versión avanzada del indicador estándar de **Media Móvil (MA)**. Fue descrita por primera vez por Manfred G. Dürschner en su artículo "Gleitende Durchschnitte 3.0" (en alemán). Aquí están las características clave de la TGMMA:
1. **Reducción del Retraso**: - A diferencia de las MAs tradicionales, la TGMMA reduce significativamente el retraso. Se adapta más rápidamente a los cambios de precios, lo que la hace ideal para traders que busc
FREE

Volume Cross Over is an indicator that measure positive and negative volume flow in a financial instrument, such as a stock, commodity, or index. It is base on the idea of On-Balance Volume developed by Joseph Granville. However instead of trending lines, this indicator shows volume cross over. When the closing price of an asset is higher than the previous closing price, then the Bull volume is greater than zero and Bear volume is negative. It suggests that buying volume is dominating, and
FREE

Tired of manually clicking through every chart just to check the current spread or overnight swap fees? The Dynamic Spread and Swap is a must-have utility that solves this problem by displaying all critical cost information for your favorite trading symbols in one clean, convenient dashboard. This lightweight tool automatically detects all symbols from your open charts and presents the data in a non-intrusive panel on your screen. Stop guessing your trading costs and start making more informed
FREE
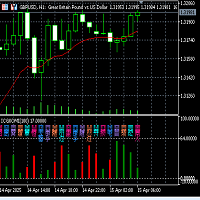
Fuxi Guaxiang Dual-color Oscillation Indicator Function and Usage Instructions (V2.1)
Fuxi Guaxiang Dual-color Oscillation Indicator Instructions: (1) This Guaxiang change indicator is based on the Yin-Yang transformation thought of the "Book of Changes" philosophy in ancient Chinese culture, integrating the results of the long-short game in each candlestick K-line period of the financial trading K-line chart, using China's oldest predictive coding method, in the form of the 64 Guaxiang of the
FREE

If you love this indicator, please leave a positive rating and comment, it will be a source of motivation to help me create more products <3 Key Takeaways Bulls Bears Eyes is another version of Laguerre RSI. Use Bull/Bear Power to calculate. One use of the Bulls Bears Eyes is to identify trends. This is done by looking for sustained periods when the indicator is above or below the 0.5 line. Also, a buy signal is generated when the Bulls Bears Eyes line crosses above the 0.15 level, while a s
FREE

This indicator will help you track performance of your trades, even scalping trades. You can use it with the Arab, and many other traders.
This indicator displays essential trading account information directly on your chart. It positions itself in one of the four corners of the screen and showcases details such as: Symbol: The symbol of the asset currently displayed on the chart. Profit/Loss: The total profit or loss in dollars for the current symbol. Pips: The total number of pips gained or
FREE

Wikirobo | Smart Entry Zone Indicator for All Timeframes Wikirobo is a powerful indicator that automatically highlights potential entry zones as Buy Limit and Sell Limit orders across all timeframes. Highlights Suggested entry zones for every timeframe ️ Clear, timeframe-specific Stop Loss levels shown on the chart for better risk management and position sizing Suitable for scalpers, day traders, and swing traders —flexible for any trading style How to Use Instea
FREE

================ // Average period ma_Sma, // Simple moving average ma_Ema, // Exponential moving average ma_Smma, // Smoothed MA ma_Lwma // Linear weighted MA =============== // Average method // Turn alerts on? // Alert on current bar? // Display messageas on alerts? // Play sound on alerts?
FREE

Synthetic Timeframe Creator
Professional Custom Timeframe Visualization for MetaTrader 5
Revolutionize your multi-timeframe analysis with Synthetic Timeframe Creator.
Tired of switching between charts? Need to analyze specific time cycles that don't exist in standard timeframes?
This is your ultimate solution. Create custom D2, D3, W2, W3 (or any N-period) candles directly on your MT5 chart without needing custom symbols or complex workarounds.
KEY FEATURES
Flexible Timeframe Synthesis
Choos
FREE

Индикатор Envelopes gaussian - это стандартный Envelopes с обработкой фильтром Гаусса. Преимущество данного индикатора в меньшем запаздывание от стандартного индикатора.
Входные параметры: Period - период индикатора по умолчанию 14 Deviation - ширина канала по умолчанию 0.1 Shift - смещение индикаторных линий от цены в барах. По умолчанию 0 Индикатор пригоден для использования в советниках
Буфер 0 — верхняя линия индикатора;
Буфер 1 — нижняя линия индикатора;
FREE
A professional-grade Bollinger Bands percentage analyzer.
Transform your trading strategies with the BBPCT Indicator, an advanced Bollinger Band Percentage indicator developed by iDevelop.expert. This tool is tailored to provide traders with a clear and actionable visualization of price movements relative to Bollinger Bands, along with insightful overbought and oversold signals.
Key Features: Dynamic Histogram Visualization: A dual-colored histogram for quick identification: Green bars indicat
FREE

Doji Engulfing Paths enables to get signals and data about the doji and the engulfing patterns on charts. It makes it possible to get opportunities from trends, and to follow the directional moves to get some profits on the forex and stocks markets. It is a good advantage to take all the appearing opportunities with reversal signals and direct signals in order to obtain some profits on the forex market. With the demo version, only the signals starting with the 20th candle or bar are available.
FREE
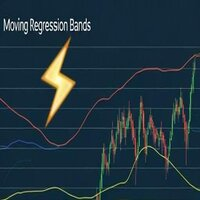
Moving Regression Bands - Indicador de Regressão Polinomial com Bandas Adaptativas
Descrição O MovingRegressionBands é um indicador técnico avançado que combina regressão polinomial com bandas adaptativas para identificar tendências e pontos de reversão no mercado. Utilizando cálculos matemáticos sofisticados, o indicador oferece uma visão mais precisa do movimento dos preços através de um modelo de regressão de ordem superior. Características Principais Regressão polinomial de ordem configuráv
FREE

It is the simplest indicator in existence. It has only one function: report the seconds elapsed since the last minute end in a very convenient way, with a label that can be moved in the chart, so that the trader does not have to take his eye off the forming candle. It is used on M1, but also on larger intervals, for those interested in opening/closing positions at the best time. Sometimes an intense movement in the last 10" of the minute gives indications of future trend, and can be used for sc
FREE
The indicator displays support and resistance levels based on fibonacci level in multi period Creates lines indicating the latest support and resistance levels.
These lines are updated whenever there is a change in support or resistance levels. Labels are removed if the corresponding conditions are not met.
the period is availble in setting and level fibonacci
FREE

This creative simple indicator will provide a precise framework for market sentiment within technical analysis of different timeframes. For instance, for traders like me that uses "Mark Fisher" strategy regularly, this is a perfect indicator for having an insight to markets from short term to long term point of view, using Break points of candles' lows and highs and perfect to combine with "Price Action" . For more options and modifications you can also edit the low timeframe candles withi
FREE

TS Time Remaining - Indicador de Cuenta Regresiva para Velas en MetaTrader 5 El TS Time Remaining es un indicador gratuito diseñado para la plataforma MetaTrader 5 que permite a los traders visualizar en tiempo real el tiempo restante de la vela actual. Esta herramienta es especialmente útil para aquellos operadores que trabajan con estrategias basadas en la acción del precio y patrones de velas japonesas, ya que les permite anticiparse al cierre de la vela y tomar decisiones con mayor precisión
FREE

The Retracement indicator shows the current and historical high, low and mid values. Optionally, it can also display major retracement levels. All these levels together form the significant levels of support and resistance. Therefore, it is essential to know them for every kind of trader.
Levels High Low Midpoint 76,4 % 61,8 % 38,2 % 23,6 %
Main features The indicator shows the actual levels of High, Low, Mid and selected retracements. Four optional retracement levels. Alert notifications
FREE

NeuraVault Pro v1.0 - Professional RSI Reversal Trading System Overview NeuraVault Pro is a professional automated trading system based on RSI (Relative Strength Index) reversals. It is designed to capture reversal opportunities in overbought and oversold zones, equipped with advanced filters and comprehensive risk management features. Trading Logic Core Strategy: RSI Reversal The EA captures reversal opportunities when the market reaches overbought or oversold zones: BUY Signal: RSI value drops
FREE

PACK 1 do Phi Cubic Fractals com opção para estender os indicadores no FUTURO, para o lado direito do gráfico Este produto contém os indicadores do PACK 1 (Lines + LineSAR + Channels + BTL + Ladder) + MODO FUTURO Phi Lines - medias moveis especiais, semelhantes às MIMAs do Phicube, capazes de indicar com muita clareza tanto a tendencia como a consolidação; Phi LineSAR - apaga ou destaca as Phi Lines para mostrar apenas as linhas que funcionam como suporte ou resistencia, indicando o limite de
Touch Alert Pro Quer aproveitar todas as oportunidades de trading, mas está cansado de ficar olhando o gráfico o tempo todo? Este indicador foi feito para você! Visão geral do produto Touch Alert Pro é um indicador que envia notificações para o aplicativo MetaTrader 5 quando o preço atinge um objeto de alerta no gráfico. Você pode adicionar ou remover objetos de alerta livremente usando os botões exibidos no gráfico.
Além disso, é possível definir um limite máximo de notificações por objeto

Este indicador imprime 2 médias com distância de 1 ATR (Average True Range) da média principal. As demais médias móveis só são mostradas se estiverem fora desse intervalo. Parâmetros: mediaprincipal = Média que será criado o intervalo, não será mostrada. mediasec1, mediasec2, mediasec3 = médias secundárias. periodatr: periodos do ATR Este indicador faz parte do Trade System MarketStrengthRadar
FREE

The "Moving Average Range Painter" is a robust MetaTrader 5 (MT5) indicator meticulously crafted to illustrate the fluctuating range between an exponential moving average (EMA) and a simple moving average (SMA) on any financial chart. This tool offers traders a comprehensive visual depiction of the price range within which an asset is oscillating. Here's a succinct interpretation of what this range signifies for technical analysis: Trend Dynamics : The range delineated by the EMA and SMA unveils
FREE

The Pipsurfer Strategy indicator is designed to help traders identify trend-based trades by leveraging momentum confirmations within the market structure. It works by detecting key pullbacks and providing entry signals after a confirmed market retracement , ensuring you only enter trades with the highest probability of success. Perfect for traders looking to capitalize on trending markets, this tool simplifies your decision-making process and helps you stay on the right side of the trend. Whethe
FREE

MA Cross Histogram Oscillator (MT5) The MA Cross Histogram Oscillator is a custom indicator designed to visualize the relationship between two moving averages in the form of a color-coded histogram. Instead of drawing standard MA lines on the chart, it highlights the strength and direction of the trend by comparing the difference between a fast and a slow moving average. Green bars – bullish momentum (fast MA is above slow MA and rising). Red bars – bearish momentum (fast MA is below slow MA and
FREE

Advanced Gann Pattern Indicator - Transform Your Trading Forever Discover the Secret Trading System with 70-95% Win Rate That Professional Traders Don't Want You to Know! Are you tired of indicators that repaint, give false signals, or leave you confused about when to enter and exit? Advanced Gann Pattern is here to change everything. Built on W.D. Gann's legendary Pattern-123 theory - the same system that helped him achieve over 90% trading accuracy - this indicator brings century-old wisdom

Suitable for the EurTrendSniper trend indicator. Please download and place it in the Indicators folder of MT5.
A key element in trading is identifying the areas or levels where decisions are made to buy or sell financial instruments. Although major participants attempt to hide their presence in the market, they inevitably leave traces. Our task is to learn how to identify these traces and interpret them correctly. Bullish Signal:
The price (candlestick) is above the band-colored block, the ban
FREE
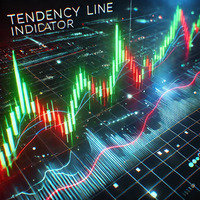
Indicador TendencyLine - Análise de Tendência de Mercado (Um indicador exclusivo da PPF - Past Project Future)
Descrição Geral O TendencyLine é um indicador técnico desenvolvido pela PPF - Past Project Future para ajudar os traders a identificar a tendência predominante do mercado. Ele sobrepõe uma linha de tendência baseada em um tipo de média móvel escolhida pelo usuário sobre o gráfico de preços e exibe um histograma colorido que sinaliza a direção da tendência.
Principais Característic
FREE

NewTest https://backoffice.aurum.foundation/u/DHXP1U
O indicador 2indtompson é um indicador de comparação de dois instrumentos para determinar volumes, para equilibrar em transações de negociação em pares ou para negociação de arbitragem, Preparado a partir de uma versão análoga para o terminal MT4. Assim, se você precisar comparar quanto pesará os dois instrumentos e não souber como fazê-lo, coloque o indicador no gráfico e ele calculará automaticamente os volumes necessários para o equilíbri
FREE

Indicators are professional data statistics, position orders, historical order analysis->>>>>> <This version is in Chinese -> English version please move>
Necessary for traders: tools and indicators Waves automatically calculate indicators, channel trend trading Perfect trend-wave automatic calculation channel calculation , MT4 Perfect trend-wave automatic calculation channel calculation , MT5 Local Trading copying Easy And Fast Copy , MT4 Easy And Fast Copy , MT5 Local Trading copying For DEM
FREE

O RFOC Mini Chart foi criado para projetar uma visão macro do mercado, que além de ter a opção de selecionar o timeframe de interesse diferente do gráfico principal, é possível incluir 2 indicadores:
1 - Canal de média móvel No mini gráfico será criado a média móvel baseada nos preços do time frame selecionado para o RFOC Mini Chart. O período da média móvel deve ser selecionado no painel de configurações do indicador.
2 - Banda de Boillinger No mini gráfico será criado banda de boillinger bas
FREE

A free deals history results panel. Its working principle is to calculate the monthly income by consulting historical trading records and display it in a tabular format. At the same time, it also statistics all the trading results of the current account, enabling traders to adjust their trading strategies based on historical data. If you have further requirements, please contact the developer.
FREE
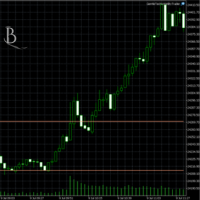
Suporte e Resistência do Último Dia Plataforma: MetaTrader 5
Tipo: Indicador personalizado
Exibição: Janela do gráfico (sobreposição) Funções: Calcula zonas de suporte e resistência com base nos máximos e mínimos do dia anterior. Usa uma janela deslizante ( SampleWindowSize ) para detectar faixas de preço recentes. Detecta suporte quando a faixa de preços atual está abaixo dos extremos anteriores. Detecta resistência quando a faixa de preços está acima. Mostra quatro buffers: LDResistanceHigh –
FREE

Introduction to GARCH Indicator GARCH is the short initial for Generalized Autoregressive Conditional Heteroskedasticity and it is the volatility prediction model commonly used in financial industry. GARCH model was first appeared in the work by Danish Economist, Tim Peter Bollerslev in 1986. The 2003 Nobel Prize winner, Robert F Engle also added much contribution for the refinement of GARCH model with Tim’s work. Our GARCH INM predictor took the original method of Nelder Mead for GARCH model bu
FREE

Temporizador
temporizador de contagem regressiva para o fechamento da vela.
FUNÇÕES:
- Contagem regressiva exata para o fechamento da vela
- Funciona em todos os prazos (M1 a MN)
- 2 formatos de visualização
- Cor e tamanho da fonte personalizáveis
- Posição ajustável no gráfico
- Atualização em tempo real a cada segundo
IDEAL PARA:
- Scalping e day trading
- Negociação com tempo preciso
- Praticar gestão do tempo em operações
- Todos os traders que precisam de controle de tempo
Q
FREE
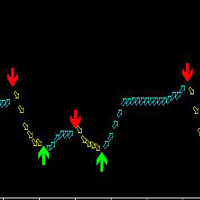
O índice serve para qualquer raça no MetaTrader 5, também adequado para qualquer período do Ciclo, MAS o Mais adequado é de 4 Horas e 30 minutos, fácil de USAR, SEM mudar a seta não deriva de absoluto, e não depois.
Este índice é de acordo com o princípio de ATR e um Ma, juntamente com o cálculo Da Mistura, de Alta precisão.
Comprar green: seta para CIMA;
Seta para baixo para vender: Vermelho;
Aparece UMA seta imediatamente!
Com a proposta de dois ciclos, para ser Mais exacto, é o primeiro
O Mercado MetaTrader é o melhor lugar para vender robôs de negociação e indicadores técnicos.
Você apenas precisa desenvolver um aplicativo para a plataforma MetaTrader com um design atraente e uma boa descrição. Nós vamos explicar como publicar o seu produto no Mercado e oferecer a milhões de usuários MetaTrader.
Você está perdendo oportunidades de negociação:
- Aplicativos de negociação gratuitos
- 8 000+ sinais para cópia
- Notícias econômicas para análise dos mercados financeiros
Registro
Login
Se você não tem uma conta, por favor registre-se
Para login e uso do site MQL5.com, você deve ativar o uso de cookies.
Ative esta opção no seu navegador, caso contrário você não poderá fazer login.