 MetaTrader 5
 Experts
 Indicadores
 Bibliotecas
 Utilitários
 Widgets
 Regras
Conheça o Mercado MQL5 no YouTube, assista aos vídeos tutoriais
Como comprar um robô de negociação ou indicador?
Execute seu EA na
hospedagem virtual
hospedagem virtual
Teste indicadores/robôs de negociação antes de comprá-los
Quer ganhar dinheiro no Mercado?
Como apresentar um produto para o consumidor final?
Novos Indicadores Técnicos para MetaTrader 5 - 122
 É com base nos sinais de indicadores técnicos que se aplicam as decisões para abertura ou fechamento de uma transação nos mercados de ações e Forex. A essência dos indicadores reside na previsão de mudanças de preço, com base na conversão matemática de preço e/ou volumes de um instrumento financeiro.
Teste os indicadores técnicos para prever melhor o comportamento do mercado e lucrar com isso.

SCALPFLASH-X
Where Fibonacci Precision Meets RSI Intelligence.
Next-gen trading system combining Adaptive Fibonacci Pivots, RSI Heat Mapping, and Smart Candle Analytics. Detect market dominance, momentum shifts, and reversal zones in real time across multiple timeframes. Institutional accuracy, retail simplicity — built for speed, clarity, and precision.
Advanced Multi-Timeframe Fibonacci & RSI-Driven Market Intelligence System ScalpFlash-X — A next-generation trading system combining Fibonacc

Perfect Entry Price — The Smartest Way to Time Your Trades
Perfect Entry Price is a next-generation indicator designed to help traders identify the most accurate and reliable price levels for market entries. It automatically scans market structure, volume dynamics, and price behavior to locate zones where a reversal or continuation is most likely to happen. The indicator is ideal for traders who want to enter the market exactly when the probability is highest and risk is lowest — whether you a

Largest Deltas is a professional tool for MetaTrader 5 that performs real-time market volume analysis and precisely calculates the Difference in Trade Volumes (Delta) at each price level within a bar. The tool visualizes the most significant price levels where market activity was at its peak, providing the trader with a clear understanding of the balance of power between "bulls" and "bears." Key Features and Advantages: Identification of the Key Delta Level:
Automatically finds the pri
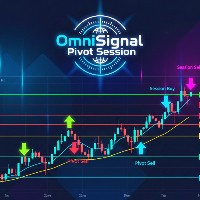
OmniSignal Pivot Session combines two powerful trading concepts— Daily Pivots and (NY, London and COMEX) Session Opening Levels —into one clean, intelligent signal indicator. It's designed to identify key market levels and provide clear, non-repainting entry signals based on a robust 3-candle confirmation pattern , helping you filter out market noise and trade with more confidence.
Suggested Symbols: XAUUSD, US30, DE40
(might have some bugs if you are using it with any Forex Pair!)
Core Fea
FREE
Liquidity Sweep Detector – Detailed Description and Installation Guide Overview
Liquidity Sweep Detector is a powerful and versatile technical indicator designed to help traders identify stop hunts and liquidity grabs across any financial instrument and timeframe. Stop hunts occur when price temporarily breaches key swing highs or lows, triggering stop-loss orders from retail traders, before reversing direction. By visually highlighting these events, this indicator allows traders to better unde
SignalFlow Pro - Professional Trend Analysis System SignalFlow Pro is a modern trend-following indicator designed to identify market reversals accurately and timely. Key Features: Dual-Color Trend Lines: Turquoise line - uptrend Fuchsia line - downtrend Clear visual separation for easy trend identification Signal Arrows: Blue arrow (↑) - Buy signal Pink arrow (↓) - Sell signal Arrows appear automatically when trend changes Customizable Parameters: Amplitude (2) - sensitivity level Arrow codes a
FREE

Market Structure Internal & External (CHoCH/BoS) Описание: Индикатор Market Structure Internal & External (CHoCH/BoS) — это мощный инструмент для анализа структуры рынка (Market Structure - MS) , который автоматически определяет и визуализирует ключевые точки разворота (свинги) и пробои структуры на двух различных временных масштабах/глубинах: Внутренней (Internal) и Внешней (External) . Он использует концепции Change of Character (CHoCH) и Break of Structure (BoS) из методологии Smart Money Con
FREE
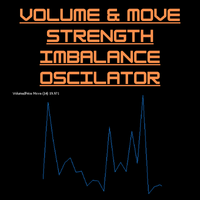
Volume-to-Price Movement Oscillator (VP Oscillator) for MT5 The VP Oscillator highlights the balance (or imbalance) between trading volume and price movement, helping traders spot hidden accumulation, distribution, or weakening trends. How It Works: Calculates each bar’s price range (High–Low) and tick volume. Normalizes both values over a set period (default: 14). Plots the absolute difference between them ×100 — showing how closely price action aligns with trading activity. Interpretation: Hig
FREE

Exponential Moving Average (EMA) Indicator The Exponential Moving Average (EMA) is one of the most widely used indicators in technical analysis.
It smooths out price fluctuations to help traders identify market trends more clearly — without being too slow to react to price changes. Unlike the Simple Moving Average (SMA), the EMA gives greater weight to recent prices , making it more responsive to new market information. This makes it ideal for traders who want to detect trend reversals earlier o
FREE
This indicator is a **Pivot-Confluence Zone Identifier** that focuses exclusively on identifying key support and resistance levels where price clusters align with classic pivot points. Here's what it does:
## Core Functionality
**Pivot Confluence Detection**: - Only displays price zones that align with classic pivot point levels (R1, R2, R3, S1, S2, S3) - **Excludes the main pivot point** - focuses only on support and resistance levels - Uses a configurable pip range to detect confluence nea
FREE
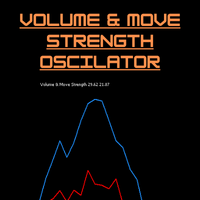
Volume & Move Strength (VMS) Indicator for MT5 The VMS Indicator displays the relationship between trading volume and price movement strength, helping traders assess how well market activity supports price action. How It Works: Measures tick volume as trading activity. Calculates move strength using a normalized True Range (%). Both values can be smoothed (default: 5) and optionally normalized (0–100) for consistency across markets. Plots two lines in a separate window: Blue (Volume) – trading a
FREE

Your feedback is very valuable to us. By sharing your experience, you help us improve and provide you with better service. Thank you!
PIPnova Candle Signals: Catch the Clearest Reversal Signals in the Market! PIPnova Candle Signals is a professional MetaTrader 5 indicator designed to instantly detect critical moments in price action—namely, potential trend reversals and points of indecision. It reliably catches the most powerful and trustworthy candle patterns, Pinbars and Dojis, with custo
FREE
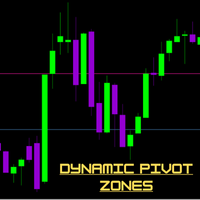
Dynamic Pivot Zones – Your Level Assistant on the Chart This indicator is a bit like a GPS for your trading . It shows you where the price likes to hang out, where it gets nervous, and where it flies through. No more calculating pivots by hand or guessing support and resistance levels. What it does: Automatically plots H1, H4, and D1 pivots . Shows support and resistance zones : R1, R2, S1, S2. Lines are colored and easy to read , so you can instantly see what’s hot or cold. Why you’ll love it:
FREE

Simple Moving Average (SMA) Indicator The Simple Moving Average (SMA) is one of the most fundamental and widely used tools in technical analysis. It provides a clear visual representation of the market trend by smoothing out price fluctuations over a specified period. Unlike the Exponential Moving Average (EMA) , which reacts more quickly to recent price changes, the SMA gives equal weight to all price points in the calculation, making it ideal for identifying long-term trend direction and re
FREE

NeuraVault Pro v1.0 - Professional RSI Reversal Trading System Overview NeuraVault Pro is a professional automated trading system based on RSI (Relative Strength Index) reversals. It is designed to capture reversal opportunities in overbought and oversold zones, equipped with advanced filters and comprehensive risk management features. Trading Logic Core Strategy: RSI Reversal The EA captures reversal opportunities when the market reaches overbought or oversold zones: BUY Signal: RSI value drops
FREE

Quantum Scalper – advanced adaptive EMA indicator for scalpers and trend traders.
It adjusts to market volatility, detects shifts instantly, and provides clear entry/exit levels.
Fast, lightweight, and highly accurate – your edge in the market.
Quantum Scalper – Precision Tool for Fast and Smart Trading Quantum Scalper is a cutting-edge indicator built on adaptive EMA logic with correction algorithms. It dynamically adjusts to price movements, filters market noise, and highlights precise entry
期間限定 無料ダウンロード NAS100 Scalper Signal Pro は、NASDAQ100専用に開発されたプロ仕様のスキャルピングインジケーターです。
シンプルな矢印サインに加え、 高精度フィルターを内蔵 することでノイズを軽減し、実戦向きのサインを実現しました。 主な特徴 M1・M5足に最適化 チャート上に矢印サインを表示 高精度フィルター搭載 (だまし削減・精度向上) アラート通知対応(ポップアップ / サウンド / プッシュ / メール) 複雑な設定は不要、導入後すぐに使用可能 スキャルピングから短期デイトレードまで対応 「シンプル × 高精度」 NAS100特化だからこそ可能になったシグナル精度を体感してください。 補足:レンジ相場ではシグナルが多く出る場合がありますが、爆発的なトレンド初動を逃さないための設計です。
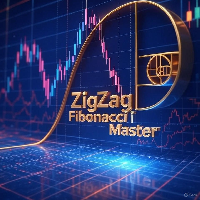
ZigZag Fibonacci Master Indicator Master the Markets with Dual Fibonacci Intelligence ZigZag Fibonacci Master transforms complex market analysis into crystal-clear visual insights. This isn't just another ZigZag indicator - it's a complete trading intelligence system that combines precision swing detection, dual-layer Fibonacci projections, and smart distance calculations in one powerful tool. What Makes It Different? Three Tools in One Package: 1. Advanced ZigZag Engine Forget about market nois
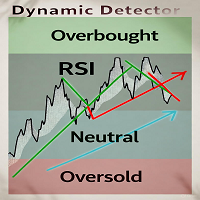
Dynamic Detector - Professional Trend and Signal Indicator This advanced indicator combines RSI and technologies to identify Overbought and Oversold zones in the market with precision. Key Features: Dynamic adaptive channels - automatically adjust to market conditions Clear visual signals - colored lines show trend direction Multi-level filters - reduce false signals Flexible settings - adapt to any timeframe and asset OB/OS zones - help identify entry and exit points Perfect for: Scalpers, da
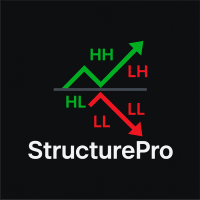
Descripción del indicador StructurePro 50 StructurePro 50 es un indicador avanzado de Market Structure diseñado para traders que buscan identificar de manera clara y objetiva los puntos clave de la acción del precio.
Con él podrás detectar automáticamente Higher Highs (HH), Higher Lows (HL), Lower Highs (LH) y Lower Lows (LL) , así como rupturas de estructura ( BOS ) y cambios de carácter ( CHoCH ). El indicador simplifica la lectura del mercado y elimina la subjetividad, permitiéndote cent

Channel Trend Bands – A Comprehensive Indicator for Market Analysis Simple to Use, Effective in Application User-Friendly and Suitable for All Traders This indicator stands out due to its straightforward functionality. Whether you're a beginner exploring the market or an experienced trader refining your strategy, this tool offers valuable insights. Using a Triangular Moving Average (TMA) with additional ATR-based bands , it provides structured market data to support well-informed decision-
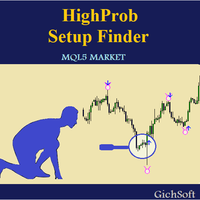
HighProb Setup Finder
Developer: GichSoft 2025
Overview
The HighProb Setup Finder is a precision-engineered market structure intelligence tool that visually reveals order flow transitions and reversal footprints directly on your chart.
It detects liquidity sweeps — where price grabs liquidity above or below a previous swing before reversing to target the opposite side. This helps traders identify institutional footprints and anticipate the next high-probability setup with confidence.
Cor

Hull Moving Average (HMA) The Hull Moving Average (HMA) is a refined version of the traditional moving average, designed to minimize lag while keeping the line smooth and precise .
Developed by Alan Hull , this indicator provides a faster and more accurate trend signal than standard moving averages such as the SMA or EMA. How It Works The Hull Moving Average uses a Weighted Moving Average (WMA) in a special way to reduce delay and smooth price movement.
Its calculation follows three main steps:
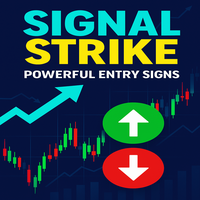
Signal Strike is a professional trading indicator designed for MetaTrader 5 that delivers clear, high‑confidence entry signals directly on your chart. Built with advanced logic that combines trend, momentum, volatility, and volume confirmation, this tool helps traders identify precise BUY and SELL opportunities with confidence.
Unlike generic indicators, Signal Strike is engineered to filter out indecision candles and weak setups. When conditions align, the indicator plots entry, stop loss, an

Quantified Trendline Strength (QTS) Overview
Quantified Trendline Strength is a technical analysis tool that automatically detects and evaluates trendlines based on price swing structures. It provides a visual and quantitative way to understand how significant each trendline may be, allowing traders to make more structured observations of market behavior. Indicator Type Category: Trend / Level Detection Display: Chart window (overlay indicator) Purpose: Identify and evaluate trendlines, support
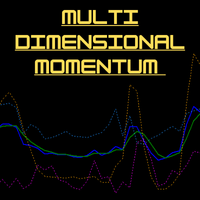
MDM indicator is the IMM (Integrated Market Momentum) line, which oscillates between 0 and 1. Here's how to interpret it: General Interpretation of the IMM Line : The indicator calculates this final value by combining momentum, trend, volume, aggressiveness, and price strength scores . Generally, readings above 0.50 suggest a strong bullish zone, while readings below 0.5 0 suggest a strong bearish zone. The area between 0.45 and 0.55 is often considered neutral or consolidating. Generating Tradi

Momentum Confluence Zone (MCZ) – MetaTrader 5 Indicator Overview
Momentum Confluence Zone is a custom chart indicator for MetaTrader 5.
It calculates dynamic price zones using a combination of moving average, volatility, and momentum measures. The indicator aims to assist traders in observing areas where price behavior and momentum interact. Operation Logic The indicator uses an Exponential Moving Average (EMA) as a reference. Dynamic zones are calculated above and below the EMA using the Avera

Good old UT BOT converted from TradingView script by ' QuantNomad ', initially by ' Yo_adriiiiaan ' and ' HPotter ' - so you can bet this is powerful tool. If you know, you know. This is top of the line, while keeping it really simple.
Main function: trend identification with trend switch points , created by EMA(source) and ATR -source is CLOSE PRICE with option to use HEIKEN ASHI chart instead, for this you need "Heiken Ashi" indicator - its available as free download by MetaQuotes
One of th

The Follow Line Indicator is an essential technical analysis tool that provides a clear, immediate visualization of the trend while detecting high-probability reversals in real-time. By combining adaptive price tracking with clear visual alerts, it transforms complex data into actionable trading signals. Key Features Dynamic Trend Line: Tracks the market's prevailing direction, automatically adjusting to each new price extreme. Clear Colors: The line turns Blue during uptrends and Red during dow

Adaptive Market-Structure Grid (AMSG) Indicator Overview
The Adaptive Market-Structure Grid (AMSG) is a custom indicator for MetaTrader 5 designed to visualize evolving market structure through adaptive grid levels.
It detects price swings, constructs dynamic grids, and adjusts to changing volatility conditions.
The indicator helps traders observe how market structure shifts between trending and ranging phases. How It Works
AMSG continuously evaluates price data to identify swing highs and low

Overview
All in One Swing Points is a precision swing detection indicator that automatically plots three levels of market swing structures—from the strictest 3-bar formations to long-term turning points—all in one visual layer.
This tool gives traders a clear, multi-timeframe perspective on price structure shifts, making it ideal for identifying market reversals, liquidity sweeps, and structure breaks with minimal clutter.
Key Features
a. 3 Swing Levels in One Indicator Strict 3-Bar S

Here our more valuable tools
SMC Trend Trading , Easy SMC Trading , Institutional SMC Architect Volume Analysis Tools , Volume flow Profile , Market volume profile , FVG with Volume , Liquidity Heatmap Profile , Volume Spread Analysis
This powerful indicator combines Fibonacci pivot point analysis with automatic trend line detection, providing traders with a complete technical analysis toolkit in a single tool.
Key Features : - Fibonacci Pivot Points: Automatically calculat

Your feedback is very valuable to us. By sharing your experience, you help us improve and provide you with better service. Thank you!
PIPnova – Advanced Signal Indicator (v2.1) PIPnova is a professional MetaTrader 5 signal indicator powered by advanced algorithms, a multi-layer filtering system, and real-time signal performance tracking. Key Features Powerful signal algorithm based on RSI , Stochastic , and a custom LWTI oscillator Automatic TP / SL level placement for each signal Outc

Dual-TF Daily Bias Dashboard — Serious Day Trading Companion Trade the day with clarity.
Dual-TF Daily Bias Dashboard gives you a crisp, at-a-glance read of the intraday directional bias using a robust, dual-timeframe engine (H1 + M15). It also shows a single London→NY trading window so you instantly know when to engage and when to stand down. This is an add-on tool to keep you disciplined: buy when the bias aligns bullish, sell when it aligns bearish, or don’t trade when conditions are mixed.
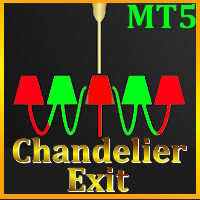
Indicator converted from tradingview script by 'everget'
"This is a redesign of the Chandelier Exit indicator. It removes stupid transitions between Chandelier Exit' states and highlights initial points for both lines.
This indicator was originally developed by Charles Le Beau and popularized by Dr. Alexander Elder in his book "Come Into My Trading Room: A Complete Guide to Trading" (2002).
In short, this is a trailing stop-loss based on the Average True Range (ATR) ."
Indicator also offers

True TrendLines MT5 - Smart Trend Detection & Alerts Overview True TrendLines MT5 is a professional-grade technical analysis tool that automatically identifies and plots high-probability trend lines on your MetaTrader 5 charts. Using a sophisticated swing point detection algorithm, it helps traders visualize key market structure and potential reversal points with precision. Key Features Automatic Trend Line Detection Identifies valid swing highs and lows based on your chosen strength paramet
FREE
The MTF Support/Resistance & Trendline Analyzer is a powerful multi-timeframe indicator that automatically detects key support and resistance levels , draws dynamic trendlines , and provides a real-time market structure dashboard — all in one clean, lightweight display. It combines fractal logic and price action detection across three timeframes to give you a unified view of market direction and structure. Whether you trade reversals, breakouts, or trends, this tool highlights the zones that mat
FREE
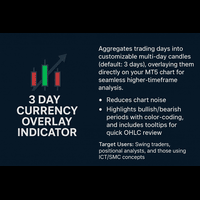
The 3-Day Currency Overlay Indicator aggregates trading days into customizable multi-day candles (default: 3 days), overlaying them directly on your MT5 chart for seamless higher-timeframe analysis. Ideal for forex, CFDs, indices and synthetics(deriv assets), it helps identify trends, support/resistance, and reversals without switching timeframes.
It displays 3Days timeframe just like every other timeframes.
It also accomodate for holidays, weekends or days with market closed in its calculati

Strategic Momentum EA is an automated trading system designed to identify and respond to short-term market movements using a momentum-based algorithm. It operates within predefined risk parameters and executes trades based on technical indicators without manual intervention. Functionality: The Expert Advisor monitors price action and volume shifts to detect potential entry points. It uses adjustable input parameters for risk management, trade frequency, and indicator sensitivity. The system is

# Timeframepro - MT5 Candle Timer Countdown Indicator
## Overview Timeframepro is a professional MT5 indicator that displays a real-time countdown timer showing the remaining time before the current bar closes and a new bar forms. It provides essential time management functionality for traders who need to track candle closure times accurately.
## Key Features
### ️ Core Functionality - **Real-time Countdown Timer**: Displays remaining time in MM:SS format (e.g., "Time: 12:45") - **Server Ti
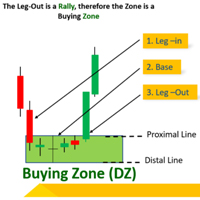
Have you ever been confused about identifying Supply and Demand zones? This indicator will work effectively to indicate the exact potential Supply and Demand zones. Core Features Smart 2-Candle Pattern Detection Identifies high-probability supply (bearish) and demand (bullish) setups with built-in ATR and candle-body filters to reduce noise.
Color-coded by Timeframe & Direction
Bullish arrows (Demand zones):
Pale Green – M15
Aqua – M30
Lime – H1
Navy – H4
Bearish arrows (Suppl
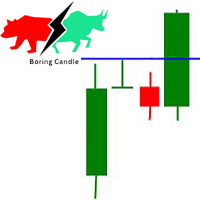
Potential Supply & Demand Compression Zone Indicator
This indicator identifies potential compression (supply & demand) zones across multiple timeframes. It highlights areas where the market has been consolidating and is likely to build up energy before a breakout.
When aarrow appears, it marks a potential breakout from the compression zone. Traders can then consider placing buy or sell orders in the direction of the breakout, following their own risk-management rules.
The indicator is design

TechBot Indicator is an intelligent, high-precision trading system built on complex mathematical logic — not a mix of standard indicators. Using proprietary analytics and dynamic data modelling, TechBot interprets market strength, timing, and momentum with exceptional accuracy. It continuously filters market noise to reveal only high-confidence setups, giving traders a clear, predictive view of upcoming movements. Originally optimized for synthetic markets, TechBot’s self-scaling mathematical m
Dragon Bands Z: Indicador de Análise Visual de Tendência Dragon Bands Z é um indicador projetado para simplificar a leitura do gráfico através da consolidação visual de múltiplas fontes técnicas. Seu objetivo é fornecer uma indicação clara da direção do mercado e sua força, sem a necessidade de gráficos saturados com múltiplos indicadores. O indicador utiliza um preenchimento de cor híbrido para traduzir a ação do preço em quatro estados visuais primários: Verde: Indica uma força direcional pred

Crystal Supply Demand Pro (SD Pro)
Não opere em cada vela – espere pelas zonas institucionais. Crystal Supply Demand Pro (SD Pro) é um indicador profissional de zonas de Oferta e Demanda para MetaTrader 5.
Foi desenvolvido para traders que querem ver zonas limpas e de qualidade institucional nos seus gráficos, em vez de retângulos desordenados e conceitos antigos.
Com otimização para prazos maiores, atualizações dinâmicas e visuais profissionais, o SD Pro mostra apenas os níveis que realmente i
FREE
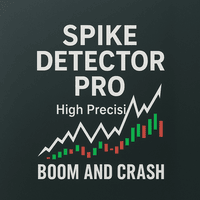
Spike Detector Pro - Advanced Fast Movement Detection System Introducing Spike Detector Pro, a professional tool developed for traders seeking opportunities in fast price movements. This exclusive indicator combines sophisticated technical analysis with multiple confirmation layers to identify high-probability setups. After purchase, send me a private message to receive the optimized configuration files, the installation manual and setup instructions and access to our private community, and di

Indicador Tartarugas com alertas. Opere as rupturas. Não perca nenhum sinal. O mercado não espera. Assim que o preço rompe para um novo território, você precisa saber e precisa agir. Este indicador foi criado para traders que acompanham o preço, não as opiniões alheias. Seja seguindo as regras clássicas do sistema Tartaruga ou qualquer outra abordagem baseada em rupturas, o indicador traça os níveis-chave diretamente no seu gráfico e avisa você no exato momento em que o mercado dá o sinal. Sem s

FLEQBA Pro – Descrição do Indicador Este indicador foi desenvolvido para usuários do MetaTrader 5 que desejam acompanhar visualmente as operações próprias ou de seus robôs, tanto retrospectivamente quanto em tempo real .
A exibição gráfica torna o funcionamento da sua estratégia ou do robô muito mais claro e fácil de compreender do que apenas números. O indicador não apenas exibe os dados: ele também os analisa, avalia e gera estatísticas , que podem ser consultadas instantaneamente por meio dos
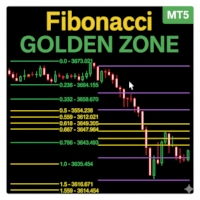
O Indicador Fibonacci Sessions é uma poderosa ferramenta de trading projetada para scalping de precisão e estratégias intradiárias. Ele traça automaticamente os principais níveis de Fibonacci para as sessões de Nova Iorque, Londres e Ásia, oferecendo aos traders uma visão clara da dinâmica do preço durante as principais sessões de mercado. Zonas exclusivas de "Ouro" são destacadas em cada sessão, onde o preço reage com mais frequência. Isso cria zonas altamente confiáveis para reversões, romp
FREE
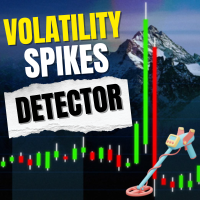
Volatility Monitor – Indicador de Detecção de Picos em Tempo Real Visão Geral Volatility Monitor é um indicador MT5 leve e profissional projetado para monitorar movimentos bruscos de preços e alertar os traders em tempo real. Seja Forex, Ouro, pares JPY ou Criptomoedas, fornece sinais claros de volatilidade via ATR automático ou limites manuais de pips. Principais Recursos Detecção de volatilidade em tempo real. Modos flexíveis (ATR ou manual). Alertas progressivos (som, pop-up, push). Marcadore
FREE

Moving Spread – Monitor de Custo de Mercado em Tempo Real Monitore o spread médio em tempo real e evite operar em períodos de alto custo. O que este indicador faz? O Moving Spread mede o spread médio (em pontos) do mercado em tempo real, mostrando como ele varia ao longo do tempo. É uma ferramenta essencial para traders que querem entender quando o custo de entrada é muito alto, pois isso pode corroer seus lucros ainda antes da operação começar. Por que isso importa?
Um spread alto signi
FREE

Weis Waves é um indicador técnico desenvolvido por David Weis, inspirado nos princípios de Richard Wyckoff.
Diferente do volume tradicional, que é exibido barra a barra, o Weis Waves acumula o volume em “ondas” de alta ou de baixa, reiniciando a contagem sempre que ocorre uma mudança na direção do preço. Esse método permite que o trader visualize de forma clara a força real do movimento do mercado, já que cada onda reflete a intensidade do volume que sustenta a sequência de candles. Principai
FREE

O HiLo Ladder é uma releitura do clássico indicador HiLo , amplamente utilizado por traders para identificar tendências e possíveis pontos de reversão no mercado. Diferente da versão tradicional, o HiLo Ladder apresenta seu traçado no formato escalonado — as populares “escadinhas” — que tornam a leitura do movimento de preços muito mais clara e objetiva. Principais vantagens: Visualização simplificada das fases de alta (verde) e baixa (vermelho). Análise mais intuitiva sem perder a essência
FREE

BarX — Indicador de Máxima e Mínima de Candle Específico BarX é um indicador técnico que destaca automaticamente a máxima e a mínima de um candle específico do dia , definido pelo usuário (por exemplo, candle 0 representa o primeiro candle após a abertura do mercado ). Essa ferramenta é especialmente útil para traders que utilizam níveis de preço fixos como suporte, resistência, breakout ou reversão . Ao marcar visualmente esses pontos no gráfico, BarX facilita a análise técnica , melhora a le
FREE

O Oracle Oscillator é uma verdadeira revolução na análise técnica . Em vez de obrigar o trader a monitorizar vários osciladores ao mesmo tempo — como RSI, Estocástico, Williams %R e DeMarker — este indicador unifica o melhor de cada um numa única linha híbrida (cor DodgerBlue ), perfeitamente calibrada para ser reativa aos movimentos do mercado , mas ao mesmo tempo conservadora e estável , evitando o ruído e os falsos impulsos que confundem tantos traders. Por que é superior a cada oscilador sep

O indicador SR POC VOLUME para MetaTrader 5 foi desenvolvido para identificar, agrupar e visualizar os Pontos de Controle (POCs) derivados dos dados das velas ao longo de um período de observação configurável. Seu objetivo é fornecer uma maneira estruturada de reconhecer áreas de suporte e resistência com base na atividade acumulada de volume e na distribuição do delta, permitindo que os traders compreendam melhor onde se formou interesse significativo no mercado. Funcionalidades Principais Cál
Consolidation Breakout Panel EA Consolidation Breakout Panel EA é um painel inteligente em tempo real que monitora múltiplos símbolos e timeframes (M2, M5, M15, M30, H1, D1), identificando automaticamente rompimentos de consolidações de preço e classificando sua força com base no volume . É a ferramenta ideal para traders que utilizam estratégias de rompimento de níveis , querem acompanhar múltiplos mercados e desejam ter uma leitura clara da tendência por timeframe . Principais Recursos D

Meta Cipher A: Indicador de Sobreposição de Precisão para Ação do Preço Meta Cipher A traz o popular conceito do Market Cipher A para o MetaTrader 5 como um indicador de sobreposição de alta precisão. Projetado para exibir sinais preventivos diretamente no gráfico de preços, ele combina uma faixa de 8 EMAs , análise WaveTrend e oito tipos distintos de sinais para ajudar você a identificar entradas, saídas e zonas de alto risco antes que elas se formem completamente. Embora o Meta Cipher A seja p

Order Block Pro (MQL5) – Versão 1.0 Autor: KOUAME N'DA LEMISSA
Plataforma: MetaTrader 5 Descrição: Order Block Pro é um indicador avançado projetado para detectar automaticamente Blocos de Ordem de alta e baixa no seu gráfico. Ao analisar velas de consolidação seguidas de velas de impulso fortes, o indicador identifica áreas-chave onde o preço provavelmente se acelerará. Ideal para traders que desejam: Identificar pontos de entrada e saída precisos. Detectar zonas dinâmicas de suporte e resistê
Haven ZScore Oscillator é um poderoso oscilador estatístico desenvolvido para identificar desvios anormais do preço em relação ao seu valor médio. O indicador não se limita a seguir o preço, mas mede o quão estatisticamente significativo é o preço atual, o que permite determinar com alta precisão as zonas de sobrecompra/sobrevenda e encontrar potenciais pontos de reversão da tendência. Esta ferramenta tornar-se-á um assistente indispensável para os traders que preferem uma abordagem orientada po
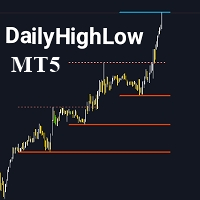
Por favor, não se esqueça de avaliar o indicador para ajudar na sua visibilidade. O indicador DailyHighLow é projetado especificamente para a plataforma MetaTrader 5 (MT5) e tem como objetivo ajudar os traders a monitorar as flutuações diárias dos preços. Este indicador traça automaticamente linhas de tendência com base nos preços mais altos e mais baixos de um período personalizado, oferecendo uma assistência visual clara para os traders que precisam de informações precisas sobre o mercado. Pri
FREE
Strivex Supply/Demand Indicador para MetaTrader 5 O indicador Supply/Demand da Strivex Algo identifica automaticamente zonas importantes de oferta e procura, marca quebras de estrutura de mercado (BOS) e notifica o trader em tempo real.
Um recurso especial: as zonas permanecem visíveis mesmo quando o período gráfico é alterado. Por exemplo, é possível exibir zonas de H1 em um gráfico M15 sem que sejam redesenhadas ou apagadas.
Principais funções Detecção automática de zonas com base em sw

Avis commercial – ETE DETECTOR POWER v5.0 (Cabeça e Ombros Pro) Détection automatique des figures "Cabeça e Ombros" L'indicateur ETE DETECTOR POWER v5.0 est un outil professionnel pour les commerçants qui souhaitent anticiper de grands retours sur le marché en utilisant l'une des figures graphiques les plus puissantes : Cabeça e Ombros (H&S) et leur version inversée. Grâce au système d'optimisation de gestion des objets (MaxObjects) , l'indicateur est permanent, rapide et légal dans les grap
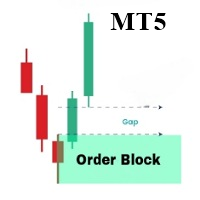
OrderBlock Analyzer é um indicador personalizado para MetaTrader 5 (MT5) projetado para detectar e destacar Blocos de Ordens (Order Blocks) nos gráficos de preços. Este indicador auxilia os traders na identificação de estruturas-chave do mercado, sinalizando possíveis áreas de reversão ou continuação. Baseado no comportamento do mercado, o OrderBlock Analyzer desenha automaticamente os blocos de ordens e distingue blocos de alta e baixa com cores diferentes. Principais características: Detecção
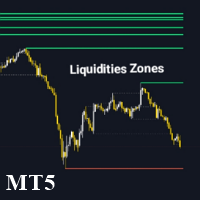
O Liquidity Zone Detector é um indicador técnico avançado projetado para identificar e destacar zonas chave de liquidez no mercado utilizando o indicador ZigZag. Esta ferramenta localiza níveis de preços onde é provável que haja liquidez significativa, traçando linhas de tendência nos altos e baixos detectados pelo ZigZag. O Liquidity Zone Detector ajuda os traders a identificar áreas potenciais de reversão ou continuação de tendência com base na acumulação ou liberação de liquidez. Principais c

Descrição Técnica do Indicador – Delta Profile para MetaTrader 5 O Delta Profile é um indicador desenvolvido para o MetaTrader 5 com foco em análise detalhada do fluxo de volume dentro de um intervalo definido de candles. Ele organiza e exibe informações sobre o desequilíbrio de volumes positivos (associados a movimentos de alta) e negativos (associados a movimentos de baixa) em diferentes níveis de preço. O resultado é uma visão clara dos pontos do gráfico onde há maior concentração de negócios

Capítulo 1: Introdução O AI-Trend Oscillator é um indicador versátil e poderoso, projetado para ajudar os traders a identificar tendências de mercado, reversões e momentum. Este indicador utiliza cálculos complexos e técnicas de suavização para fornecer sinais acionáveis. O AI-Trend Oscillator pode ser usado para trading intraday, swing e posicional, sendo adequado para diversas condições de mercado e estilos de negociação. Capítulo 2: Visão Geral dos Cálculos O AI-Trend Oscillator baseia-se em

Niveaux mensuels + PinBar + Marubozu + ALERTES (MT5) Version : 2.0 FINAL
Auteur : KOUAME N'DA LEMISSA Visão geral Cet indicateur pour MetaTrader 5 fournit une analyse structurée du marché à partir des niveaux de prix, de la reconnaissance des coussins de chandelier et d'un système d'alerte en temps réel. Il aide les commerçants à identifier les zones clés du marché et à obtenir des réactions potentielles au prix des objectifs techniques du secteur. Principais funcionalidades Níveis mensais aut
N/B: All our product purchase comes with our free ‘’DAILY SCALPER EA’’ - bit.ly/4qlFLNh Whatsapp Developer for yours after successful purchase SEER SPIKE DETECTOR
The Ultimate Market-Reversal & Spike Forecasting Tool for Crash & Boom Indices, Forex & Synthetic Markets
Best on M1 and M5 Stoploss: 10 Candles Maximum.
What is SEER SPIKE DETECTOR?
The SEER SPIKE DETECTOR is a next-generation market prediction indicator designed to detect and confirm spikes, reversals, and momentum sh

MetaTraderPro Premium Indicator (MT5) O MetaTraderPro Premium Indicator foi desenvolvido para identificar de forma clara e objetiva potenciais pontos de entrada e saída no mercado. Com sinais exibidos diretamente no gráfico, o indicador oferece praticidade e agilidade para auxiliar na tomada de decisão. Diferencial: o indicador não repinta e não recalcula após o fechamento da vela, garantindo que o trader veja sempre sinais consistentes e confiáveis. ️ Principais Recursos Sinais visuais
O Mercado MetaTrader é um site simples e prático, onde os desenvolvedores podem vender seus aplicativos de negociação.
Nós iremos ajudá-lo a postar e explicar como descrever o seu produto para o mercado. Todos os aplicativos no Mercado são protegidos por criptografia e somente podem ser executados no computador de um comprador. Cópia ilegal é impossível.

Você está perdendo oportunidades de negociação:
- Aplicativos de negociação gratuitos
- 8 000+ sinais para cópia
- Notícias econômicas para análise dos mercados financeiros
Registro
Login
Você concorda com a política do site e com os termos de uso
Se você não tem uma conta, por favor registre-se