 MetaTrader 5
 Experts
 Indicadores
 Bibliotecas
 Utilitários
 Widgets
 Regras
Conheça o Mercado MQL5 no YouTube, assista aos vídeos tutoriais
Como comprar um robô de negociação ou indicador?
Execute seu EA na
hospedagem virtual
hospedagem virtual
Teste indicadores/robôs de negociação antes de comprá-los
Quer ganhar dinheiro no Mercado?
Como apresentar um produto para o consumidor final?
Indicadores Técnicos Grátis para MetaTrader 5 - 72
 É com base nos sinais de indicadores técnicos que se aplicam as decisões para abertura ou fechamento de uma transação nos mercados de ações e Forex. A essência dos indicadores reside na previsão de mudanças de preço, com base na conversão matemática de preço e/ou volumes de um instrumento financeiro.
Teste os indicadores técnicos para prever melhor o comportamento do mercado e lucrar com isso.
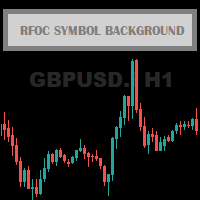
O RFOC Symbol Background foi criado para exibir no fundo do gráfico o nome do ativo e o timeframe corrente.
A exibição do nome do ativo no fundo do gráfico é muito utilizada por traders que estão projetando a tela para espectadores, facilitando a identificação do ativo e o timeframe durante uma aula, por exemplo.
Está disponível para o usuário selecionar o tamanho da fonte (pequena, média ou grande) e selecionar a cor para melhor visualização de acordo com a cor do fundo do gráfico de forma a
FREE

A simple indicator showing the size of the spread at the current time, the maximum for the day and the maximum for the entire duration of the indicator.
Daily statistics of the maximum spread are also displayed, indicating the time when this spread was fixed.
The location of the display of the received information can be changed depending on your preferences and positioned anywhere on the screen.
It is possible to output alerts about exceeding the size of the spread specified in the input pa
FREE

The RSI everyone uses. Finally READABLE.
RSI is one of the most famous indicators in the world... and one of the most misread. RSI Clarity Zones makes it crystal clear, with colored zones and a plain word.
️ WHAT YOU SEE • The RSI with its colored zones overbought / neutral / oversold • A label stating the state plainly: OVERBOUGHT, OVERSOLD or NEUTRAL • A flag when it crosses the 50 line (the momentum shift) ️
WHO IT'S FOR Beginners who want to understand RSI without memori
FREE
Мультивалютный индикатор в отдельном окне отображает движение валютных пар в пунктах с расхождением от начала дня. Во время работы, динамически возможно включать и отключать различные пары прямо на графике. При первом запуске, возможно, потребуется продолжительное время, пока загрузиться история для основных валютных пар. Расчет всех кроссов происходит на основе мажоров. Для валют CAD, CHF, JPY - график перевернут. При повторном открытии, все настройки индикатора восстанавливаются автоматически.
FREE
Мультивалютный индикатор в отдельном окне отображает движение валютных пар в пунктах с расхождением от начала дня. Во время работы, динамически возможно включать и отключать различные пары прямо на графике. При первом запуске, возможно, потребуется продолжительное время, пока загрузиться история для основных валютных пар. Для валют CAD, CHF, JPY - график перевернут.
При повторном открытии, все настройки индикатора восстанавливаются автоматически.
FREE

Добрый день. Сегодня добавили вспомогательный индикатор тренда DveMashkiTompson, идея взята из аналога МТ4 и перенесена на МТ5, используется совместно с индикаторами Тренда ТМА и МА, рисует красные и зеленые области в зависимости от направления рынка. Тренд вверх -зеленые области, тренд вниз -красные.Области основываются на пересечении индикатора МА, таким образом данный индикатор дает информацию графического содержания для более быстрой оценки ситуации и принятия решения.
FREE
The Periodic ATR Indicator visually compares the ATR values of each bar to the average ATR values for the same time of day over previous days. By contrasting the current ATR value with the historical average, this tool allows traders to identify exceptionally strong or weak market movements. It also helps to contextualize each market movement within the broader framework of long-term market behavior. This versatile indicator is compatible with all timeframes, including higher ones such as 4-hou
FREE

``` Bneu GLA Trend Indicator — Grover Llorens Activator
This indicator for MetaTrader 5 displays a dynamic trend activation line based on the Grover Llorens Activator method. The line changes color based on price position relative to the activation level, with signal arrows appearing on trend changes.
What It Does
Plots a dynamic activation line on your chart: - Green line when price is above (bullish condition) - Red line when price is below (bearish condition) - Arrows appear on trend cha
FREE
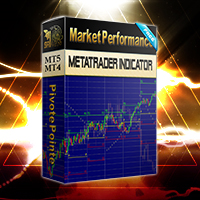
Unlike many other indicators including the moving average indicator, Pivot Point can be a leading indicator. In these systems, the price levels of the previous period are used to determine the critical points instead of relying on the current price performance. Such an approach provides a clear framework for traders to plan their trades in the best possible way.
You can use this method and its combination with the methods you want to build and use a powerful trading setup. MT4 version
Let us kno
FREE
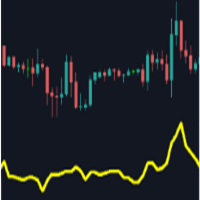
Main purpose: This indicator calculates the average of previous candles (a half of candle points). This value represent the strength of market (buy/sell) in each candle.
Parameters: . Period: indicating previous candles to calculate average . Shift: draw line at a shift on chart.
Tip: We can use this value to consider TP and SL of a position before opening.
FREE
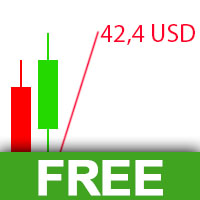
The Visual Result Calculator Indicator is a powerful tool designed to enhance your trading experience on the MetaTrader platform. This intuitive and user-friendly indicator allows you to visualize potential profits or losses on a trading chart, helping you make better-informed decisions and manage your trades with precision. The Indicator displays a dynamic line on the trading chart, representing the potential profit or loss of a trade based on the start and end of the line. Simply click and
FREE

Dynamic Theoretical Stop Indicador em histograma que analiza dinamicamente os níveis de Stop Teórico em tempo real. Funcionamento: O DTS - Dynamic Theoretical Stop faz um mapeamento de fractais nos candles anteriores e sugere dois níveis de Stop: Para compra e para venda. Leitura sugerida: É necessário que se faça previamente, dentro do Trading Plan, a definição de Stop máximo em pontos. Dessa forma, o trader poderá decidir o melhor ponto de entrada analisando os níveis de stop teórico: Stop par
FREE

A simple and highly effective Strength and Weakness currency indicator that can be used to aid your fundamental and technical analysis for winning trade decisions.
The indicator is very easy to use and can be applied to all time frames.
FX Tiger uses an advanced algorithm to calculate a score table for all major currencies. Green indicates currency strength and red indicates currency weakness. Once you have identified the strong and weak currencies, pair strong versus weak currencies and comb
FREE
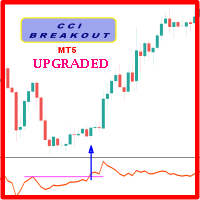
Probability emerges to record higher prices when CCi oscillator breaks out oscillator historical resistance level when exhibit overbought values. Since, oscillator breakout of support and resistance have similar effect as price breaks support and resistance levels, therefore, its highly advised to confirm price breakout with oscillator breakout; certainly, will have the same output in short trades. Concept is based on find swing levels which based on number of bars by each side of peak or troug
FREE
This indicator shows the value of returns in the selected time frame
They are calculated as logarithm of returns , rather than price or raw returns. For small returns, arithmetic and logarithmic returns will be similar. The benefit of using returns, versus prices, is normalization. It is possible measures all variables in a comparable metric despite originating from price series of unequal values
Inputs You can display data both as a Histogram or a Line It's also possible to display the a
FREE

Simple Moving Average (SMA) Indicator The Simple Moving Average (SMA) is one of the most fundamental and widely used tools in technical analysis. It provides a clear visual representation of the market trend by smoothing out price fluctuations over a specified period. Unlike the Exponential Moving Average (EMA) , which reacts more quickly to recent price changes, the SMA gives equal weight to all price points in the calculation, making it ideal for identifying long-term trend direction and re
FREE
Стрелочный индикатор, выдающий сигнал при пересечении канала боллинждера. Сигналы выдаются в виде стрелок и подходят для торговли бинарными опционами.
Входные параметры Period of BB - период боллинджера Shift of BB - смещение боллинджера Deviation of BB - отклонение боллинджера Inform about finding the signal - параметр, отвечающий за получение уведомлений (Alert) о найденном сигнале. По умолчанию - да
FREE
A professional-grade Bollinger Bands percentage analyzer.
Transform your trading strategies with the BBPCT Indicator, an advanced Bollinger Band Percentage indicator developed by iDevelop.expert. This tool is tailored to provide traders with a clear and actionable visualization of price movements relative to Bollinger Bands, along with insightful overbought and oversold signals.
Key Features: Dynamic Histogram Visualization: A dual-colored histogram for quick identification: Green bars indicat
FREE
RSI magic kjuta trial is the demo version of RSI magic kjuta.
Custom Indicator (RSI magic kjuta) based on the standard (Relative Strength Index, RSI) with additional settings and functions. The maximum and minimum RSI lines on the chart have been added to the standard RSI line. Now you can visually observe the past highs and lows of RSI, and not only the values of the closing bars, which avoids confusion in the analysis of trades. For example, the EA opened or closed an order, but the RSI li
FREE

LPE – Ambiente de Baixa Probabilidade Preço: $0 Plataforma: MetaTrader 5 Tipo: Indicador de Condição de Mercado Visão Geral LPE (Low Probability Environment) é um indicador de condição de mercado projetado para identificar períodos em que a estrutura do mercado e o comportamento do preço são estatisticamente desfavoráveis para decisões de trading de alta confiança. Em vez de prever a direção do preço, o LPE classifica o ambiente atual do mercado. Condições identificadas • Estrutura de mercado co
FREE

*Used by MeditionSeed EA. Meditation is a practice in which an individual uses a technique – such as mindfulness, or focusing the mind on a particular object, thought, or activity – to train attention and awareness, and achieve a mentally clear and emotionally calm and stable state.[1][2][3][4][web 1][web 2] Plant a Meditation Seed to have wonderful future.
FREE
RCH FX Spread + Bar Close Countdown Indicator
What This Indicator Does
A simple, professional tool that displays real-time spread information and bar closing countdown directly
on your MT5 charts.
Key Features
• Real-time spread display - Shows current spread in pips or points
• Bar close countdown timer - Exact seconds remaining until current bar closes
• Customizable alerts - Audio notification before bar closes
• Fully adjustable display - Position, colors, fonts, and sizing options
• Works o
FREE

Volume Steps (Volume as OHLC candles) Volume Steps displays volume as candlestick-style OHLC bars in a separate subwindow. Each candle compares current volume to the previous bar, making volume shifts and step-changes easier to read than standard histograms. Key features: Volume shown as OHLC candles (open = previous volume, close = current volume) Selectable volume type : Tick Volume or Real Volume (if provided by the broker) Two color modes : Match price candle direction (bull/bear) Independen
FREE

Matrix Currency - Ferramenta de Análise Multi-Timeframe O Matrix Currency é um indicador avançado para análise de força das moedas no mercado Forex, projetado para oferecer monitoramento eficiente e suporte estratégico nas suas operações de trading. Características Principais: Análise Multi-Timeframe : Monitora múltiplos períodos simultaneamente (M1 a MN1) com atualização em tempo real em uma matriz intuitiva. Sistema de Alertas : Notificações configuráveis, via pop-up, email e dispositivos móv
FREE

Main Features Calculates average values over a defined number of candles: Average volume Average close price Average candle range Average bullish and bearish candle size Displays current and previous candle statistics (Open, Close, Range, Volume). Provides an instant market summary without opening additional indicator windows. Works on any symbol and any timeframe . ️ Inputs BarsToCheck – number of candles to analyze. TextColor – color of the displayed text. FontSize – text size. (Demo only) D
FREE

Smart Trend Suite Pro – Advanced Trend Indicator with Dashboard & Alerts Overview: Smart Trend Suite Pro is a powerful trend-detection indicator that offers traders a complete set of tools for accurate trend analysis and actionable insights. Designed for versatility and precision, Smart Trend Suite Pro adapts seamlessly to multiple timeframes and market conditions, making it suitable for various trading styles, including scalping and swing trading. Key Features: Real-Time Trend Detection: Identi
FREE

Swap is the part of the cost that is easy to forget, because it arrives once a day, quietly, and never appears in the spread. Swap Cost Calendar puts it on the chart as a number you can act on. What It Shows The panel reads what the broker publishes for the current symbol and shows four things. The cost of one night for a long position and for a short one, in your account currency or in points. The weekday line, showing how many nightly charges a position carries on each day of the week. The tri
FREE

Crypto Position Size Calculator - a free position size calculator built for cryptocurrency traders. Enter your account balance, risk percentage, entry and stop-loss prices, and instantly get the exact position size for BTC, ETH and any other crypto symbol your broker offers. Crypto prices move fast and vary wildly between coins, so a fixed position size can mean wildly different risk from one trade to the next. This calculator measures the distance to your stop in the coin's own price and conver
FREE

Multi Spread Panel is a practical MetaTrader 5 indicator that displays the live spread of multiple symbols in one compact panel directly on the chart. It is designed for traders who want to monitor trading costs quickly and clearly without switching between multiple charts or Market Watch windows. You simply enter the symbols you want to track, and the indicator shows their current spread in a clean table format. The panel is especially useful for: spread monitoring before trade entry comparing
FREE

The Luta Volatility Meter is an essential technical indicator for traders in MetaTrader 5 (MT5). It was developed by Eng. Lutandula to clearly measure and visualize market movement, helping you easily identify high and low volatility periods. By calculating the average daily trading range, this tool offers a simple yet powerful way to gauge market activity and potential movement for better trade timing Key Advantages Optimal Trade Timing: Helps you identify whether the market is slow (low vol
FREE
The Commitments of Traders Ratio Indicator is one of these things you never thought about it before you really see the magic behind it. The indicator shows the Ratio of long/short positions released by the CFTC once a week.
If you have a look on the Sreenshot you can see two (three) zones of interest. Important note: MAs are not available in version 1.0. Zone 1: The Switches (Red -> Green, Green -> Red) Zone 2: MA cross Zone 3: If you combine this with the COX indicator an additional zone will
FREE

[New Era of Speed] Canvas Engine Powered Tick-Chart We have fundamentally redesigned the chart rendering system, fully migrating to a custom Canvas engine . This achieves an ultra-high-speed response equivalent to a raw tick chart , a level of performance impossible for standard indicators. Key Updates: Evolution to Canvas Rendering By minimizing the rendering load to the extreme, every micro-movement of each tick is captured in real-time. Experience a "silky smooth" interface with zero lag.
FREE
Custom ATR Indicator for Horizontal Levels Trading The Custom ATR Indicator is a powerful tool designed for traders who rely on horizontal levels and understand the importance of the Average True Range (ATR) in making informed trading decisions. This indicator calculates the ATR based on a customizable number of bars, filters out abnormal bars (too large or too small), and provides clear visualizations of key data, including ATR values, Stop Loss levels, and price movement percentages. Key F
FREE
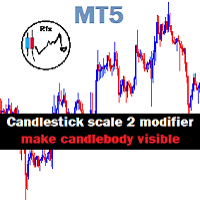
Chart Candlestick scale 2 zoom will visible instead of just a tiny unrecognized line make it look neat and tidy Instruction.
If you don't like the candles colors, you can do so by changing color. read below:
-Colors must be changed in the indicator setting.
-It won't change through the Chart properties to modify.
-After changing the color, save it as template so it wont change the colors to default value.
FREE

Standard PVSR is based on Pivot Points.
Steps to Setup the Indicator: Install the Custom Indicator; Set all the Lines Color, Width and Styles; Set visualization to All Timeframe; and DONE
It can be used for: All Pairs: Forex, Cryptocurrencies, Metals, Stocks, Indices etc. All Timeframe All Brokers All type of Trading Style like Scalping, Swing, Intraday, Short-Term, Long-Term etc. Multiple Chart
-->> For any Type of Support, Guidance, Setup Issue, EA Optimization, Input Setup etc. etc
FREE

Moving Spread – Monitor de Custo de Mercado em Tempo Real Monitore o spread médio em tempo real e evite operar em períodos de alto custo. O que este indicador faz? O Moving Spread mede o spread médio (em pontos) do mercado em tempo real, mostrando como ele varia ao longo do tempo. É uma ferramenta essencial para traders que querem entender quando o custo de entrada é muito alto, pois isso pode corroer seus lucros ainda antes da operação começar. Por que isso importa?
Um spread alto signi
FREE
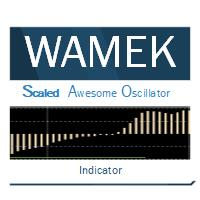
The Scaled Awesome Oscillator (SAO) represents a refined adaptation of the Awesome Oscillator, aimed at establishing consistent benchmarks for identifying market edges. Unlike the standard Awesome Oscillator, which records the variation in pips across different commodities, the only unchanging reference point is the zero line. This limitation hampers investors and traders from pinpointing specific levels for trend reversals or continuations using the traditional Awesome Indicator, a creation of
FREE
" Currency Strength Tool " is a straightforward and user-friendly indicator designed for analyzing the strength of eight major currencies based on daily price changes of currency pairs. It displays information compactly on the chart in three rows, providing traders with insights into current market dynamics. The indicator serves as an analytical tool, aiding in making informed trading decisions.
It appears as follows: -7.3% 0.5% 0.2% 6.4% 1.2% 3.2% 4.1% 0.4% (daily change) USD E
FREE

Based on two MA line indicators.
Looking at the histogram, if the value is greater than 0, the uptrend will increase, the bigger the value, the stronger the uptrend will be and vice versa, if the value is less than 0, the downtrend will decrease, the smaller the value, the stronger the downtrend . The necessary condition when entering a buy order is that the first histogram is greater than 0 and the current candle is closed, and enter the order when the second histogram appears. The necessary
FREE

HARRAZ HUD BASIC - Your Gateway to Neural Trading Welcome to the future of market analysis. Harraz HUD Basic offers a glimpse into our advanced Artificial Intelligence trading ecosystem, designed to give you a clean, modern, and highly responsive Heads-Up Display directly on your MetaTrader 5 charts. CORE FEATURES (BASIC EDITION): 1. Live Neural AI Typewriter (Jarvis Mode) Experience an animated, real-time Heads-Up Display that types out market sentiment. It reads the underlying momentum
FREE

Indigo Indicator by Quant Atlas Creator: https://www.quant-atlas.com/ Indigo Indicator is a clean reversal focused trading tool designed to identify potential turning points through a price sequence framework. The indicator studies how price has behaved across multiple prior reference points and highlights moments where that sequence may be shifting. When conditions align, it plots indigo triangle signals directly on the chart. Both bullish and bearish signals use the same indigo visual identit
FREE

VWAP Indicator — Version 2.0 By Tonic Investment The VWAP Indicator (Volume Weighted Average Price) by Tonic Investment provides a precise and configurable visual representation of VWAP across multiple institutional time horizons. Designed for professional traders and systematic strategies, the indicator allows users to analyse price positioning relative to volume-weighted market value throughout different trading cycles. VWAP is widely used by institutional participants to evaluate execution qu
FREE

O indicador ATR Finder para MT5 é uma ferramenta poderosa projetada para ajudar os traders a analisar a volatilidade do mercado usando o Average True Range (ATR) . Este indicador calcula e exibe os valores do ATR dinamicamente, permitindo identificar períodos de alta e baixa volatilidade, otimizar os níveis de stop-loss e take-profit e aprimorar a estratégia de negociação.
Principais recursos: • Cálculo do ATR em tempo real – atualiza continuamente os valores do ATR conforme as condi
FREE
Este indicador é capaz de determinar os níveis de preços nos quais houve o maior volume durante o período especificado da história. No futuro, o preço costuma saltar desses níveis e isso pode ser aplicado com sucesso na negociação. Eles são exibidos como linhas, alguns parâmetros para determinar os níveis podem ser ajustados. Este indicador é uma versão gratuita do Volume Levels MT5, por isso não fornece sinais e a construção dos níveis está limitada a um par de moedas EUR / USD. Para todos os
FREE

The indicator draws a colored histogram from comparisons of the strengths of bulls and bears.
It works like this:
The values of two indicators Bears and Bulls are taken, who is stronger on the candlestick is compared, the column is filled in. It's all.
.
FREE

Fractals Aydmaxx 2024 Overview: Fractals Aydmaxx 2024 is a custom indicator designed for the MQL5 trading platform, developed by Aydmaxx. This indicator identifies and displays fractal patterns on your trading chart, which are essential for recognizing potential market reversals. The indicator highlights both bull and bear fractals, making it easier for traders to spot key levels of support and resistance. Features: Customizable Fractals: Allows the user to set the number of bars on the left and
FREE

AP HELPER LIGHT is a simplified version of the AP HELPER indicator for MT5. It displays support/resistance levels and a price projection line on the chart, which can be toggled on and off directly from the panel buttons. The compact info panel shows the current global H4 trend and the local trend, along with their strength as a percentage. The indicator helps quickly assess the price direction and the nearest key levels without cluttering the chart with unnecessary information.
For all question
FREE
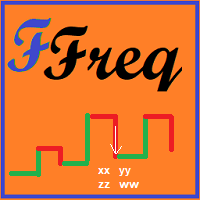
Este indicador simples cria um ZigZag baseado na frequencia de mercado. Pode ser muito util para quem opera TapeReading. Alterne entre os vários timeframes e observe que o ZigZag será mantido, isto acontece devido ao método utilizado para criar um indicador atemporal. Defina o principal parâmetro de entrada: nTicks: Número de Ticks para inversão de frequencia Os demais parâmetros são somente de aspectos visuais, tente-os.
FREE
O indicador é uma ferramenta desenvolvida para o MetaTrader, projetada para auxiliar na análise detalhada do comportamento do preço em relação a uma média móvel específica. Ao ser anexado ao timeframe diário, o ele realiza cálculos e monitora, em timeframes menores, quantas vezes o preço toca determinados níveis de afastamento durante o dias além de calcular a média dos toques.
MT4: https://www.mql5.com/pt/market/product/111706
FREE

# Power Assisted Trend Following Indicator
## Overview
The PowerIndicator is an implementation of the "Power Assisted Trend Following" methodology developed by Dr. Andreas A. Aigner and Walter Schrabmair. This indicator builds upon and improves J. Welles Wilder's trend following concepts by applying principles from signal analysis to financial markets.
The core insight of this indicator is that successful trend following requires price movements to exceed a certain threshold (typically a mul
FREE

The simplest indicator. It emits a standard sound signal (an audio file from the standard MetaTrader library - alert.wav) after a period of time you select. Unfortunately I was unable to add the ability to select your file due to language restrictions. Fixed a bug: when switching TF, a complete reinitialization of the indicator occurred, and it thought that a new time interval had arrived
FREE

MT5 All Icons is a high-utility developer tool designed to simplify the visual customization of indicators and Expert Advisors. It provides a comprehensive, interactive reference table of all 255 Wingdings symbols directly within a separate chart subwindow. Instead of guessing character codes or looking up external charts, this tool allows you to see every available icon, its visual representation, and its corresponding ID number in real-time. Key Features: Full Library Access: Displays the com
FREE

# az_session_atr — Инструкция по настройкам
## Что показывает индикатор Индикатор показывает ATR для каждой сессии по отдельности. Если вы торгуете исключительно Европу - то иногда нет смысла смотреть на обычный дневной ATR Для каждой из трёх торговых сессий (Азия, Европа, Америка) отображается строка вида:
``` Asia ATR(20): 42.3 | Move: 18.7 (44%) | Left: 23.6 ```
| Поле | Значение | |---|---| | `ATR(20)` | Медианный ATR за 20 торговых дней | | `Move: 18.7 (44%)` | Сколько пипсов прошла ц
FREE
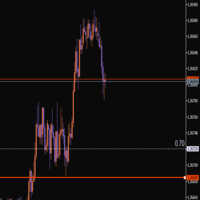
This indicator helps you set and adjust your stop-loss levels. Just move the line to where you usually place your stop, and a second line will automatically appear at a specified distance between the current price and your chosen level. Review your trades on historical data Measure the maximum drawdown from entry to exit Get data that allows you to optimize your stop-loss placement It’s a convenient way to train yourself to use more optimal stops, based on your own trading statistics.
FREE
В стандартном индикаторе DeMarker используется простая скользящая средняя - Simple Moving Average, что несколько ограничивает возможности этого индикатора. В представленном индикаторе DeMarker Mod добавлен выбор из четырех скользящих средних - Simple, Exponential, Smoothed, Linear weighted, что позволяет существенно расширить возможности данного индикатора. Параметры стандартного индикатора DeMarker: · period - количество баров, используемых для расчета индикатора; Параметры индикат
FREE
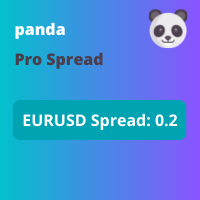
This indicator displays the spread with extra options Simple and easy to use and fully customisable: View as Pips or Pipettes Chart symbol can be hidden Text display can be changed Change colour and text styles Add or hide a decimal point Spacing options between inputs Default screen positions Screen position inputs
Pro version includes: Drag and drop box on the screen Add an alert when the spread is too high Alert colours for text and text box changeable
How to use 1. Simply use the default
FREE

Session & Spread HUD A lightweight display utility that places a real-time information panel in the top-right corner of any chart. No trading logic, no alerts — just clean, always-visible data while you trade. What It Shows The HUD displays four pieces of information, updated on every tick: Session — The currently active trading session based on your broker's server time. Automatically identifies Asia, London, New York, and the London/NY overlap. Displays "Closed" outside all sessions. Spread —
FREE

Account Monitor Pro — Your Ultimate Trade Statistics Hub Account Monitor Pro is a professional information dashboard designed for traders who combine Expert Advisors (EAs) and manual trading. The indicator separates statistics in real-time based on your Magic Number, allowing you to clearly see who is driving the profit: the algorithm or yourself. Key Features: Split Monitoring: Instant separation of "Robot" positions (by Magic Number) and "Manual" trades. Multi-language Support: 11 languages in
FREE

นี่คือคําอธิบาย Trend SAR Fusion PRO MT5 (เวอร์ชัน Stable) จากโค้ดที่คุณใช้
แนวคิดของอินดิเคเตอร์ อินดี้ตัวนี้ = รวม 3 อย่าง EMA10 (เร็ว) → จับโมเมนตัม EMA100 (ช้า) → จับเทรนหลัก SAR (จุดดอท) → ใช้เข้า/ออก สรุป: "ใช้ SAR เป็นตัวเข้า แต่ให้ EMA คัดกรองว่าเข้าเทรนจริงไหม" วิธีดูสัญญาณ (สำคัญสุด) เทรนขึ้น EMA10 > EMA100 จุด SAR อยู่ "ใต้ราคา" จะเห็น จุดเขียว
เข้า BUY ได้ เทรนลง EMA10 < EMA100 จุด SAR อยู่ "เหนือราคา" จะเห็น จุดแดง
เข้า SELL ได้ ช่วงเปลี่ยนเทรน ม
FREE

【SecMode Series】SecModeCMO – High‑Resolution Tick‑Based CMO Indicator Overview SecModeCMO is part of the SecMode Series , a next‑generation suite of indicators designed to reveal the micro‑structure of price action at the tick/second level —a level of detail that traditional 1‑minute indicators cannot capture. While standard indicators refresh only once per minute, SecModeCMO uses a proprietary second‑level engine to: Update up to 60 times per minute (or at user‑defined intervals) Visuali
FREE
Automatize sua Estratégia! Use o Expert Advisor Daily Drop Analyzer para executar automaticamente a estratégia, com filtros, parâmetros configuráveis e gerenciamento de ordens.
Confira aqui: Daily Drop Analyzer EA
Daily Drop Analyzer é um indicador técnico para MetaTrader 5 que realiza testes históricos baseados em quedas percentuais diárias. Ele analisa até 200 ativos do Market Watch para identificar níveis de entrada recorrentes dentro de uma faixa configurável. O cálculo utiliza candles di
FREE

Full Description (Professional MQL5 Version) Psychology Guard Pro is a powerful MetaTrader 5 indicator that protects traders from emotional trading decisions by monitoring equity changes and excessive trading activity. This tool is ideal for forex traders, prop firm challenge participants, scalpers, and grid traders who want better psychological control and structured risk management. Key Features Equity-Based Psychology Alerts Displays a STOP Trading alert when loss exceeds a defined pe
FREE
KN DASHBOARD PRO – Smart Dashboard ️ Everything is displayed live on the chart: Give me a rating please
Number of open trades (Buy / Sell)
Total lot size
Daily, weekly, and monthly profit
Margin, balance, liquidity, and floating profit
Accurate real-time results monitoring system
This gives you complete control over performance without opening your trading history.
A quick breakdown of the indicator's function: This indicator displays a dashboard on the chart containin
FREE
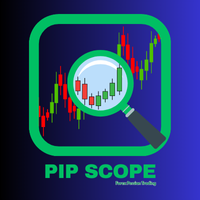
Pip Scope – Accurate Chart Perception for Smarter Trades The Problem:
MetaTrader automatically adjusts the vertical scale of charts to keep all candles visible. While this is helpful for keeping price action on screen, it can distort your perception of movement size. A small move may suddenly appear huge, while a large move may look minor. This can mislead traders—especially scalpers and intraday traders—into poor risk assessment, incorrect position sizing, and misplaced stop-loss levels. T
FREE

Wikirobo | Smart Entry Zone Indicator for All Timeframes Wikirobo is a powerful indicator that automatically highlights potential entry zones as Buy Limit and Sell Limit orders across all timeframes. Highlights Suggested entry zones for every timeframe ️ Clear, timeframe-specific Stop Loss levels shown on the chart for better risk management and position sizing Suitable for scalpers, day traders, and swing traders —flexible for any trading style How to Use Instea
FREE

XFlow shows an expanding price channel that helps determine the trend and the moments of its reversal. It is also used when accompanying transactions to set take profit/stop loss and averages. It has practically no parameters and is very easy to use - just specify an important moment in the history for you and the indicator will calculate the price channel. This is a demo version limited to CHF currency pairs. Designed to familiarize you with the interactive use of XFlow DISPLAYED LINES ROTATE
FREE
Only Exponential Moving Average at Close Price is used in standard Bulls Power limiting the possibilities of that indicator to some extent. Bulls Power Mod enables you to select from four Moving Averages and seven applied prices, thus greatly expanding the indicator's functionality.
FREE

Global Session 4X Indicator O Global Session 4X é um indicador visual que exibe em tempo real as sessões de negociação Forex ao redor do mundo. Desenvolvido com atenção aos detalhes e respeito à diversidade dos mercados, ele cobre centros financeiros como Londres, Nova York, Tóquio, Sydney, São Paulo, Istambul, Riyadh, Toronto, entre outros. Cada sessão é representada por uma faixa colorida e informativa, destacando os pares de moedas mais negociados em cada região. O layout é moderno, limpo e p
FREE
STRUCTURAL TREND LINES - MT4/MT5 Indicator
Simple indicator that automatically draws trend lines based on market structure.
Features:
- 3 degrees of structure detection (short, medium, long term)
- Configurable swing strength for each degree
- Single color per degree for clean visualization
- Adjustable number of lines per degree
- Customizable colors and line widths
How it works:
The indicator identifies swing highs and lows based on the strength parameter,
then connects these points to crea
FREE

Indicador Regressão Linear – Par de Ativos Indicador é um oscilador que faz o plot do Resíduo resultado da regressão linear entre os dois ativos inseridos como input do indicador, representado pela fórmula: Y = aX + b + R Onde Y é o valor do ativo dependente, X é o valor do ativo independente, a é a inclinação da reta entre os dois ativos, b é a intersecção da reta e R é o resíduo. O resíduo representa a quantidade da variabilidade que Y que o modelo ajustado não consegue explicar. E os resíduos
FREE
O mercado MetaTrader é um espaço, sem precedentes, para negociar robôs e indicadores técnicos.
Leia o artigo Manual do usuário da MQL5.community para saber mais sobre os serviços exclusivos que oferecemos aos traders: cópia de sinais de negociação, aplicativos personalizados desenvolvidos por freelances, pagamentos automáticos através de sistema de pagamento e a rede em nuvem MQL5.

Você está perdendo oportunidades de negociação:
- Aplicativos de negociação gratuitos
- 8 000+ sinais para cópia
- Notícias econômicas para análise dos mercados financeiros
Registro
Login
Você concorda com a política do site e com os termos de uso
Se você não tem uma conta, por favor registre-se