Conheça o Mercado MQL5 no YouTube, assista aos vídeos tutoriais
Como comprar um robô de negociação ou indicador?
Execute seu EA na
hospedagem virtual
hospedagem virtual
Teste indicadores/robôs de negociação antes de comprá-los
Quer ganhar dinheiro no Mercado?
Como apresentar um produto para o consumidor final?
Expert Advisors e Indicadores para MetaTrader 4 - 43

Description The BBMA + EMA50 Structure is a basic BBMA trading framework indicator combined with EMA 50 and First Momentum detection .
It helps traders to quickly identify market structure, momentum shifts, and potential entry points with clear visual signals. Key Features: BBMA Structure : Displays the essential Bollinger Bands + Moving Average framework. EMA 50 Filter : Helps confirm trend direction and structure bias. First Momentum Detector : Automatically detects the first momentum breako
FREE
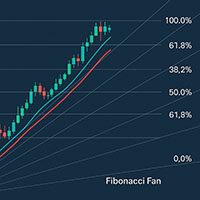
Indicator Description "Double Moving Averages with Fibonacci Fan" is a powerful MetaTrader 4 (MT4) tool designed to enhance trend analysis by combining: Two customizable Moving Averages (MA1 & MA2) for dynamic crossover signals. Fibonacci Retracement Levels to identify key support/resistance zones. Fibonacci Fan for projecting trend direction and potential reversal angles. Key Features: Dual MA System – Track short-term vs. long-term trends (e.g., EMA 9 + SMA 21).
Smart Alerts – Popup, email
FREE
Questo indicatore avanzato è un potente strumento progettato per aiutare i trader a identificare i livelli chiave di supporto e resistenza nel mercato. Questo indicatore è versatile e offre un'interfaccia personalizzabile e intuitiva, consentendo ai trader di scegliere tra sei diversi metodi di calcolo del punto pivot: Classic, Camarilla, Woodie, Floor, Fibonacci, Fibonacci Retracement.
FREE

The Colored MACD indicator is a versatile and powerful tool designed to enhance your technical analysis by providing an intuitive visualization of market momentum and trend changes. Built on the foundation of the popular Moving Average Convergence Divergence (MACD) indicator, this version introduces color-coded histograms to easily distinguish between bullish and bearish momentum. Key Features: Color-Coded Visualization : The indicator features a lime-colored histogram when the MACD is above the
FREE

This is a free version of the EA TrendSurfer OsMa https://www.mql5.com/en/market/product/104264 TrendSurfer OsMa receives signals from a technical analysis of in-built MetaTrader 4 indicator Oscillator of a Moving Average (OsMA) and then implements The Quantum Forex Trading System to generate positive results. Discover: The Quantum Forex Trading System _Mastering the Market with Advanced Algorithms & Multifaceted Strategies_ --- Redefining Forex Trading: In the vast realm of forex, wh
FREE

The indicator gives buy or sell signals based on the Parabolic SAR indicator, and it also contains strategies with Moving Average. There are alerts and alerts to the mobile terminal and to the mail. Arrows are drawn on the chart after the signal is confirmed. They don't redraw. I recommend watching my advisor - Night Zen EA
To keep up to date with my latest products and ideas, join my telegram channel and subscribe to my profile. The link in my profile contacts - My profile The indicator in
FREE

The Signal Premium Pro System SMART ANALYZER SYSTEM V3 (2025) – Next Generation Market Intelligence for Traders Smart Analyzer System V3 is a professional trading indicator for Forex, Gold (XAUUSD), and Indices. It provides real-time buy/sell signals, automatic levels, multi-timeframe analysis, and adaptive trading modes for scalping, intraday, and swing strategies. Trade smarter with precision, clarity, and confidence.
forex indicator, xauusd, gold trading, mt4 indicator, mt5 indicator,

RoundNumbers indicator is a simple and powerful psychological price levels. Trader usually use these levels as a Support and Resistance (SnR). Indicator Input: Levels - Numbers of levels drawn on chart. Default 30 levels. BoxSize - Box size drawn on each levels, indicate buffers around levels. Default value 1pips (10point) above and below each levels. ZoneSize - Distance between each levels, default value 10pips (100point). Style & Colours - User inputs customization.
For MT5 version, please re
FREE
XXXX ATR (Average True Range) Position Manager: ATR StopLoss, ATR Target, ATR Breakeven, ATR Trailing StopLoss, with Risk % Calculation / Position.
More about ATR: www.atr-trading.com
Key takeaways One click does it all: SELL and BUY button automatically places ATR stoploss, ATR target, ATR breakeven, ATR trailing stop and Risk % calculation of equity Entire position is calculated based on ATR No more manual position calculations = No more wasted time = No more late entries Position siz

H I G H - P R O B A B I L I T Y - B R E A K O U T T R E N D L I N E I N D I C A T O R This is no ordinary trendline indicator. It has a highly-probability algorithms incorporated in the script to display only trendlines that may give a very high chance of price breakout. The indicator is not a stand alone indicator. Trader should interpret it together with their very own analysis technique to come up with a more efficient trading strategy. You can use with it other trend indica
FREE

AdvaneZigZag Indicator
Are you tired of the limitations of the traditional ZigZag indicator? Meet AdvaneZigZag, the ultimate tool to simplify your market structure analysis and enhance your trading strategies. Designed with flexibility and precision in mind, AdvaneZigZag brings you advanced features to navigate the market with confidence.
Key Features:
1. Enhanced Flexibility:
- While maintaining the familiar simplicity of the conventional ZigZag indicator, AdvaneZigZag offers superior a
FREE

This indicator plots another symbol on the current chart. A different timeframe can be used for the symbol, with an option to display in multiple timeframe mode (1 overlay candle per several chart candles). Basic indicators are provided. To adjust scaling of prices from different symbols, the overlay prices are scaled to the visible chart price space.
Features symbol and timeframe input MTF display option to vertically invert chart, eg overlay USDJPY, invert to show JPYUSD
data window values; o
FREE

An indicator for visualizing time ranges of key trading sessions: Asian, European, and American. The indicator features functionality for setting the start and end times of each trading session, as well as an adjustable timezone of the trading server. The main advantages of the indicator include the ability to operate with minimal CPU load and memory usage. Moreover, it offers the option to specify the number of displayed historical days, providing the user with flexible market dynamics analysis
FREE

The Supertrend draws a line following the current trend.. Green Line under the candle means a likely bullish trend Red Line above the candle means a likely bearish trend
How to trade with SuperTrend indicator Buy when the Supertrend Green line is below the price, Sell when the Supertrend Red line is above the price. It is strongly suggested to use this indicator in a trending market.
Parameters Multiplier - the lower it is and the more sensitive is the line, meaning it will follow the price mo
FREE

This indicator is designed for binary options. Based on proprietary divergence of the CCI indicator. A sell signal: A down arrow appears on the chart. A buy signal: An up arrow appears on the chart.
Input parameters History - the number of bars in history for calculation Period CCI - period of the CCI technical indicator Up border - overbought limit for calculation of the divergence Down border - oversold limit for calculation of the divergence Price - price for the indicator calculation Alerts
FREE

This Expert Advisor analyzes the last candles and determines whether there will be a reversal or a large correction. Also, the readings of some indicators are analyzed (their parameters can be adjusted). Is a free version of Proftrader . Unlike the full version, in the free version of the adviser the initial lot cannot be higher than 0.1, trading pair only EURUSD and also it has fewer configurable parameters. Input parameters
Lots - lot size (at 0, the lot will be calculated from the percentage
FREE
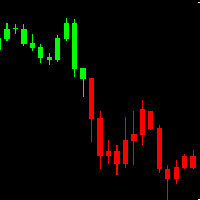
AH Candles MT4 AH Candles MT4 is a new product that allows identifying the current market phase (uptrend and downtrend ).
This indicator paints bars in different colors depending on the current state of the market trend ( Green and Red )
AH Candles MT4 is use for trading currencies
Advantages Suitable for intraday and swing trading. The indicator base on EMA method to calculate Period Parameters It can be used as a standalone tool or together with other indicators.
How to use the prod
FREE

The Multi Trendlines indicator automatically draws the dominant trendlines on the current chart. The indicator looks for the 5 best Up trends and the 5 best Down trends as at the current price, drawing each trendline if filter conditions are met. The trendlines are named "Trendline"+[Direction]+Symbol()+TrendlineSequenceNumber For example: The second Up trendline on a EURUSD chart would be named "TrendlineUpEURUSD2". To get its current value would be: ObjectGet("TrendlineUpEURUSD2",OBJPROP_PRI
FREE

Trend is Friends is an line Indicator used as an assistant tool for your trading strategy. The indicator analyzes the standard deviation of bar close for a given period and generates a buy or sell trend if the deviation increases. It good to combo with Martingale EA to follow Trend and Sellect Buy Only/Sell Only for EA work Semi-Automatic. You can use this Indicator with any EAs in my Products.
FREE
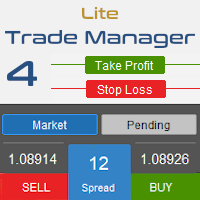
Trade Manager 4 Lite is trading panel developed with a goal to make manual trading in some (routine) task easier.
Trade Manager 4 Lite also works in Strategy Tester. Version for Meta Trader 5 is here: Trade Manager 5 Lite
Main features of Trade Manager 4 Lite Trading for Forex and CFDs Support for 4 and 5 digit brokers 65 combinations to set order Set Take Profit, Stop Loss and entry level for Pending Order with lines positioned on the chart Break Even Trailing Stop Loss Multiple Orders at one
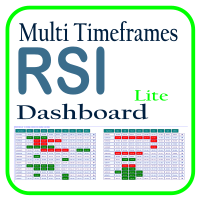
Optimize your trading analysis with the RSI Multitimeframe Dashboard, a powerful tool designed to streamline RSI monitoring across all timeframes and symbols listed in your Market Watch. This dashboard delivers real-time insights and alerts, making it essential for traders who rely on RSI to identify potential market entries and exits. Key features include: Comprehensive RSI Overview : Instantly view RSI values for every timeframe across all Market Watch symbols, making multi-timeframe analysis
FREE

This indicator displays each bar's volume in points as a histogram. The second version of the indicator. Now it is represented as an oscillator. It is more informative and functional. At that it does not load the main chart. GitHub It displays: bar's volume in points as a histogram (buffer 0) average value of the volume for the whole period (buffer 1) bars upper than the client average value with another color (buffer 2) average value of the amount of bars set by a user (buffer 3) Also: setting
FREE
O indicador permite determinar instantaneamente a tendência atual por cor e níveis de Fibonacci. O painel HTF mostra a tendência atual de períodos mais altos, ajudando a determinar a força da tendência. Negocie na tendência ao mudar a cor das velas ou negocie contra a tendência quando o preço rompe os níveis extremos do indicador FIBO Trend PRO Benefícios do FIBO Trend PRO: O indicador nunca repinta ou altera seus valores Muito fácil de usar e intuitivo Aplicável a qualquer símbolo: FX-moedas, a

Info: marcobarbosabots CCI Warrior
CCI é a abreviação do indicador Commodity Channel Index . O CCI Warrior é um Expert Advisor que gera sinais através de níveis CCI ( Commodity Channel Index ). Um valor acima do nível positivo gera um sinal SELL e abaixo do nível negativo gera um sinal BUY. Quando um sinal é gerado um Filtro MA checa ele. Se o sinal estiver na mesma direção da Tendência indicado pelo Filtro MA, então o sinal é validado. Depois de validado uma Ordem é enviada. Por fim um gati
FREE
This EA strategy is result of professional experienced traders demand for trading technique and quality. It has three built-in indicators: ATR to measure oscillation, Bollinger Bands and Moving Avarage to measure Trends. It has some protections like Trailing Stop Loss to protect your profits an Spread limitator to protect your equity and finally an stopout level that you may define by an minimum equity percentage.
General Inputs Closes orders with any profit of value over in currency: this para

This EA is designed to monitor the slippage of opening and closing orders, and save the records in files. It is useful to record the slippage and evaluate brokers. The record files are saved in the folder MT4_Data_Folder\MQL4\Files. Go to "File " --> "Open Data Folder" . Warning : Do NOT open the files directly, otherwise it will affect the exectution of EA, just copy them to another folder and open them.
Usage: Open a chart and load the EA on it, just need only one EA to run, it monitors al
FREE
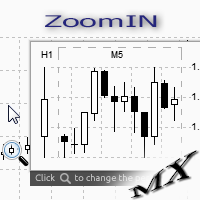
The ZoomIN indicator is designed for quickly viewing the selected bar on the smaller timeframes in a pop-up window. Once launched, the indicator works in the background, does not take up space on the chart and does not consume system resources. When the indicator is activated by the Shift + i combination (can be changed in the settings), a pop-up window with a chart of a smaller timeframe is created. The displayed timeframe can be changed by a left-click on the magnifying glass icon. To hide the
FREE

Hermes Trend
Concebido para utilização profissional, apresenta uma lógica de sinal robusta e cálculos seguros que eliminam atrasos ou atualizações falsas.
Não redesenha, elimina ou modifica sinais anteriores.
Todos os sinais são gerados diretamente no candle e permanecem fixos.
Nas negociações reais, não há redesenho — os sinais surgem instantaneamente no próprio candle.
Oferece estabilidade, precisão e flexibilidade de nível profissional.
O sistema identifica com precisão as
FREE

APP System Signals é um indicador técnico desenvolvido para usuários ativos nos mercados financeiros. Ele utiliza uma combinação de médias móveis exponenciais (EMA), médias móveis simples (SMA) e análise de tendência para gerar sinais de compra e venda com base no comportamento histórico dos preços e na estrutura do mercado. Todos os parâmetros do indicador são totalmente personalizáveis, permitindo que o usuário adapte a ferramenta ao seu estilo de análise e preferências individuais. Pode ser u
FREE

The "MACD Trend Follower" is an indicator based on the MACD oscillator. It serves to spot the trend direction by giving it a fixed color until the trend changes (the trend direction colors are customizable). The default MACD settings for the indicator has been changed to adapt to the fast moving Forex market, but they can be changed to suit the trader.
Recommended settings for the indicator : - MACD Fast EMA : 8 Periods. - MACD Slow EMA : 13 Periods. - MACD SMA : 5 Periods.
Indicator inputs :
FREE

Idioteca FTU O indicador é para a plataforma MT4, pode ser usado sozinho, mas é melhor combinado com outros indicadores ou estratégias Combina vários indicadores como macd, adx para desenhar uma seta para sugestão de entrada ou mudança de tendência Assista a um breve vídeo de introdução no youtube: https://youtu.be/lCRJ3mFNyOQ Recursos do indicador: Setas de venda e compra Alerta visual e sonoro Continuação da tendência/sinal inicial de mudança de tendência Novas características: Limite à quant
FREE
Apresentando o Indicador de Desenho no Gráfico: Libere sua Criatividade nos Gráficos!
Você está cansado de lutar para fazer anotações em seus gráficos de negociação, tentando dar sentido à sua análise ou comunicar suas ideias de forma eficaz? Não procure mais! Temos o prazer de apresentar o Indicador de Desenho no Gráfico, uma ferramenta inovadora que permite que você desenhe e faça anotações em seus gráficos com apenas alguns cliques ou traços de sua caneta.
Nosso inovador Indicador de Desen
FREE

Melhore sua experiência de trading com o indicador Your Chart! Esta ferramenta gratuita e altamente personalizável permite que os traders combinem vários períodos de tempo em uma única exibição limpa de velas, sem alterar o gráfico original. Com o Your Chart, você pode ajustar o número de barras por cada vela personalizada – por exemplo, combinar cada 18 velas de M1 em uma só para ter uma visão mais ampla das tendências do mercado. Características principais: Formação de velas personalizadas : E
FREE
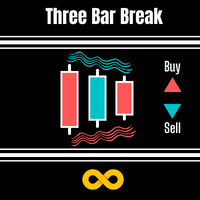
DESCRIPTION 3 Bar Break is based on one of Linda Bradford Raschke's trading methods that I have noticed is good at spotting potential future price volatility. It looks for when the previous bar's High is less than the 3rd bar's High as well as the previous bar's Low to be higher than the 3rd bar's Low. It then predicts the market might breakout to new levels within 2-3 of the next coming bars. Must also be traded during the active hours of the market you want to trade. EG EURUSD 7am - 5pm This
FREE
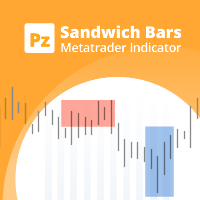
Spot high-probability trades: sandwich bar breakouts at your fingertips This indicator detects Sandwich Bars of several ranges, an extremely reliable breakout pattern. A sandwich setup consists on a single bar that engulfs several past bars, breaking and rejecting the complete price range. [ Installation Guide | Update Guide | Troubleshooting | FAQ | All Products ] Easy and effective usage Customizable bar ranges Customizable color selections The indicator implements visual/mail/push/sound aler
FREE
Ultimate Volatility Insight is a highly professional tool for analyzing and fully understanding market activity based on an advanced ATR with improved algorithms and calculation formulas. The indicator helps traders accurately assess market dynamics, identify key support and resistance levels, and effectively manage risks. Ultimate Volatility Insight works only with real data using live statistics. The indicator has been developed for over two years, and its effectiveness has been proven through

Versão gratuita da estratégia de grade! Estratégia idêntica à versão completa, a única limitação é o número de posições. Seu objetivo é colher o máximo da tendências do mercado (em modo automático) aproveitando correções em tendências. Também pode ser usada por profissionais experientes em negociação manual. Este tipo de sistema está sendo usado pelos melhores traders sociais que têm mais de 500 assinantes pagos. Combine a sua experiência de negociação com esta estratégia automática! Ele contém
FREE

Título do produto Smart Fractals (MT4) – parte da série SmartView Descrição breve Indicador Fractals com experiência de usuário única na plataforma MetaTrader. Oferece capacidades avançadas não disponíveis anteriormente, como abrir configurações com duplo clique, ocultar e mostrar indicadores sem excluí-los, e exibir a janela do indicador em tamanho completo do gráfico. Projetado para funcionar perfeitamente com o restante da série SmartView Indicators. Visão geral A série SmartView oferece uma
FREE

Esta é uma EA semi automática , não utiliza nenhum tipo de indicadores e os parâmetros são simples .
Incluindo por uma ordem mestre (primeira ordem que você carrega no gráfico de compra ou venda) e você pode usar duas ordens invertidas para hedging.
Pedido principal : Chamado de ordem inicial ( quando atingido SL a EA pára de negociar até que você reinicie no gráfico ) .
Primeira ordem reversa : É aberta ao contrário da ordem principal na distância desejada do pip .
Seg
FREE

Powerful non-repainting tool for intraday or swing tading, part of the Power Lines Trading System, used in real trading on a daily basis with proven solid trading signals. The Power Lines indicator is pretty straightforward and easy to set up and can be used perfectly on every timeframe and with every currency pair or other financial instrument. For intraday trading the using of M5, M15 or M30 timeframes and for swing trading H1, H4 or D are recommended. Avoid M1 and be careful with M5 timeframe
FREE
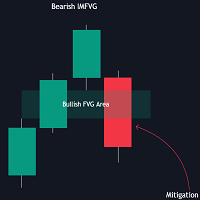
The FVG Instantaneous Mitigation Signals indicator detects and highlights "instantaneously" mitigated fair value gaps (FVG), that is FVGs that get mitigated one bar after their creation, returning signals upon mitigation.
Take profit/stop loss areas, as well as a trailing stop loss are also included to complement the signals.
USAGE Figure 1 Instantaneous Fair Value Gap mitigation is a new concept introduced in this script and refers to the event of price mitigating a fair value gap one

MA MTF Overlay Chart is software that allows you to overlay the candlestick chart of a financial instrument with a second candlestick chart of the same one, or of another, financial instrument, by setting a different timeframe from that of the basic chart. The software is very simple to use and the input parameters are listed below.
Input parameters: Overlay chart set-up Financial instrument : financial instrument that you want to overlay on the base chart Time period : secondary instrume
FREE

ZRP TFMS AutoProtect Scalper
ZRP TFMS AutoProtect Scalper is a fully automated trading system designed for scalping and short-term trading on major forex pairs.
It integrates trend, volatility, and momentum filters to ensure trades are opened only during high-probability conditions. The EA includes a smart AutoProtect system that moves Stop Loss automatically to secure profit once the trade is in gain, preventing small winners from turning into losers. This system is ideal for traders who prefe
FREE

MT5 Version VISÃO GERAL
Este indicador integra um modelo refinado de acompanhamento de tendência com detecção dinâmica de rejeição de preço, coloração dinâmica de velas e projeção de alvos baseada em ATR, oferecendo aos traders um sistema visual completo para identificar e gerenciar setups de continuação de tendência.
Ele é sobreposto diretamente ao gráfico, identifica automaticamente possíveis mudanças de tendência, confirma rejeições próximas a suportes/resistências adaptáveis e exibe nívei
The Variations Moving Average indicator has eight types of non-standard moving averages.
Double MA - DMA Triple MA - TMA Hull MA - HMA Jurik MA - JMA Adaptive MA - AMA Fractal Adaptive MA - FAMA Volume Weighted MA - VWMA Variable Index Dynamic MA - VIDMA
Works as a trend indicator. Indicator settings Type MA Shift MA Show Trend Period MA Method MA Applied Price MA Color MA
FREE

"Drivers Road Bands" indicator that is designed to be used in the 1H, 4H and 1D timeframes in the most ideal way. If we compare timeframes to roads and streets; main streets and highways with high traffic volume are similar to high-time timeframes in technical analysis. If you can interpret the curvilinear and linear lines drawn by this indicator on the graphic screen with your geometric perspective and develop your own buy and sell strategies; you may have the key to being a successful trader.
FREE

Rua TrailingStop BreakEven Little
The EA not for Real Account. You can EA for Real Account with link: https://www.mql5.com/en/market/product/47635 Uses of EA - Trailingstop: Move stoploss continuously. - Breakeven: Move the stoploss once. Custom parameters: All OrderOpenTime: + true: acts on all order + false: only affect the order opened since EA run All OrderType: + true: acts on all order. + false: only the order is running (Buy, Sell) TraillingStop: true (Use), false (do n
FREE

Volume Cross Over is an indicator that measure positive and negative volume flow in a financial instrument, such as a stock, commodity, or index. It is base on the idea of On-Balance Volume developed by Joseph Granville. However instead of trending lines, this indicator shows volume cross over. When the closing price of an asset is higher than the previous closing price, then the Bull volume is greater than zero and Bear volume is negative. It suggests that buying volume is dominating, an
FREE

The art of Forex is a new complex Expert Advisor that continuously trades in both directions. A series of orders will be opened to get the best average price until the take profit is hit. It is optimal for making profits in an unpredictable market. A loss coverage system is integrated to allow the recovery of orders that are too distant from the current price. The best results are on EUR/USD H1 but you can use it on any forex pair and timeframe .
Live results : https://myx.gg/mql5
S
FREE

KT Quick Risk Calculator is a professional utility tool for MetaTrader 4. It is designed to improve your workflow by providing instant calculations using an interactive measuring tool.
[Main Function] This tool allows you to interactively measure the distance between two points on the chart and immediately see the potential result in your account currency based on a fixed lot size.
[Key Features] 1. Smart Interaction: Hold [Ctrl] + Drag Left Mouse Button to measure. 2. Instant Data: Displays
FREE

This versions is free because a dangerous strategy is used.
If you want to see my full and best product (not dangerous), check it out : https://www.mql5.com/en/market/product/82662
I'm sharing with you a scalping strategy who is designed especially on GBPNZD timeframe M5 . Scalping GBPNZD is a scalper who is not spread sensitive. Scalping GBPNZD 's backtest is around 70% of winrate. Scalping GBPNZD is very easy to use. Scalping GBPNZD is using a dangerous strategy. Scalping GBPNZD is a
FREE

NEW VERSION of Gemini: Changes with signal combinations, SL/TP values and amount of pairs and TF’s available. Please make sure you download V 1.1 and ONLY use set files for each pair and TF given! Signal has been updated with this new version. Gemini is a complex Expert Advisor that uses Awesome Oscillator closing bar price, ATR Ranges and Bar Pattern combinations for opening trades with managing and closing trades based on Bollinger Band Width Ratio’s. Though the algorithms are consta
FREE
The ATR Strategy Multiplier is designed to help traders assess market volatility using the Average True Range (ATR) across multiple timeframes. It calculates and displays ATR values along with recommended Stop Loss (SL) and Take Profit (TP) levels based on the ATR. These levels are essential for setting risk management parameters and optimizing trading strategies.
Parameters: Indicator Parameters : ATR Period : Determines the period over which the ATR is calculated. Timeframe : Select the time
FREE

This EA was created based on a certain phenomenon incorporating my ideas. The logic was inspired by observing the XAUUSD chart. When the candlestick size is very large, it tends to indicate a trend. This EA enters a trade when the candlestick size exceeds a predefined input value. It conditions the entry such that if it's a BUY entry, the previous candlestick must be bearish, and for a SELL entry, the previous candlestick must be bullish.
Additionally, the EA comes equipped with a Trend Followi
FREE

O stoch_bot Expert Advisor é um robô simples para negociar níveis de sobrecompra/sobrevenda no Indicador Stochastic.
Para a conveniência dos traders, foram adicionadas muitas funções que tornam a negociação mais confortável e segura.
O EA possui um indicador de proteção de Autor integrado contra uma grade unidirecional.
Ferramentas recomendadas : USDCHF;
GBPUSD;
EURUSD;
USDJPY;
USDCAD;
AUDUSD;
EURJPY;
Mm mínimo recomendado e personalização: USDCHF, Deposit = 1000$, Lot = 0.01, lucro a
FREE

The Moving Averages On-Off let you control the indicator using the keyboard or a button . You can choose if you want the indicator always shown or always hided while switching among different time frames or financial instruments . ---> This indicator is part of Combo Indicator OnOff
It's possible to use three Moving Averages , defined as Short , Medium , Long or Raimbow MA 5,10,20,50,100,200.
Input MOVING AVERAGES
You can customize the price type used for calculation : close, open
FREE

Confira e se você gosta, apenas aproveite. Experimente vários valores para encontrar a configuração que melhor se adequa à sua negociação. Sinal para cima se o indicador for colorido verde gramado e sinal de baixa se o indicador estiver cinza. Você pode usar a linha em si para parar quando abrir ordens. Isto é só uma ferramenta. Um complemento. Não é uma estratégia. Combine-o com sua própria análise Basta baixá-lo e experimentá-lo, é grátis.
FREE

The Trading Sessions indicator is a simple tool that helps to highlight a specific trading session. For example, it can be used to differentiate the European, American or Asian sessions.
Main features The indicator shows a user-defined trading session. Alert notifications for the start and end of the session. Custom session time. Works on every timeframe (M1, M5, M15, M30, H1, H4, D1, W1, MN). Customizable parameters (Colors, alerts...). It can be used for creating EA. Available for MT4 an
FREE

Screener Breakout Congestion: Have you ever missed a trading opportunity because you were not looking at the chart of that market in that specific time frame? Here is this screener to help you identify congestion breakouts in the markets you want to follow in the different time frames required. Once you have identified the markets (forex, indices, CDF) and the different time frames (1M, 5M, 15M, 30M, 1H, 4H, Daily), the screener is represented by several buttons that change colour when the conge
FREE
The MT4 indicator that we are describing is designed to provide traders with an alert, notification, and email when Fibonacci levels are crossed. The Fibonacci levels are calculated based on the zigzag indicator, which helps to identify potential trend reversals in the market. When the indicator detects that a price has crossed a Fibonacci level, it will trigger an alert and send a notification to the trader's MT4 mobile app. Additionally, the indicator can be configured to send an email to the
FREE

Get This: The Ultimate Power Tool for Traders—Draw My Levels! Believe me, folks, this is BIG. This isn’t just some regular, everyday tool—this is *the* essential tool for your trading arsenal. “Draw My Levels” is a simple, elegant, and powerful script that’ll take your trading game to a whole new level. You want precision? You want control? You want to see where the real action is happening on the chart? Then this script is for you. Why Do You Need This Script? Let me tell you, if you’re a trade
FREE

Function Indicate Buy Sell Signals Indicate Strength of Buy Sell Signals This system is for both type of traders (Short & Long Term) Instead of Other Calculations, Parabolic Sar & Awesome are also used In Any time frame this can be use. What is in for Trader? Trading Switch: Short Term & Long Term Finally, we all knows that Forex Trading needs completely concentrate & proper cash management, So I never promising that my program will never give you loss but I tried well to provide good and respo
FREE

Welcome to Gold Bloom World!
This forex robot, "Gold Bloom," is made for gold lovers around the world. The entry logic is sophisticated for the XAUUSD forex pair. The robot monitors the previous day's candle pattern and places a pending order in one direction. Take profit is determined by a trailing stop, while the stop loss is placed automatically based on the previous candle's price.
Simple input
Just enter initial lot size and set trailing stop.(points) For XAUUSD , please input points val
FREE

Download directly the indicator file here. (if you can't open on MT4) MACD Indicator is one of the most popular momentum indicators among users. Searching and detecting MACD signals by the eye may not be easy. Scan Full Charts Dashboard Indicator with simple user interface and search customization panel saves time and scans all charts for MACD signals search and notifies the user with high accuracy. After finding the signal, the user was aware of the result by alerts and notifications. This ind
FREE

The Bolliger Bands On-Off let you control the indicator using the keyboard or a button . You can choose if you want the indicator always shown or always hided while switching among different time frames or financial instruments . ---> This indicator is part of Combo Indicator OnOff
The Bollinger Bands identify the degree of real-time volatility for a financial instruments . A lower amplitude corresponds to a low volatility, conversely a greater bandwidth corresponds to high volatility. Na
FREE
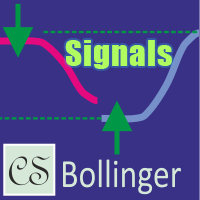
CS Bollinger is a signal indicator based on Bollinger Bands, designed for the rapid identification of key support and resistance levels with visual trading signals. Thanks to an improved level-switching logic, the indicator automatically adjusts levels on the chart, displaying signal arrows when a price reversal is confirmed. This helps traders quickly identify favorable moments for entering and exiting the market. The indicator offers flexible settings that allow it to be adapted to an individu
FREE

RRS Scalping is based on the Grid strategy, which involves increasing the lot size opposite to the price movement and waiting for recovery. Grid is usually a very medium risk technique, but this EA is built on well-calculated mathematics to minimize drawdown, reduce risk, and maximize profits. Refer for information about EA settings : https://docs.google.com/document/d/1cvg-qVqGrU5OaNUfd9AErpLSqYQ9gVcGd0tujWrKxFI/edit?usp=sharing Please share your experience, feedback, and trading reports. Good
FREE

What is Macro Kill Boxer? Macro Kill Boxer is a technical analysis indicator developed for the MetaTrader platform. It visualizes market movements during specific time intervals (e.g., Asia, London Open/Close, New York AM/PM) by drawing colored boxes on the chart. Each box represents the high and low price levels within the defined time period, often associated with macroeconomic events or high-volatility sessions. What Does It Do? Time-Based Analysis : Displays price movements as boxes for 58 c
FREE

This Ea is for the sole purpose of protecting your account.
When the basket of operations present in the terminals reach a set profit in currency terms, the expert will close all trades.
It will replicate the same behavior if the loss limit is reached.
It is a simple but at the same time useful expert advisor for safeguarding the account and always keeping it active.
It can be placed on any time frame or graph, the important thing is that it is inserted only once.
FREE
The programmable signal panel analyzes the charts of all available symbols and timeframes and sends a notification about the appearance of a trading signal. You can program all the necessary signals using the free binding indicator "Signal Collection". The binding indicator is provided with open source code. Thus, it is possible to program all the necessary signals for subsequent use in conjunction with the signal panel. The signal panel can not only analyze charts, but also manage these chart
FREE
O Mercado MetaTrader oferece um local conveniente e seguro para comprar aplicativos para a plataforma MetaTrader. Faça download de versões de demonstração gratuitas de Expert Advisors e indicadores a partir do seu terminal para testes no Testador de Estratégia.
Teste os aplicativos em diferentes modos para monitoramento do desempenho e assim fazer um pagamento para o produto que você deseja, usando o sistema de pagamento MQL5.community.
Você está perdendo oportunidades de negociação:
- Aplicativos de negociação gratuitos
- 8 000+ sinais para cópia
- Notícias econômicas para análise dos mercados financeiros
Registro
Login
Se você não tem uma conta, por favor registre-se
Para login e uso do site MQL5.com, você deve ativar o uso de cookies.
Ative esta opção no seu navegador, caso contrário você não poderá fazer login.