Conheça o Mercado MQL5 no YouTube, assista aos vídeos tutoriais
Como comprar um robô de negociação ou indicador?
Execute seu EA na
hospedagem virtual
hospedagem virtual
Teste indicadores/robôs de negociação antes de comprá-los
Quer ganhar dinheiro no Mercado?
Como apresentar um produto para o consumidor final?
Indicadores Técnicos Grátis para MetaTrader 4 - 2
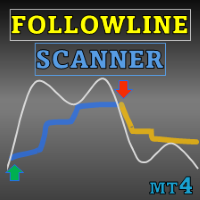
Special offer : ALL TOOLS , just $35 each! New tools will be $30 for the first week or the first 3 purchases ! Trading Tools Channel on MQL5 : Join my MQL5 channel to update the latest news from me Maximize sua vantagem de negociação com o Follow Line com Scanner, um indicador avançado baseado em volatilidade, projetado para traders sérios. Esta ferramenta combina o poder das Bandas de Bollinger com configurações personalizáveis, oferecendo insights precisos sobre os movimentos de
FREE

Consolidation Zone Indicator is a powerful tool designed for traders to identify and capitalize on consolidation patterns in the market. This innovative indicator detects consolidation areas and provides timely alerts when the price breaks above or below these zones, enabling traders to make informed trading decisions. MT5 Version : https://www.mql5.com/en/market/product/118748 Join To Learn Market Depth - https://www.mql5.com/en/channels/suvashishfx
Key Features:
1. Consolidation Detecti
FREE
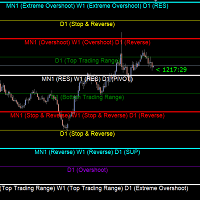
Gold Levels MTF - this is a fine stock technical indicator. The indicator algorithm analyzes the movement of the asset price, displays price levels of support and resistance from all time frames (TF) using the Murray method based on the Gann theory. The indicator indicates overbought and oversold fields, giving an idea of possible reversal points and at the same time giving some idea of the strength of the current trend. Description of levels: (Extreme Overshoot) - these levels are the ultimat
FREE
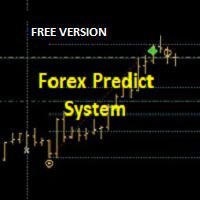
Hi Trader, ================================================================================ If you like my indicator, please do not hesitate to give a review and/or comment. Thank you! ================================================================================
This indicator draws trade entry zone and target levels based on the levels of the previous day.
A blue zone (BUY) or red zone (SELL) is drawn and two targets. The optimal trade entry value is also indicated.
A second gray zone is
FREE
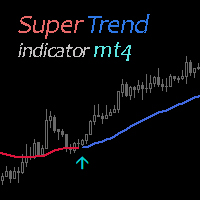
Super Trend Indicator uses two moving averages for calculating the trend direction. Combination with other market signals and analysis is necessary and provides more stable results. Indicator can be easily customized by the user including change of colors, with and arrow sizes.
FREE Super Trend Expert Advisor > https://www.mql5.com/en/market/product/81160?source=Site +Profile+Seller
FREE

Fair Value Gap Finder detects fair value gaps and generates a signal when price returns to one. Set the minimum and maximum fvg size, customize the colors, style, and length, then let the indicator highlight them for you.
Key Features: Automatic FVG highlights - The indicator detects all fair value gaps that fit your criteria and marks them on the chart.
Entry Signal - A signal is created whenever price retests a fair value gap.
Notification - Alerts notify you when a fair value gap
FREE
False Breakout MT4 é um indicador projetado para identificar situações em que o preço rompe brevemente um nível recente de suporte ou resistência e logo retorna ao intervalo anterior. Esses falsos rompimentos são úteis para análise discricionária ou estratégias contrárias, oferecendo sinais visuais claros sem fazer previsões automáticas. Principais funcionalidades: Detecção automática de falsos breakouts em torno de máximas e mínimas recentes (por exemplo, níveis diários estendidos por dois dias
FREE

Descrição Curta O G3D Full Confluence é um indicador de elite que une os conceitos mais poderosos de Smart Money Concepts (SMC) e análise técnica clássica. Identifique Order Blocks (OB) , Fair Value Gaps (FVG) e Divergências de RSI com precisão, tudo filtrado por uma lógica de confluência multi-timeframe. O que o G3D Full Confluence oferece? Diferente de indicadores comuns, o G3D foi projetado para reduzir o ruído do mercado, entregando sinais apenas quando múltiplos fatores se
FREE

This indicators automatically draws the Trend Channels for you once you've dropped it on a chart. It reduces the hustle of drawing and redrawing these levels every time you analysis prices on a chart. With it, all you have to do is dropped it on a chart, adjust the settings to your liking and let the indicator do the rest. Get an alternative version of this indicator here: https://youtu.be/lt7Wn_bfjPE For more free stuff visit: https://abctrading.xyz
Parameters 1) Which trend do you want t
FREE

A estratégia de negociação Moving Average Convergence Divergence (MACD) é uma ferramenta popular de análise técnica usada para identificar mudanças no impulso e direção da tendência. O MACD é calculado subtraindo a média móvel exponencial (EMA) de 26 períodos da EMA de 12 períodos. Uma EMA de 9 períodos, chamada "linha de sinal", é então plotada em cima do MACD para atuar como um gatilho para sinais de compra e venda. O MACD é considerado em território de alta quando a linha MACD está acima da l
FREE
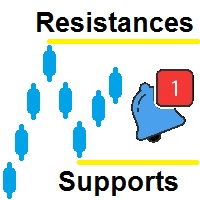
Suportes e Resistências, foi criado pra te ajudar a identificar topos e fundos automaticamente em vários timeframes diferentes e assim plotar esses topos e fundos no gráfico atual Vamos para a explicação da criação de resistências Existe um campo de regra, que você pode definir o que é um topo e fundo a regra de topo está definida como padrão assim: H[ 0 ]<=H[ 1 ] and H[ 1 ]=>H[ 2 ]
Onde:
Elemento Descrição H significa High [0] significa candle Atual [1] significa candle Anterior <=
FREE

Este indicador é usado para mostrar os locais de plano e tendência. O design é baseado em um oscilador. Ele é usado como um filtro adicional, tanto para negociação em gráficos regulares quanto para Opções Binárias. Os lugares planos são usados no indicador UPD1 volume Cluster para Negociar de acordo com o conceito de Smart Money. Um alerta embutido indica os locais de maior Sobrecompra/Sobrevenda.
Parâmetros de entrada.
Configurações básicas. Bars Count - especifique o número de barras nas qu
FREE

O indicador Pips Chaser foi desenvolvido para complementar o seu comércio manual. Este indicador pode ser utilizado tanto para o comércio de escalpes curtos como para o comércio de baloiços longos // Versão MT5
Características Sem indicador de repintura Este indicador não altera os seus valores quando chegam novos dados Pares comerciais Qualquer par de moedas Período de tempo H1 é preferível, mas pode adaptá-lo a qualquer período de tempo Tempo de negociação 24 horas por dia Buffers Buy
FREE

Magic Trend Indicator MT4 is an easy to use 100% Non-Repaint Forex System. It is an arrow Indicator which is designed for ALL time frames.
The Indicator can be used as a standalone system for scalping on M1 time frame or for long-term at H4 and it can be used as a part of our existing Golden Birds EA MT4 .
Magic Trend Indicator is fully non-repaint, meaning that its signals do not change or disappear after the candle closes—what you see is what you get. This provides traders with a reliable
FREE
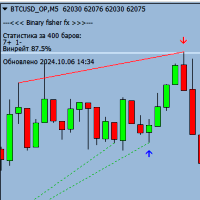
Binary Fisher FX é um poderoso indicador de opções binárias que funciona em qualquer período de tempo e com qualquer par de moedas. Este indicador foi concebido para identificar movimentos de tendência e indicar os pontos de entrada sob a forma de uma seta antes do fecho da vela atual.
Principais características do indicador:
Funciona em qualquer período de tempo (M1, M5, M15, M30, H1, H4, D1) Suporta qualquer par de moedas Expiração de 1 a 3 velas (padrão 1 vela) Indica pontos de entrada sob
FREE

The Anchored VWAP Indicator for MetaTrader 4 gives you full control over where your VWAP starts. Instead of being locked to session opens or fixed times,
you simply drag the anchor point on the chart , and the VWAP instantly recalculates from that exact bar.
This makes it perfect for analyzing:
• Institutional entry zones
• Breakout origins
• Swing highs/lows
• News reaction points
• Trend continuations Key Features Drag & Drop Anchor Point : Move the starting point directly on the cha
FREE

Free Market structure zig zag to assist in price action trading the screenshots describe how to use and how to spot patterns new version comes with alerts, email alert and push notification alert can be used on all pairs can be used on all timeframes you can add additional confirmation indicators the indicator shows you your higher high and low highs as well as your lower lows and lower highs the indication makes price action analysis easier to spot.
FREE
Multi Timeframe Buy and Sell Power MT4
The Multi Timeframe Buy and Sell Power indicator for MetaTrader 4 is a versatile tool designed to provide traders with a clear visual representation of market pressure across nine standard timeframes, from M1 to MN1. By aggregating buy and sell strength percentages derived from recent price action and tick volume, it helps identify potential trends, reversals, and neutral conditions in real-time. The indicator displays this information in a compact dashbo
FREE
Descrição
SMA Reentry é um indicador para MetaTrader 4 desenvolvido para identificar pontos de reentrada na tendência principal. Utiliza duas médias móveis simples: uma rápida para capturar movimentos de curto prazo e uma lenta para filtrar a direção geral do mercado. Um sinal de compra ocorre quando a média rápida está acima da lenta e o preço retorna acima da média rápida após ter estado abaixo na vela anterior. Um sinal de venda ocorre quando a média rápida está abaixo da lenta e o preço ret
FREE

This is a multi-timeframe version of the popular Hull Moving Average (HMA).
The Double HMA MTF Light indicator combines two timeframes on a single chart. The HMA of the higher timeframe defines the trend, and the HMA of the current timeframe defines short-term price movements.
The indicator is freely distributed and hasn't audio signals or messages. Its main function is the visualization of price movements. If you need advanced functionality of the HMA multi-timeframe indicator (information ab
FREE

Este indicador de informação será útil para quem quer estar sempre atento à situação atual da conta. O indicador exibe dados como lucro em pontos, porcentagem e moeda, bem como o spread do par atual e o tempo até o fechamento da barra no período atual. VERSÃO MT5 - Indicadores mais úteis
Existem várias opções para colocar a linha de informação no gráfico: À direita do preço (corre atrás do preço); Como comentário (no canto superior esquerdo do gráfico); No canto selecionado da tela. Também é
FREE
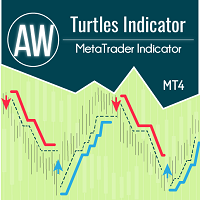
O indicador funciona de acordo com o sistema Turtle e classicamente assume um intervalo de tempo de 20 e 55 velas. Uma tendência é monitorada durante um determinado intervalo de tempo. A entrada é feita no momento da quebra do nível de suporte ou resistência. O sinal de saída é um rompimento de preço na direção oposta da tendência do mesmo intervalo de tempo. Vantagens:
Instrumentos: pares de moedas, ações, commodities, índices, criptomoedas Prazo: Classicamente D1, também adequado para trabal
FREE

Scalper Arrow x is a buy sell arrow type indicator, the strategy behind its signals is based on the MFI indicator with trend filter using Halftrend formula, this indicator can be used alone or mixed with other tools. NOTE : THIS INDICATOR DOESN'T REPAINT OR BACK PAINT, AND ITS ARROW SIGNALS ARE NOT DELAYED. ---------------------------------------------------------------
FREE

Indicador de Deslocamento da Estrutura do Mercado e Lacunas de Valor Justo (FVG) para MT4 Este indicador para MT4 identifica deslocamentos na estrutura do mercado e lacunas de valor justo (FVG), proporcionando aos traders potenciais oportunidades de trading. Ele alerta os usuários sobre esses eventos por meio de notificações móveis, permitindo que reajam rapidamente às condições de mercado em constante mudança. Principais características: Detecção de Deslocamento da Estrutura do Mercado: Identi
FREE
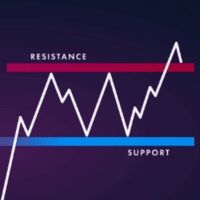
Versão MT4: https://www.mql5.com/en/market/product/157679 Versão MT5: https://www.mql5.com/en/market/product/157680
Suporte e Resistência — Níveis Inteligentes de Estrutura de Mercado
Um indicador de Suporte e Resistência limpo, inteligente e altamente fiável, desenvolvido para traders profissionais e sistemas automatizados.
O indicador Suporte e Resistência foi concebido para detetar níveis reais de mercado utilizando um algoritmo de agrupamento avançado que combina Fractais, segmentação de
FREE

O indicador « Identify Trend» (“Identificar Tendência”), usando métodos de filtragem razoavelmente simples, mas robustos (baseado na mediana móvel - Algoritmo XM ) e algoritmos mais complexos desenvolvidos pelo autor (XC, XF, XS, quatro tipos de médias móveis sem demora SMAWL, EMAWL, SSMAWL, LWMAWL ) , permite com muita precisão e, o mais importante, um pequeno atraso para estabelecer (1) o início do verdadeiro movimento da tendência e (2) identificar o plano. Esse indicador
FREE

1.de preços em um mercado livre de fluxo. A base dessa estratégia é que a quantidade de ferramentas disponíveis e a demanda por ferramentas dos compradores determinam o preço. Ele marca no gráfico as áreas onde a demanda supera a oferta (regiões de demanda), impulsionando os preços para cima, ou onde a oferta supera a demanda (regiões de oferta), impulsionando os preços para baixo. A maioria dos comerciantes de oferta e demanda espera que os preços entrem nas áreas onde ocorrem as principais at
FREE
Scalping Edge Pro Indicator Unleash the Power of Precision Trading: Introducing Scalping Edge Pro Tired of market noise and conflicting signals that cloud your judgment? Are you searching for a tool that delivers the clarity and confidence needed to seize rapid opportunities in volatile markets? Scalping Edge Pro is the engineered solution designed for traders who demand precision and professionalism in every trade. It is meticulously calibrated for peak performance on the 15-minute (M15) timef
FREE
Special offer : ALL TOOLS , just $35 each! New tools will be $30 for the first week or the first 3 purchases ! Trading Tools Channel on MQL5 : Join my MQL5 channel to update the latest news from me Visão Geral
OA SnR Power é uma ferramenta poderosa projetada para ajudar traders a identificar e avaliar a força dos níveis de suporte e resistência. Incorporando fatores-chave como volume de negociação, frequência de rebote e número de testes, este indicador fornece uma visão abrangent
FREE

Se você gosta deste projeto, deixe uma revisão de 5 estrelas. Este indicador desenha os preços abertos, altos, baixos e finais para o
especificado
período e pode ser ajustado para um fuso horário específico. Estes são níveis importantes olhados por muitos institucional e profissional
comerciantes e pode ser útil para você saber os lugares onde eles podem ser mais
activa. Os períodos disponíveis são: Dia anterior. Semana anterior. Mês anterior. Quarto anterior. Ano anterior. Ou: Dia atual. Seman
FREE

O indicador básico de oferta e procura é uma ferramenta poderosa concebida para melhorar a sua análise de mercado e ajudá-lo a identificar áreas-chave de oportunidade em qualquer gráfico. Com uma interface intuitiva e fácil de usar, este indicador Metatrader gratuito dá-lhe uma visão clara das zonas de oferta e procura, permitindo-lhe tomar decisões de negociação mais informadas e precisas / Versão MT5 gratuita
Dashboard Scanner para este indicador: ( Basic Supply Demand Dashboard )
Caracter
FREE
Special offer : ALL TOOLS , just $35 each! New tools will be $30 for the first week or the first 3 purchases ! Trading Tools Channel on MQL5 : Join my MQL5 channel to update the latest news from me O indicador AI Channels utiliza clusterização K-means deslizante — uma técnica poderosa de aprendizado de máquina na análise de clusters — para fornecer insights em tempo real sobre tendências de preços subjacentes. Este indicador cria canais adaptativos com base em dados de preços agrup
FREE

Star Reversal Pro - Morning & Evening Star Pattern Detector with Advanced Filters Star Reversal Pro is a professional technical indicator for MetaTrader 4 that automatically detects Morning Star and Evening Star candlestick patterns. The indicator features an intelligent trend filter and Higher Timeframe confirmation to improve signal quality and reduce false signals. Main Features: The indicator precisely detects Morning Star (bullish reversal signal) and Evening Star (bearish reversal signal)
FREE
Welcome to the world of SMC (Smart Money Concepts) Trading, where we empower traders with the tools and knowledge to make smarter trading decisions. Our latest addition to our suite of trading tools is the SMC Trading Pro indicator, version 1.0. Key Features: Major Market Structure Identification with BODY break. Order Block must be in Major Swing ( not Small Swing ). Order Block with Fair Value Gap Detection. Order Block in Discount | Premium zone. Filter for only Bullish, Bearish or All Order
FREE

Este indicador combina o oscilador CCI com detecção de estrutura de mercado. Identifica entradas em pullback na direção da tendência principal usando análise CHoCH (Mudança de Caráter) e BOS (Quebra de Estrutura). Como funciona O indicador analisa os swing highs e swing lows no seu gráfico para determinar a estrutura do mercado — altista ou baixista. Quando uma Quebra de Estrutura (máximas mais altas + mínimas mais altas) ou Mudança de Caráter (reversão de tendência) é detectada, a direção é def
FREE

Indicador de Projeção do Gráfico A projeção do gráfico começou como um pequeno indicador que usava o indicador técnico zig zag integrado para prever a ação futura do preço (você pode encontrar o algoritmo antigo nos comentários)
A ideia é simples, a ação do preço passado não se traduz no futuro, mas talvez se não formos muito específicos, ou muito genéricos, possamos extrair diretrizes sobre o que pode acontecer.
A "tese" da projeção do gráfico é esta:
Os comerciantes vão olhar para o gráfic
FREE
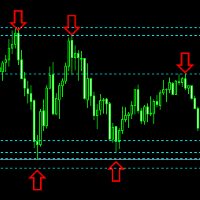
.....................................hi....................... ................for showing high s and low s and support and resistanses .....................we have a lot of ways............................... it can be helpful for finding trends , higher highs , higher lows , lower highs , lower lows
.......................today i write on of thems.......................... ........................you can enter the number of last support and resistanses .........................and it will dra
FREE

The indicator analyzes the volume scale and splits it into two components - seller volumes and buyer volumes, and also calculates the delta and cumulative delta. The indicator does not flicker or redraw, its calculation and plotting are performed fairly quickly, while using the data from the smaller (relative to the current) periods. The indicator operation modes can be switched using the Mode input variable: Buy - display only the buyer volumes. Sell - display only the seller volumes. BuySell -
FREE

Buy Sell Signal Low TF gives buy/sell signals and alerts with up and down arrow at potential reversal of a pullback or a trend continuation pattern in low timeframe. This is an indicator which gives signals based on trend => It works best in trend market with the principle is to ride on the trend not trade against the trend.
The components of Buy Sell Signal Low TF: - The trend is determined by SMMA 13 , SMMA 21 and SMMA 35 ( can be changed manually to suit your preference). - The signal is b
FREE

Este é um produto gratuito que pode utilizar de acordo com as suas necessidades!
Também aprecio muito os seus feedbacks positivos! Muito obrigado!
Clique aqui para ver robôs e indicadores de negociação de alta qualidade!
Indicador Crypto_Forex: Velas Heiken Ashi para MT4. Sem repintura. - Heiken_Ashi_Candles tem uma ótima combinação com o indicador Trend Line MA como está na imagem. - O indicador Heiken_Ashi_Candles é um indicador auxiliar muito útil para tornar a tendência mais visível. - É
FREE

MACD divergence indicator finds divergences between price chart and MACD indicator and informs you with alerts (popup, mobile notification or email). Its main use is to find trend reversals in the chart. Always use the divergence indicators with other technical assets like support resistance zones, candlestick patterns and price action to have a higher possibility to find trend reversals. Three confirmation type for MACD divergences: MACD line cross zero level Price returns to previous H/L Creat
FREE
Melhore o seu trading de ação de preço com o indicador Higher Highs and Lows MT4, uma ferramenta robusta que utiliza análise fractal para identificar pontos de swing chave e padrões que definem tendências como Higher Highs (HH), Lower Highs (LH), Lower Lows (LL) e Higher Lows (HL) para insights claros sobre a direção do mercado. Baseado em princípios fundamentais de ação de preço enraizados na Teoria de Dow do início do século XX e popularizados no trading moderno por especialistas como Al Brook
FREE

Trading doesn’t have to be complicated. With the right visual guidance, market decisions become clearer, calmer, and more confident.
Nebula Arrow is designed to help traders focus on what truly matters: high-quality entries based on refined market behavior. Just load it on your chart and let the arrows guide your trading decisions. Trade With Confidence We believe that simplicity is power. Nebula Arrow was created after extensive market observation and practical research, transforming complex
FREE

The Omega Trend Indicator is an advanced tool that has been specifically designed to detect market trends early, and follow them efficiently. The indicator draws two lines. The main (thicker) Trend Line represents the presumed lower or upper volatility limits of the current market trend. A break in the main Trend Line indicates a potential reversal or shift in the movement of the trend. The Trend Line also indicates the best point to place a stop loss order. In Omega Trend Indicator, the Trend L
FREE
SR PrevPeriods MT4 Panoramica
SR PrevPeriods traccia in tempo reale i massimi e i minimi del giorno precedente, della settimana precedente e del mese precedente direttamente sul grafico di MetaTrader 4. È un indicatore leggero progettato per evidenziare aree storiche di supporto e resistenza che spesso coincidono con zone di reazione del prezzo, breakout e zone di riequilibrio. Cosa fa
Disegna linee orizzontali sui livelli chiave precedenti e, se desiderato, etichette di testo con il valore es
FREE

A inclinação da média móvel de quantos é um indicador muito poderoso para dar indicação direcional e momento. O indicador não está sendo repintado. Você pode calcular o ângulo ma com eficiência e encontrar a tendência.
A contagem do lucro começa assim que o candle do sinal é fechado. Portanto, são os resultados exatos que estariam ao vivo.
O TimeFrame sugerido está usando em H1. Todas as opções do indicador são editáveis.
Dicas: Direcções de oscilação do comércio e quebra de tendência. fracta
FREE
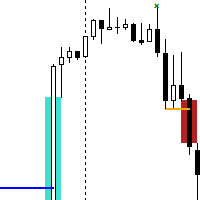
The Break of Structure (BoS) and Change of Character indicator with Fair Value Gap (FVG) filter is a specialized tool designed to enhance trading strategies by pinpointing high-probability trading opportunities on price charts. By integrating the BoS and Change of Character concepts with the FVG formation, this indicator provides traders with a robust filtering mechanism to identify optimal entry and exit points. The indicator identifies instances where the structure of price movements is disrup
FREE
Our modernised version of the popular Order Blocks Indicator for MT4 identifies major trend reversal and momentum exhaustion points by providing arrow signals on the chart. As a result, traders can identify bullish and bearish price reversal zones and BUY and SELL accordingly. Moreover, the indicator provides Buy and Sell Arrow signals.
An order block is a market structure that is defined as the last bearish candle before a bullish price move and vice versa. These order blocks act as support a
FREE
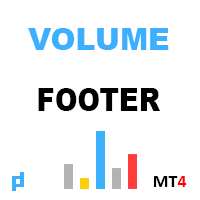
O indicador mostra o volume vertical. As configurações têm 2 coeficientes para determinar o alto e o extremo, e 1 para determinar o baixo volume. Um algoritmo semelhante também é usado no indicador UDP1 Volume Pixel . Quando o volume especificado é detectado, o histograma é colorido na cor correspondente. A largura do histograma é selecionada automaticamente, dependendo da escala. Como regra geral, o preço reage ao volume máximo e mínimo. Mas é necessário usar sinais de confirmação.
Parâmetros
FREE

It works based on the Stochastic Indicator algorithm. Very useful for trading with high-low or OverSold/Overbought swing strategies. StochSignal will show a buy arrow if the two lines have crossed in the OverSold area and sell arrows if the two lines have crossed in the Overbought area. You can put the Stochastic Indicator on the chart with the same parameters as this StochSignal Indicator to understand more clearly how it works. This indicator is equipped with the following parameters: Inputs d
FREE
BBRSI Quantum (Free Edition) BBRSI Quantum is a powerful, 100% Non-Repainting indicator for MetaTrader 4 that generates clear Buy and Sell arrows based on an advanced momentum strategy. This tool is designed for traders who want to identify precise entry points during overbought or oversold conditions. This is the fully functional FREE edition. The Core Strategy: Bollinger Bands on RSI Unlike standard indicators, BBRSI Quantum does not apply Bollinger Bands to the price. Instead, it applies th
FREE

Venom Trend Pro — Ferramenta de Análise de Tendência Multi-Timeframe O Venom Trend Pro é um indicador de tendência e swing trading projetado para identificar movimentos direcionais claros em qualquer par e qualquer período de tempo. Funciona bem para operações intradiárias e de swing em Forex, ouro, criptomoedas, índices e muito mais. O indicador analisa a estrutura de preço recente e o momento do mercado para detectar tendências emergentes ou em andamento. Após a confirmação da tendência, os si
FREE
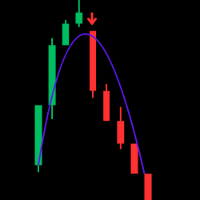
Trend WTS — Advanced Modular Trend & Signal Indicator for XAUUSD (M5 Optimized) Unlock precise trading insights with Trend WTS , a powerful and modular trend and signal indicator designed specifically for XAUUSD on the M5 timeframe. Built for traders seeking accuracy and clarity, Trend WTS combines fast moving average crossovers with a long-term EMA filter to deliver reliable buy and sell signals tailored for the gold market. Key Features: Dual Moving Average Trend Detection: Detect strong trend
FREE
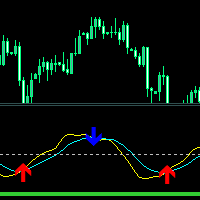
Crossing Line Indicator - Um indicador concebido para a deteção precoce de movimentos de impulso na direção da tendência.
Contém um oscilador construído no indicador RVI com suavização e modificação de comportamento. Duas linhas finas, quando se cruzam, ocorre um momento de mudança de preço, cuja consequência pode ser um impulso ou movimento intenso.
O indicador para determinar a direção da tendência baseia-se em indicadores de MA ponderada. Linha verde-clara espessa: se estiver abaixo do nível
FREE

Description Helps you detect the structure of the market, using different types of Smart Money concepts. This should help you to upgrade your trading strategy in every way. MT5 Version Here Smart Money Features: Color candle to signal the type of structure Shows CHOCH and BOS Equal Lows and Highs Order Blocks Internal and Swings Weak and strongs high and lows Fair Value Gaps High and Lows in daily weekly and monthly timeframes Premium and discount Zones KEY LINKS: How to Install – Frequent
FREE

Bem-vindo ao nosso Padrão de onda de preço MT4 --(Padrão ABCD)-- O padrão ABCD é um padrão de negociação poderoso e amplamente utilizado no mundo da análise técnica.
É um padrão de preço harmônico que os traders usam para identificar oportunidades potenciais de compra e venda no mercado.
Com o padrão ABCD, os traders podem antecipar possíveis movimentos de preços e tomar decisões informadas sobre quando entrar e sair das negociações. Versão EA: Price Wave EA MT4
Versão MT5: Price
FREE
Este indicador desenha zonas de oferta e demanda no gráfico. Combinado com suas próprias regras e técnicas, este indicador permitirá que você crie (ou aprimore) seu próprio sistema poderoso. Por favor, confira também a versão paga que oferece muito mais. Minha recomendação é procurar oportunidades de negociação onde o primeiro teste de zona ocorre após pelo menos 25 barras. Características As zonas têm 3 cores (ajustáveis por entrada). Cor escura para zona não testada, média para zona testad
FREE

This indicator was created as an MT4 version inspired by a TMA RSI Divergence indicator found on TradingView.
This indicator detects both Regular and Hidden divergences using RSI pivot points, similar to TradingView's pivot-based divergence logic.
-------------------------------------------------- Features -------------------------------------------------- • Regular Bullish / Bearish divergence • Hidden Bullish / Bearish divergence • Pivot-based detection (Left / Right bars) • Optional RSI SM
FREE
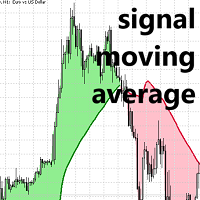
Média Móvel de Sinal Lux Algoritmo para MT5
Descubra um indicador de média móvel único, concebido especificamente para a utilização de linhas de sinal em sistemas de crossover de média móvel. Esta ferramenta avançada diferencia-se por divergir do preço em mercados variáveis, ao mesmo tempo que reflete de perto uma média móvel padrão em mercados com tendências. Esta característica ajuda os traders a evitar ruídos desnecessários e possíveis negociações excessivas devido às flutuações do mercado.
FREE

It identifies the pivot, support, and resistance price levels of the selected timeframe and then draws lines onto the chart. FEATURES: Option to specify the Timeframe Period in the PivotSR calculation. Option to display the PivotSR of the last candle, of every candle, or of the current candle. Options for displaying labels, line thickness, and line color. PivotSR can be interpreted as reversal levels or past price reactions that can be used as the basis for current price analysis. Some traders b
FREE
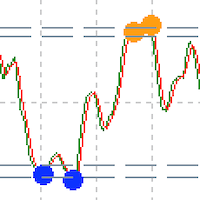
Custom Relative Strength Indicator with multiple timeframe selection About RSI The relative strength index is a technical indicator used in the analysis of financial markets. It is intended to chart the current and historical strength or weakness of a stock or market based on the closing prices of a recent trading period. Features
Indicator gives alert when reached oversold or overbought levels Gives dot indication while reaching levels. Can set indicator bar alert intervals for alerts Can choos
FREE

Channel Searcher MT5 — Indicador multimoeda para detecção de canais de preço Ferramenta auxiliar para detecção e visualização automáticas de canais de preço com base em picos fractais e análise geométrica. O indicador destina-se exclusivamente à negociação manual e é adequado para traders que seguem uma abordagem estrutural do mercado. Identifica canais com base em múltiplos critérios: número de toques, inclinação, preenchimento, profundidade de rompimento e posição relativa dos fractais. Ofere
FREE
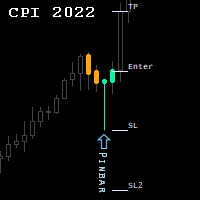
Candlestick Patterns Indicator.
NEW! FREE Candlestick Patterns Expert Advisor > https://www.mql5.com/en/market/product/105634?source=Site +Profile
The Indicator draws colored candlestick patterns, their description and future levels of Stop Loss / Take Profit. Combined with other market analysis, can greatly improve trading results. Indicator can be highly customized by the user including change of colors, fonts, levels, candle sizes etc...
developed, tested and optimized on " VantageMark
FREE
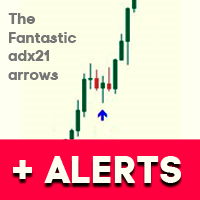
.See screenshots of the indicator. Uses information about the current trend. It is based on the classic ADX indicator. Gives a signal to enter a trade using a non-standard strategy.
Settings: Name Description Period of ADX The period of the classic ADX indicator Distance between +D & -D lines Distance between + D and -D lines . Determines the strength of the trend. Freshness of the signal (bars) Checking the freshness of a buy or sell signal.
Selects the very first signal in the span.
The numbe
FREE
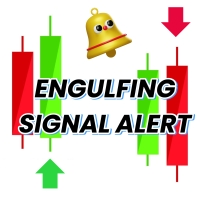
Engulfing Candle Signal Alert: Elevate Your Trading Strategy Unlock the full potential of your trading with the Engulfing Candle Signal Alert, the ultimate tool for identifying market reversals and enhancing your trading precision. Designed specifically for traders who value accuracy and timely alerts, this powerful indicator detects engulfing candle patterns, a key signal in technical analysis that often indicates a potential shift in market direction. What is an Engulfing Candle? An engu
FREE

O Auto Fibo é um indicador desenvolvido para melhorar o seu comércio manual. Ele desenhará a proporção de ouro automaticamente, poupando-lhe tempo e facilitando a sua negociação. Anexe o indicador ao gráfico e este desenhará automaticamente a razão de ouro exacta, poupando-lhe o trabalho de ter de encontrar o ponto crítico. A interface ajusta-se de acordo com o seu computador para os pontos altos e baixos aproximados da banda. Este indicador irá corrigir a maioria dos erros de selecção de ponto
FREE
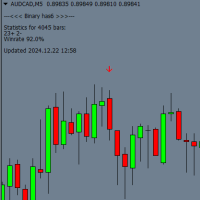
Binary has 6 é um indicador para negociação de opções binárias no MT4 que funciona em qualquer período de tempo e com qualquer par de moedas. Também pode ser usado para negociações de Forex. Principais características: Expiração: Por padrão, é configurado para 1 vela, mas os usuários podem ajustar para um período de 1 a 3 velas nas configurações. Negociação baseada em tendência: O indicador gera sinais com base na tendência atual. Sinais: Antes de o candle atual fechar, uma seta (vermelha ou azu
FREE
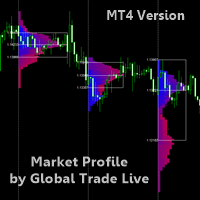
READ THE DESCRIPTION ITS IMPORTANT - ONLY TAKES 2 MINUTES - THIS IS A TOOL NOT A TRADING STRATEGY
Market Profile By Global Trade Live A Market Profile is a graphical representation that combines price and time information in the form of a distribution. A Market Profile is used to determine elapsed time, number of ticks and volumes traded at specific prices, or over a price interval, over a given period. A Market Profile also makes it possible to identify prices accepted or rejected by the mark
FREE

Este indicador é baseado no famoso indicador fractal mas com muita customização e flexibilidade,
esta é uma ferramenta poderosa para identificar reversões de tendências e maximizar seu potencial de lucro.
Com seus recursos avançados e interface amigável, é a escolha definitiva para traders de todos os níveis. Versão MT5: Ultimate Fractals MT5 Características :
Contagem customizável de velas Fractal. Linhas de reversão. Configurações personalizáveis. Interface amigável. Parâmetros principai
FREE

Free automatic Fibonacci is an indicator that automatically plots a Fibonacci retracement based on the number of bars you select on the BarsToScan setting in the indicator. The Fibonacci is automatically updated in real time as new highest and lowest values appears amongst the selected bars. You can select which level values to be displayed in the indicator settings. You can also select the color of the levels thus enabling the trader to be able to attach the indicator several times with differe
FREE
O Mercado MetaTrader é um site simples e prático, onde os desenvolvedores podem vender seus aplicativos de negociação.
Nós iremos ajudá-lo a postar e explicar como descrever o seu produto para o mercado. Todos os aplicativos no Mercado são protegidos por criptografia e somente podem ser executados no computador de um comprador. Cópia ilegal é impossível.
Você está perdendo oportunidades de negociação:
- Aplicativos de negociação gratuitos
- 8 000+ sinais para cópia
- Notícias econômicas para análise dos mercados financeiros
Registro
Login
Se você não tem uma conta, por favor registre-se
Para login e uso do site MQL5.com, você deve ativar o uso de cookies.
Ative esta opção no seu navegador, caso contrário você não poderá fazer login.