Conheça o Mercado MQL5 no YouTube, assista aos vídeos tutoriais
Como comprar um robô de negociação ou indicador?
Execute seu EA na
hospedagem virtual
hospedagem virtual
Teste indicadores/robôs de negociação antes de comprá-los
Quer ganhar dinheiro no Mercado?
Como apresentar um produto para o consumidor final?
Indicadores Técnicos Grátis para MetaTrader 4 - 6

BIG CANDLE ALERT https://www.mql5.com/en/users/earobotkk/seller#products P/S: If you like this indicator, please rate it with 5 stars in the review section, this will increase its popularity so that other users will be benefited from using it. This indicator draws a bullish and bearish vertical line inside a candle whenever the size of a candle body exceeds the minimum size specified in the input. INPUT Bullish Candle Color: choose the color of your choice. Bearish Candle Color: choose the co
FREE
As every ZigZag Indicator this Indicator Repaints . So use this only combining with other indicators or strategy.
CyberZingFx ZigZag Arrow MT4 Indicator, is one of the best tool for traders looking to identify trend reversals in the markets. This powerful indicator uses the ZigZag method to help you identify key support and resistance levels, making it easier to spot significant changes in price and filter out short-term fluctuations. With CyberZingFx ZigZag Arrow, you can quickly and easi
FREE
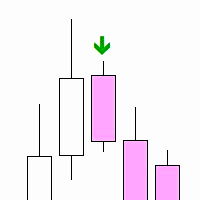
"Inside Bar PA" is a technical indicator designed to determine the inner bars on the chart. An internal bar is a bar or candle, the maximum and minimum of which are completely contained in the previous bar. This may signal a potential reversal or continuation of the trend, depending on the context.
Features: Automatic detection of internal bars. Visual marking of internal bars with arrows on the chart. The ability to adjust the distance of the mark from the bar. How to use: Attach the indicat
FREE
Highly configurable Macd indicator.
Features: Highly customizable alert functions (at levels, crosses, direction changes via email, push, sound, popup) Multi timeframe ability Color customization (at levels, crosses, direction changes) Linear interpolation and histogram mode options Works on strategy tester in multi timeframe mode (at weekend without ticks also) Adjustable Levels Parameters:
Macd Timeframe: You can set the lower/higher timeframes for Macd. Macd Bar Shift: you can set the
FREE

RT_TrendlineTool : Semi-AutoTrendline Tool on MT4 2 easy steps, just press the [T] button on your keyboard and click on the Swing High/Low that you're interested.
Then the indicator will try to draw a trendline that runs through only the wick, not cut through candlestick's body
and try to cross the swing point as much as possible with the least slope of the trendline. You can draw up to 10 trendlines.
You are able to get alert when price breakout these trendlines. Additional Hotkey : Press
FREE

The indicator displays crossing zero level by Moving Average of Oscillator (OsMA) in the form of arrows. The this is a multi-timeframe indicator, and it displays signals from other timeframes. The indicator notifies about a signal by means of a pop-up Alert window, or sending notification to e-mail.
Parameters Time-frame - select timeframe to show indicator signals. Fast EMA Period - fast EMA. This is an exponential moving average from a price with a short period. Slow EMA Period - slow EMA. T
FREE

Update: For those who want to manually backtest this indicator, check this tool https://www.mql5.com/en/market/product/59248
The indicator will help make your calculation of stop loss easier as it will be visually aiding you in choosing where to put your stoploss level on the chart by calculating the current value of ATR indicator. For those who are unfamiliar with ATR, it is a useful indicator to calculate stoploss for trend following strategy. If volatility is high, ATR stoploss level will b
FREE

This indicators automatically draws the support and resistances levels (key levels) for you once you've dropped it on a chart. It reduces the hustle of drawing and redrawing these levels every time you analyse prices on a chart. With it, all you have to do is drop it on a chart, adjust the settings to your liking and let the indicator do the rest.
But wait, it gets better; the indicator is absolutely free! For more information: https://youtu.be/rTxbPOBu3nY For more free stuff visit: https
FREE

This indicator tool provides mini charts, with adjustable symbol/tf that can be dragged into place. Lightweight operation with multiple mini charts are supported.
Chart features: adjustable symbol and tf draggable multiple mini charts color styling and font sizing, foreground/background colors candle coloring candle styles; candles, bars, line, high-low channel
zoom in/out
FREE

Limited time offer! For the launch of NextBot , which has been working on a real account for about a year doubling the initial capital, the price of this indicator will drop to FREE !
Introducing a pragmatic and innovative tool for MetaTrader 4 (MT4) traders: the Linear Regression Next channel indicator, enhanced with the determination coefficient R 2 . This indicator serves as a foundational tool for traders seeking to understand market trends through the lens of statistical analysis, s
FREE
Advanced Order Block Breaker Scanner
This Scanner is free to download but is dependent on you owning the advance order block breaker indicator. Need to purchase the indicator here: https://www.mql5.com/en/market/product/59127
MT5 version: https://www.mql5.com/en/market/product/62769
The Scanner will show you on a single chart all the timeframes (M1 to Monthly) with their own status for the indicator: advance order block breaker Scan all time frame and all symbol: breaker's smart al
FREE

We Trade Live Trend Levels This indicator is a fantastic addition to the We Trade Live Trend Max this helps filter out noise and helps with better entries into a trade this add on is a must have and we use it all the time along side We Trade Live Trend Max this is a fantastic tool to help with entering a trade and exiting a trade, This indicator Calculates Volume strength indicating levels of support and resistance for a trade, measures momentum in a market making buying or selling into the
FREE

This is an implementation of the well known SuperTrend Indicator. With this indicator you can see exactly the same values which will be alerted by the following SuperTrend Scanners:
SuperTrend Scanner SuperTrend Scanner FREE
Parameters SuperTrendATRPeriod: the period setting for the calculation of the SuperTrend SuperTrendMultiplier: the multiplier setting for the calculation of the SuperTrend
FREE
Highly configurable Macd indicator.
Features: Highly customizable alert functions (at levels, crosses, direction changes via email, push, sound, popup) Multi timeframe ability Color customization (at levels, crosses, direction changes) Linear interpolation and histogram mode options Works on strategy tester in multi timeframe mode (at weekend without ticks also) Adjustable Levels Parameters:
Stochastic RSI Timeframe: You can set the lower/higher timeframes for Stochastic RSI. Stochastic RSI
FREE
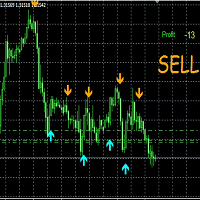
Your money-making tool is here!! This is an indicator that provides analysis and identification of the current trend in any time frame of any trading market, Product now free, please register by link here: Signals Vip :
Signal https://www.mql5.com/en/signals/2229365 BUY EA https://www.mql5.com/en/market/product/104810 Your job is to download it and drag and drop it into the indicator folder and wait for it to give you an opinion to help you decide to enter a better order and in the mea
FREE

The Trade by levels indicator is designed to automatically determine the formation of a model for entering the market on the chart of the selected instrument.
Definitions: ⦁ BFl is the bar that formed the level. ⦁ BCL1 and BCL2 bars, confirming the level.
The graphical model: ⦁ levels high\low the bars BFL and BCL1 must match the accuracy to the point ⦁ there can be any number of bars between BFL and BCL1. ⦁ between BCL1 and BCL2 intermediate ba
FREE

DONCHIAN CHANNEL DC É um indicador de tendência desenvolvido pela “Richard Donchian”, composto por 3 camadas, o canal superior, o canal inferior e o canal do meio. Ele é criado no Canal Donchian traçando os preços mais altos e mais baixos alcançados no período passado no gráfico de preços. Também é usado para medir a volatilidade do mercado, pois é um canal de expansão/contração de acordo com o aumento/diminuição da volatilidade dos preços. Method 0; Desenho do indicador do canal Donchian. Sinai
FREE

!!!The free version works only on "EURUSD"!!! WaPreviousCandleLevels MT4 shows the previous candle levels, it shows the previous candle Open High Low Close levels (OHLC Levels) in different time frame. It's designed to help the trader to analyse the market and pay attention to the previous candle levels in different time frame. We all know that the OHLC Levels in Monthly, Weekly and Daily are really strong and must of the time, the price strongly reacts at those levels. In the technical analys
FREE
Time your Entry and Exits with Average True Range (ATR) Trailing Stops ATR Trailing Stops are primarily used to protect capital and lock in profits on individual trades but they can also be used, in conjunction with a trend filter, to signal entries. The indicator will help make your calculation of stop loss easier as it will be visually aiding you in choosing where to put your stoploss level on the chart by calculating the current value of ATR indicator. For those who are unfamiliar with ATR, i
FREE

Fibonacci Retracement object is an object that has been provided by metatrader 4 platform. But Fibonacci Retracement object doesn't automated adjust the chart. You have to put and manage it manually to the chart. Because of that, this indicator was created. If you like using filbonacci retracement indicator, highly recommended to use Automated Fibonacci Retracement Indicator if you want to get better result in here:
https://www.mql5.com/en/market/product/95515
LT Automated Fibonacci Retrace
FREE
WHAT IS NEXT MOVE? SIMPLE ANSWER IS, THIS PROGRAM IS BASED ON PRICE ACTION THEREFORE FINDING NEXT MOVE IS EASY TO IDENTIFY THIS PROGRAM IS USING STANDARD CALCULATIONS FOR SUPPORT RESISTANCE IN SHAPE OF 2 WAYS TREND LINES SELECT HORIZONTAL LINES TREND LINES WILL GUIDE TRADERS TO TRADE IN RANGE WITH PIVOT LEVEL ALSO HORIZONTAL LINES GUIDE YOU ABOUT SUPPORT RESISTANCE OF DIFFERENT TIMEFRAMES FOR EXAMPLE: IF TRADER INTERESTED TO TRADE IN 15 MINUTES TIME FRAME, THEN HE CAN SELECT 15 MINUTES IN PR
FREE

Time Range Separator is a useful tool to display a separator period on your platform. You could go in the properties of the indicator, select the desired range and that's ALL. We believe it is a useful and necessary that we wish to share with you for free all our followers.
Input Values: TimeFrame Period Separator GMT_Hour (ex. +1 or -1) to move the lines at Period Time +/- tot hours in input Hide_dates to show or hide the datetime on vertical lines VLine_Color = Vertical Color Line VLine_Styl
FREE

Pivot Classic, Woodie, Camarilla, Fibonacci and Demark
Floor/Classic Pontos pivô, ou simplesmente pivôs, são úteis para identificar possíveis níveis de suporte/resistência, faixas de negociação, reversões de tendência e sentimento do mercado, examinando os valores alto, baixo e de fechamento de um ativo. Os Pontos Pivot Floor/Classic podem ser calculados da seguinte forma. Pivot Point (P) = (High + Low + Close)/3 S1 = P * 2 - High S2 = P - (High - Low) S3 = Low – 2*(High - P) R1 = P * 2 - Low
FREE

O indicador de tendência AI é um indicador comercial inovador criado usando tecnologias avançadas de rede neural para determinar com precisão a direção da tendência nos mercados financeiros. Este indicador fornece aos traders uma ferramenta de tomada de decisão intuitiva e informativa, baseada em uma análise aprofundada da dinâmica dos preços.
Características principais:
Rede Neural para Previsão de Tendências: O indicador de tendências de IA usa uma poderosa rede neural treinada em uma gra
FREE

O Indicador Chart High Low é um indicador para META TRADER 4, com a função de analisar e mostrar os níveis MÁXIMO semanal MÍNIMO semanal, MÁXIMO mensal e MÍNIMO mensal. Isso pode ajudar muito na hora de criar TrendLine ou até mesmo traçar sua linha de FIBONNACI, não sendo necessário acessar sites de Internet para analisar os níveis de MÁXIMA/MINÍMO. Em análises gráfica, pode auxiliar na quebra de níveis de MÁXIMA/MÍNIMA, criações de breakOut suporte e resistência. Há funções de "marcar" no indic
FREE
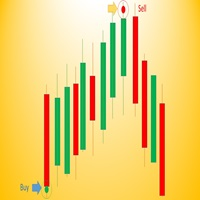
Wave Entry Alerts In Gold is a custom indicator developed by Azad Gorgis for MetaTrader 4. This indicator is designed to provide alerts based on ZigZag patterns, specifically tailored for trading on the Gold (XAU/USD) symbol.
Key Features: - Chart Window Indicator: The indicator is designed to be displayed on the main chart window. - Arrow Signals: The indicator generates arrow signals on the chart, indicating potential reversal points based on ZigZag patterns. - Customizable Parameters: Trad
FREE

Principles of construction of the indicator. The Absolute Bands (AB) indicator is reminiscent of the Bollinger Bands indicator with its appearance and functions, but only more effective for trading due to the significantly smaller number of false signals issued to them. This effectiveness of the Absolute Bands indicator is due to its robust nature. In the Bollinger Bands indicator, on both sides of the moving average - Ma, there are lines spaced from Ma by the standa
FREE

The Keltner Channel is a volatility-based technical indicator composed of three separate lines. The middle line is an exponential moving average (EMA) of the price. Additional lines are placed above and below the EMA. The upper band is typically set two times the Average True Range (ATR) above the EMA, and the lower band is typically set two times the ATR below the EMA. The bands expand and contract as volatility (measured by ATR) expands and contracts. Since most price action will be encompasse
FREE

Não é segredo que diferentes corretores e diferentes tipos de contas podem ter diferentes valores de spread (a diferença entre o preço Bid e Ask). Em tais condições, o mesmo ea negociará com resultados completamente diferentes. Quanto maior o spread do símbolo, menos lucro na transação você recebe e mais lucro o corretor recebe de você. Portanto, medir o spread é muito importante para a escolha do corretor e do tipo de conta, especialmente para as estratégias scalping, midnight e intraday.
FREE
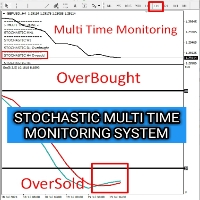
I made this Stochastic Indicator into multi time frame monitoring to monitor the occurrence of OverBuy and OverSell in real time on one monitor screen. My hope is that this indicator can help friends in the analysis process and also take trading moments with the system that friends have If this indicator is useful, friends can help me by giving likes to my channel and 5 stars on this indicator
Indicator Stochastic ini saya buat menjadi multi time frame monitoring untuk memantau terjadi nya
FREE
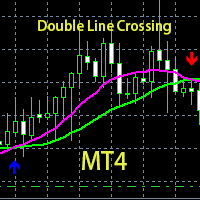
his is a custom indicator based on double-average crossing and arrow marking.
Make multiple lists when blue arrows appear up.
Make a blank list when the red arrow appears down.
When the pink line crosses the green line upwards, the pink line is above, the green line is below, the golden fork appears, and the blue arrow appears.
When the pink line crosses down through the green line, the pink line is below, the green line is above, a dead fork appears, and a red arrow appears.
This is a
FREE

Introducing ICT Reaction Levels, a reliable indicator designed to plot key levels on your chart. Unlike classical support and resistance, these levels are derived from significant highs and lows observed on higher timeframes, such as the weekly and monthly periods. The indicator provides a valuable tool for traders seeking to identify critical price levels based on historical price reactions.
ICT Reaction Levels analyzes price action on the specified timeframe, using special inputs to determi
FREE

FALCON ZONES , OPORTUNIDADES EN EL MERCADO PARA COMPORAR O VENDER
Características Destacadas: Identificación de Patrones de Velas: Reconoce una amplia gama de patrones de velas, desde patrones simples hasta formaciones más complejas. Proporciona una visión completa de la psicología del mercado encapsulada en las velas. Alertas Personalizadas: Configura alertas a medida para los patrones de velas que más te interesan o que se alinean con tu estrategia. Recibe notificaciones instantáneas cuando
FREE

O indicador analisa a estrutura de preços dos fractais e identifica possíveis pontos de reversão da dinâmica do mercado. Perfeito quando usado em combinação com outros tipos de indicadores.
Vantagens:
Funciona em todos os instrumentos e séries temporais, Não redesenha seus resultados, Cores personalizáveis de elementos indicadores, Funciona bem com qualquer estratégia de tendência, Ajustando a resistência dos fractais.
MT5 version -> HERE / Our news -> HERE
Strategy:
AW Flexible Frac
FREE
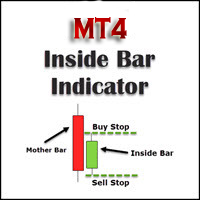
This inside bar indicator MT4 is suitable if you are doing inside bar trading. So what this MT4 inside bar indicator does is identifies inside bars for you as they form on your charts. Inside bar is a famous trading pattern in which the bar carry higher low and lower high compared with the previous bar, also known as mother bar. With, a lesser time frame like the 1 hour chart, daily inside bar chart will sometimes appears to be similar to a triangle pattern.
Inputs AlertOn - enable alerts Ema
FREE
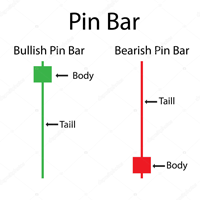
Pin bar pattern is characterized by a long upper or lower wick with a small body relative to the size of the wick with little to no lower or upper shadows. Pin bars are not to be traded in isolation , but need to be considered within the larger context of the chart analysis. A pin bar entry signal, in a trending market, can offer a very high-probability entry and a good risk to reward scenario.
Inputs MinimumTailPips- Minimum size of Tail in pips; TailBodyCandle- means how many times Tail gre
FREE

TrendExpert Indicator Overview
The TrendExpert indicator is designed to identify and visualize trend zones in financial markets. It utilizes zigzag high and low points to determine support and resistance levels, providing insights into potential market reversals and continuation patterns.
Features - Detection of support and resistance zones based on price action. - Strength categorization (Proven, Verified, Untested, Turncoat, Weak) based on historical testing. - Adjustable parameters fo
FREE

Looking for entry points along the local trend without repaint! Arrows indicate entry points. Based on classic indicators. The indicator is easy to use. Settings Наименование Описание Frequency factor Signal frequency. The less, the more often.
This affects the quality.
Recommendations Recommended for use on major currency pairs. Timeframe from m5, m15, m30 Subscribe to my telegram channel, where we discuss intraday trading, ideas, indicators, etc., a link in my profile contacts.
FREE

--- FREE VERSION - WORKS ONY ON EURUSD
------------------------------------------------------------------- This is a unique breakout strategy that is used for determination of the next short term trend/move. The full system is available on MQL5 under the name "Forecast System". Here is the link --> https://www.mql5.com/en/market/product/104166?source=Site Backtest is not possible, because calculations are done based on the data of all timeframes/periods. Therefore I propose you use the technol
FREE

RSI Candle Signal Indicator will change bars’ color when set overbought or oversold levels reach.
How to Use RSI Candle Signal Uptrend/Downtrends - RSI may be used to detect trending markets. For example, the RSI may stay above the mid line 50 in an uptrend. Top and Buttoms - RSI may help in identifying the tops around the overbought readings (usually above 70), and the bottoms around the oversold area (usually below 30). Divergence - divergence occurs when RSI directional movement is not c
FREE

Master Candle (MC) Indicator automatically detects "Master Candles", also known as "Mother Candles", i.e. candle that engulf several candles that follow them. See screenshots. You can choose how many candles Master Candle should engulf. By default it is set to 4. Feel free to change colour and thickness of lines as it suites you.
I find this indicator to be very useful to identify congestions and breakouts, especially on 60 minutes charts. Usually if you see candle closing above or below "Mast
FREE

Iceberg Divergence Indicator will help traders to find divergent patterns that occur on the charts very easily and simply This indicator will visualize divergences pattern that occur on the chart by combining it with an awesome oscillator indicator
Key Features: Easy to use : The Iceberg divergent indicator is made as simple as possible so that it is easy to use Pattern Visualization : Divergent patterns will be visualized on the live chart Precision : The indicator detects divergent patterns
FREE
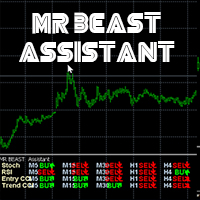
MRBEAST Assistant El indicador MR BEAST Assistant para MetaTrader es un indicador multitemporal que se basa en tres indicadores estándar: el oscilador estocástico, el RSI (Índice de Fuerza Relativa) y el CCI (Commodity Channel Index). Muestra las direcciones de la tendencia actual para los marcos temporales M1, M5, M15, M30, H1, H4, D1, W1 y MN1. Cuando se sigue un indicador de este tipo se tiene una visión clara de las tendencias en todos los marcos temporales importantes. No imp
FREE

This indicator will detect harmonic patterns that are drawn on the chart by manual and automatic methods. You can see user manual from this link: https://www.mql5.com/en/blogs/post/719257 There is a free version (it detect only Gartley and Nenstar Patterns) to try this product. You can buy the full MT4 version from: https://www.mql5.com/en/market/product/104689
Notes When you use this indicator and change the settings, add indicators like Moving Average or Bollinger Bands, this indicator will
FREE

Recommended on M15 and higher timeframes
Sends alerts and notifications when the zone is create
Sends alerts and notifications if zones are retested
You will see the trading zones and identify the most profitable points to open positions. The indicator marks the supply and demand zones.
With this show you will now make profitable trades that will set the trends.
Shows all support and resistance zones.
Can work in all time zones.
No need to mess with complicated settings, all setti
FREE
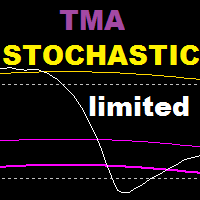
TMA Stochastic is an indicator based on stochastic oscillator and tma bands indicator , this indicator is based on a reversal strategy . Recommended time frame : 15 and above Recommended settings : lower values for scalping , higher values for swing trading WORKS ONLY ON EURUSD , GET THE FULL VERSION : https://www.mql5.com/en/market/product/108378 ======================================================================= Parameters : tma history : how many bars back to show tma bands on stochas
FREE

PLEASE TAKE NOTICE: This indicator is in current development. final version will be free.
This is a simple indicator that uses 3 timeframes in its formula to create Possible buy and sell signals. This indicator is optimized for the M1 timeframe Only. It has 2 types of Alerts: Push Notifications Audio Alerts UPDATES:
3/19/24: Still testing the final code
Troubleshooting: When loading the indicator, if you don't see the arrows on the current chart that means that MT4 has not loaded all the h
FREE

Daily pivot are relatively important in trading. This indicator have options to select 5 commonly use pivot point calculations. User input Choose Pivot Point Calculation ( Method Classic, Method Camarilla, Method TomDeMark, Method Fibonacci or Method Woodies. ) Choose Applied Timeframe for the calculation (M5, M15, H1, H4, D1, W1 etc) Can be attached to any timeframe Choose color of Pivot point For MT5 version, please refer here: https://www.mql5.com/en/market/product/38816
FREE

YOU CAN NOW DOWNLOAD FREE VERSIONS OF OUR PAID INDICATORS . IT'S OUR WAY OF GIVING BACK TO THE COMMUNITY ! >>> GO HERE TO DOWNLOAD
The popular saying in forex "The Trend is your friend" has always stood the test of time because it is valid statement for every generation of traders and in every market. Most successful traders do not fight against the trend but lend to flow with it.
Sometimes finding the best pair to trade can be a daunting task even when you have a good strategy . Som
FREE

BB & RSI Candle Color: Technical Analysis Indicator on MetaTrader 4 The "BB & RSI Candle Color" indicator is a powerful technical analysis tool designed for MetaTrader 4 traders looking for an effective visual representation of market conditions. Created by 13 Crow Trading Club, this indicator combines the popular Bollinger Bands and the Relative Strength Indicator (RSI) to provide clear and accurate visual signals. This indicator offers three key aspects: Candle Color: Normal candles are displa
FREE

Trend Lines Cross This indicator will alert you on any cross of a Trendline. You can draw up to two trend lines and form a channel, a pennant , a triangle or a simple trend and when the price crosses either trend line the indicator will provide you with alerts that you define plus an up or down arrow when the cross happened. How to: Draw the 1st trendline and name it tl1. Draw the 2nd trendline and name it tl2. Select which type of alerts you would like in the indicator properties and you a
FREE

Introdução do medidor de precisão:
O Accuracy Meter é uma ferramenta poderosa para determinar% de vitórias de estratégias, para mostrar todos os pontos de entrada e saída de negociações, como o testador de estratégia de meta trader, você pode ter um testador de estratégia simples como indicador no gráfico, anexá-lo em diferentes pares e prazos e descobrir o percentual de precisão da sua estratégia, altere o stop loss e o risco para recompensar o fator e veja como isso pode afetar sua ideia de
FREE

"Capture the sleeping and waking alligator." Detect trend entrance/exit conditions - this indicator can also be tuned according to your trading style. You can adjust a confidence parameter to reduce false positives (but capture less of the trend). This is based on a modification of the Alligator indicator by Bill Williams, an early pioneer of market psychology. 2 main strategies: either the " conservative" approach to more frequently make profitable trades (at a lower profit), or the " high r
FREE

The indicator draws the time scale on the chart. You can specify the time offset, adjust the size and font to display on the chart (it is displaying your local time on your chart instead of MT time). You can also select the desired format for displaying the date and time. While holding down the middle mouse button, and moving the cursor, a slider will appear on the scale. You may be interested in my other product , which contains a more advanced version of the Time Scale.
Parameters Hours (tim
FREE

O Indicador de Divergência RSI é uma ferramenta poderosa projetada para identificar possíveis reversões no mercado ao detectar discrepâncias entre o Índice de Força Relativa (RSI) e o movimento de preços. As divergências podem ser um sinal significativo de uma mudança de tendência iminente, seja de alta para baixa ou vice-versa. Este indicador foi criado para tornar a tarefa de identificar oportunidades de negociação potenciais mais simples e eficiente. Características: Detecção Automática: O i
FREE

Price Channels are also known as Donchian Channels being named after Richard Donchian. They use the highest and lowest price of a set number of periods to create an upper and lower channel or envelope around the price. The upper channel shows the high of the number of periods chosen. The lower channel shows the low of the number of periods chosen. For example, the screenshot shows the Price Channels using 320 periods. The upper channel in the screenshot shows the highest high of the previous 3
FREE

O indicador exibe dois pares diferentes em um gráfico, projetado para simplificar as informações exibidas,
Capaz de trabalhar com quase todos os instrumentos disponíveis no terminal (não apenas pares de moedas, mas também metais e matérias-primas). Recurso de usar um método de correlação visual para qualquer par de moedas Subsímbolo. O par de moedas é exibido na tela com velas coloridas. Este é o mesmo par correlacionado. Espelhamento. Moeda auxiliar. O indicador reflete dois tipos de corre
FREE

The indicator has combined 5 popular strategies. Draws an arrow after confirming a signal for the selected strategy. There are signal alerts. Doesn't redraw its values. I recommend watching my advisor - Night Zen EA
5 strategies. The main line crosses the signal line. The main line crosses the signal line in the oversold (for buy) / overbought (for sell) zones. The main line enters the oversold (for sell) / overbought (for buy) zones . The main line comes out of the oversold (for buy ) / ove
FREE
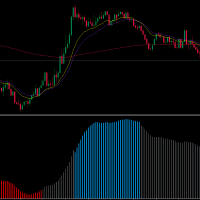
Welcome traders, MA SLOPE SCALPER is a really powerfoul tool to boost up your scalping! Have you been struggling with your scalping Strategies? Have you tried price action? Well, it does not work. Have you tried Rsi - Reversal Strategies? Well it'is not a clever idea. MA SLPOPE SCALPER IS A TREND FOLLOWER SYSTEM MA SLOPE SCALPER is based upon 3 different Exponential Moving averages that have bees studied and selected in order to maximize the precision of the signals! Ma SLOPE SCALPER has an
FREE

SX Price Action Patterns is a comprehensive indicator which shows various price action patterns on the chart for those who are interested in price action trading. These patterns are as follows: A Pin Bar is a candlestick price bar, which has a long wick on one side and a small body. It is a powerful signal of price reversal in a currency trading strategy. An Inside Bar is characterized by a bar or candle that is entirely ‘inside’ the range of the preceding one and represents the consolidation o
FREE

This indicator mostly inspired from BW-ZoneTrade custom indicator from MT5. How To Use:
BUY when both dots colored Green. SELL when both dots colored Red. In addition to original one, MACD-OsMA-generated signal also can be drawn. Input Description:
MA_period_short: Faster EMA period for MACD. Applied when drawMACD is true. MA_period_long: Slower EMA period for MACD. Applied when drawMACD is true. MACDperiod: MA period for MACD. Applied when drawMACD is true. drawMACD: When true, draw an addi
FREE
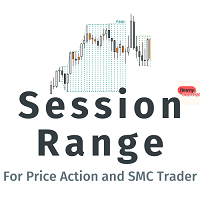
We all know that liquidity is one of the most important aspects in forex trading. The session high/low is a key part of this. That's why I created this indicator. Why Session Range? Helps traders spot session liquidity: Session high/low is one of the liquidity pools, especially during the Asian session. Helps traders know their position within a session: This indicator helps you identify which session is currently active—whether it is the Asian, London, or New York session. Good-looking app
FREE
Easily track and trade with the trend using this indicator. Uses a circle and line to indicate the trend direction. Excellent for channels. Features alert function.
Parameter TrendPeriod can be changed to your preference. How to use: Simply attach to any chart. Blue circle plus blue line cross below price = Buy. Red circle plus red line cross above price = Sell. Best results when taking higher time frames into consideration before entering a trade. (Hint: Wait for the radar/circle to appear on
FREE

The Pivot Point indicator automatically calculates and displays the pivot point line and support and resistance levels. Pivot can be calculated according to the Classic, Floor, Fibonacci, Woodie, Camarilla or DeMark formula. It is also possible to select the period for calculating the indicator. A trader can choose from daily, weekly, monthly, or user-defined periods.
Types of pivots Classic Floor Fibonacci Woodie Camarilla DeMark
Main features The indicator shows the current and histor
FREE

[ Thank reviewers by September 20, 2024 = 30 downloads ]
Este produto geralmente é vendido por US$ 30, mas estamos deixando você baixá-lo gratuitamente para dar suporte ao lançamento dos produtos principais! A parte legal é que você pode usá-lo em seu gráfico sem ter que executá-lo com o produto principal. Só um aviso, no entanto — alertas podem aparecer, já que este produto não está vinculado ao principal. Além disso, você pode experimentá-lo baixando a versão de teste gratuita dos seg
FREE

Defining Range ( DR ) and Implied Defining Range ( IDR ) indicator
Show DR and IDR ranges on the chart for Regular , Overnight and After Sessions
for more information how DR and IDR work and the high probability watch : https://www.youtube.com/@themas7er or https://twitter.com/IamMas7er
Remember to set set your chart TimeZone when you attach indicator to the chart under indicator settings / inputs
Volume Imbalance : https://www.mql5.com/en/market/product/91165?source=Site+Pr
FREE

Updates
9/12/2023 - If you are looking for the Spock EA, I don't sell it anymore. DM me for more info.
24/10/2023 - Check out my other products. Starting to roll out some EAs & indicators based on this range.
Currently there is no MT5 version. I am using MT4 myself.
So I will spend my time mostly to develop more extensive stats for the Stats version and maybe even an EA. But I might develop a MT5 version.
All depends on the demand. Meaning, the more people request it, the bigger the
FREE

A classical MACD indicator where both the MACD line and the Signal line are displayed as lines. The difference between MACD and Signal line is displayed as a histogram. A user can change the color and thickness of histogram lines. So, histogram lines can be grouped into four different groups: positive ascending, positive descending, negative descending and negative ascending. Multi-currency Dashboard for the indicator is available https://www.mql5.com/en/market/product/72354
FREE

ATR Bands with Take-Profit Zones for MT4 The ATR Bands indicator for MT4 is designed to assist traders in managing risk and navigating market volatility. By using the Average True Range (ATR), it helps identify key price levels and set realistic stop-loss and take-profit zones. Key Features: ATR-Based Bands : The indicator calculates dynamic upper and lower bands using ATR. These bands adjust based on price volatility, helping to indicate potential support and resistance levels. Customizable Par
FREE
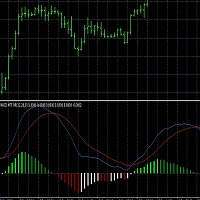
This script generates a MACD with 6 color-coded histogram bars based on the position (above or below zero) and direction (rising or falling) of the histogram. It provides multi-time frame support , allowing users to view the MACD from different time frames on a single chart. The indicator uses customizable settings for MACD periods, histogram width, and vertical scaling. This script could be useful for traders who want a visually enhanced MACD with clearer trend and momentum representation acro
FREE
O Mercado MetaTrader é o melhor lugar para vender robôs de negociação e indicadores técnicos.
Você apenas precisa desenvolver um aplicativo para a plataforma MetaTrader com um design atraente e uma boa descrição. Nós vamos explicar como publicar o seu produto no Mercado e oferecer a milhões de usuários MetaTrader.
Você está perdendo oportunidades de negociação:
- Aplicativos de negociação gratuitos
- 8 000+ sinais para cópia
- Notícias econômicas para análise dos mercados financeiros
Registro
Login
Se você não tem uma conta, por favor registre-se
Para login e uso do site MQL5.com, você deve ativar o uso de cookies.
Ative esta opção no seu navegador, caso contrário você não poderá fazer login.