YouTubeにあるマーケットチュートリアルビデオをご覧ください
ロボットや指標を購入する
仮想ホスティングで
EAを実行
EAを実行
ロボットや指標を購入前にテストする
マーケットで収入を得る
販売のためにプロダクトをプレゼンテーションする方法
MetaTrader 4のための無料のテクニカル指標 - 2

This is the best Support and Resistance Indicator on the market, and it shows both confirmed Support and Resistance as well as Retests. Support & Resistance: Support marks where buying demand halts price declines, acting as a safety net. Resistance caps price surges, driven by selling pressure. Traders leverage these levels to predict reversals, plan entries, exits, and manage risks, making them trading's fundamental guideposts. Join To Learn Market Depth - https://www.mql5.com/en/channels/suv
FREE

This indicators automatically draws the Trend Channels for you once you've dropped it on a chart. It reduces the hustle of drawing and redrawing these levels every time you analysis prices on a chart. With it, all you have to do is dropped it on a chart, adjust the settings to your liking and let the indicator do the rest. Get an alternative version of this indicator here: https://youtu.be/lt7Wn_bfjPE For more free stuff visit: https://abctrading.xyz
Parameters 1) Which trend do you want t
FREE
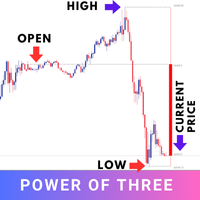
The "Power of Three" (PO3) is a concept developed by the Inner Circle Trader (ICT) to illustrate a three-stage approach used by smart money in the markets: Accumulation, Manipulation, and Distribution . ICT traders view this as a foundational pattern that can explain the formation of any candle on a price chart. In simple terms, this concept is effective for any time frame, as long as there's a defined start, highest point, lowest point, and end. MT5 - https://www.mql5.com/en/market/product/124
FREE

The Supply and Demand Zone Indicator is a powerful and easy-to-use tool designed to help traders identify critical supply and demand zones on the chart. These zones can provide valuable insight into potential market reversals, breakouts, and important price levels where buyers or sellers are likely to take control. The best FREE Trade Manager . If you want to create your own Hedging or Grid strategies without any coding make sure to check out the ManHedger Key Features: Automatic Zone Detect
FREE

このインジケータは、フラット位置とトレンド位置を表示するために使用されます。 設計は発振器に基づいています。 これは、通常のチャート上の取引のために、バイナリオプションの両方のために、追加のフィルタとして使用されます。 フラットの場所は、スマートマネーの概念に従って取引するための指標 UPD1Volume Cluster で使用されます。 内蔵のアラートは、最大の買われ過ぎ/売られ過ぎの場所を通知します。
入力パラメータ 。
基本設定 。 Bars Count - 指標が表示されるバーの数を指定します 。 Period - オシレータの周期を選択します 。 Start Flat After Bar - フラット描画を開始するために、トレンドの終了後に無視するバーの数 。
視覚的な設定 。 Color - 自動または手動で 。 Floor Color - 色が「手動」に設定されている場合は、独自の色を設定できます 。 Histo Width (0 - Auto) - ヒストグラムの太さを選択するか、自動モードを設定します 。
Alert Settings 。 Alert - 通
FREE
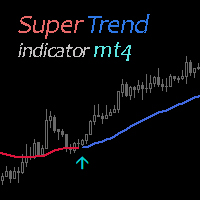
Super Trend Indicator uses two moving averages for calculating the trend direction. Combination with other market signals and analysis is necessary and provides more stable results. Indicator can be easily customized by the user including change of colors, with and arrow sizes.
FREE Super Trend Expert Advisor > https://www.mql5.com/en/market/product/81160?source=Site +Profile+Seller
FREE

Fair Value Gap Finder detects fair value gaps and generates a signal when price returns to one. Set the minimum and maximum fvg size, customize the colors, style, and length, then let the indicator highlight them for you.
Key Features: Automatic FVG highlights - The indicator detects all fair value gaps that fit your criteria and marks them on the chart.
Entry Signal - A signal is created whenever price retests a fair value gap.
Notification - Alerts notify you when a fair value gap
FREE

The Anchored VWAP Indicator for MetaTrader 4 gives you full control over where your VWAP starts. Instead of being locked to session opens or fixed times,
you simply drag the anchor point on the chart , and the VWAP instantly recalculates from that exact bar.
This makes it perfect for analyzing:
• Institutional entry zones
• Breakout origins
• Swing highs/lows
• News reaction points
• Trend continuations Key Features Drag & Drop Anchor Point : Move the starting point directly on the cha
FREE
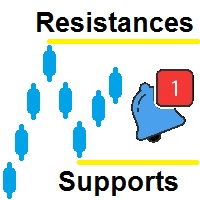
サポートとレジスタンスは、いくつかの異なる時間枠で自動的にトップとボトムを識別し、現在のチャートにこれらのトップとボトムをプロットするのに役立つように作成されました。 レジスタンスの作成の説明に行きましょう 上部と下部を定義できるルール フィールドがあり、上部のルールはデフォルトで次のように設定されます。 H[ 0 ]<=H[ 1 ] and H[ 1 ]=>H[ 2 ]
どこ:
エレメント 説明 H ハイを 意味します
[0] 現在の ろうそく を意味します [1] 前の ろうそく を意味します <= より低いか等しいこと を意味します => より高いか等しいこと を意味します
したがって、この式では、最初に次のルールを使用して、現在の高値が前の高値以下であるかどうかを確認します。 H[ 0 ]<=H[ 1 ] 次に、次の式を使用して、前回の高値が前回の高値以上であるかどうかを確認します。 H[ 1 ]=>H[ 2 ] 「And」は 2 つの表現を結合し、true の場合、新しい抵抗があることを意味します。 and ただし、マークを付けるには正しいろうそくを選択する必要
FREE

This is a multi-timeframe version of the popular Hull Moving Average (HMA).
The Double HMA MTF Light indicator combines two timeframes on a single chart. The HMA of the higher timeframe defines the trend, and the HMA of the current timeframe defines short-term price movements.
The indicator is freely distributed and hasn't audio signals or messages. Its main function is the visualization of price movements. If you need advanced functionality of the HMA multi-timeframe indicator (information ab
FREE
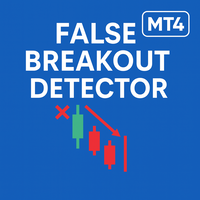
False Breakout MT4 は、価格が最近のサポートまたはレジスタンスレベルを一時的に突破したように見えて、すぐに元のレンジに戻る「偽のブレイクアウト」を検出するためのインジケーターです。これらの偽のブレイクアウトは、裁量的な分析や逆張り戦略に有用で、予測的な自動シグナルを出すことなく視覚的な手がかりを提供します。 主な機能: 直近の高値・安値付近での偽のブレイクアウトを自動検出(例:2日間にわたる拡張された日足レベル)。 失敗したブレイクアウトを矢印やトレンドラインで明確に可視化。 ポップアップおよびプッシュ通知によるカスタマイズ可能なアラート(デバイスの設定が必要)。 ユーザー設定可能なパラメータ:スキャンするバー数、ピップ許容度、矢印のオフセット、色など。 高速動作とバックテストに最適化された軽量実装。 予測アルゴリズムは使用せず:保証されたシグナルは出さず、テクニカル判断を支援するツール。 互換性: タイムフレーム:M1 から H4。 対象:FX、インデックス、株式、コモディティ。 注意: 本バージョンは False Breakout MT4 と名付けられています。
FREE

Pips Chaser は、マニュアル取引を補完するために開発されたインジケーターです。このインディケータは短期スキャルピングと長期スイングトレードの両方に使用することができます // MT5バージョン
特徴 リペイントなしインジケーター このインディケータは、新しいデータが到着しても値を変更しません。 取引通貨ペア 全ての通貨ペア 時間軸 H1が望ましいが、どのタイムフレームにも適用可能。 取引時間 24時間 Buffers Buy Buffer: 0 / Sell Buffer: 1
必要条件
一部のポジションのスキャルピングには、スプレッドが狭いECNブローカーの利用が必須です。 中程度のインパクトと高いインパクトのニュースリリース時間には取引しないこと。
インストール方法
ご希望の取引ペア(H1推奨)にインジケータを装着してください。
設定方法
インジケーターの設定です 。 インジケーターのパラメータを変更し、自分に合った戦略を採用することができます。 追加設定 ここでは、インジケータの様々な部分の色を変更することができます。また、アラートの設定を変更することがで
FREE
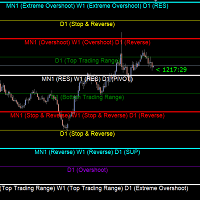
Gold Levels MTF - this is a fine stock technical indicator. The indicator algorithm analyzes the movement of the asset price, displays price levels of support and resistance from all time frames (TF) using the Murray method based on the Gann theory. The indicator indicates overbought and oversold fields, giving an idea of possible reversal points and at the same time giving some idea of the strength of the current trend. Description of levels: (Extreme Overshoot) - these levels are the ultimat
FREE

Moving Average Convergence Divergence(MACD)トレーディング戦略は、勢いとトレンドの方向の変化を特定するために使用される人気のあるテクニカル分析ツールです。 MACDは、26期間の指数移動平均(EMA)から12期間のEMAを引いて計算されます。 MACDの上には、トリガーとして機能する9期間のEMAである「シグナルライン」がプロットされます。 MACDラインがシグナルラインの上にある場合、MACDはブルッシュ領域と見なされ、下にある場合はベア領域と見なされます。トレーダーはこの情報を使用して、潜在的な買いと売りの機会を特定することがよくあります。 MACDは多目的な指標であり、さまざまな方法で使用できます。一般的な使用方法のいくつかは次のとおりです。 クロスオーバー:MACDラインがシグナルラインを上回るときにはブルッシュクロスオーバーが発生し、MACDラインがシグナルラインを下回るときにはベアクロスオーバーが発生します。 ダイバージェンス:MACDが新しい高値をつけている間に基礎となるセキュリティがそうでない場合、ブルッシュダイバージェンスが発
FREE

この情報インジケーターは、アカウントの現在の状況を常に把握したい人にとって役立ちます。このインジケーターには、ポイント、パーセンテージ、通貨での利益、現在のペアのスプレッド、現在の時間枠でバーが閉じるまでの時間などのデータが表示されます。 バージョンMT5 - より便利なインジケーター
チャート上に情報線を配置するには、いくつかのオプションがあります。 価格の右側 (価格の後ろにあります); コメントとして (グラフの左上隅に); 画面の選択した隅。 情報区切り記号を選択することもできます。 | / 。 \ # インジケーターにはホットキーが組み込まれています。 キー 1 - 情報表示の種類に戻ります (価格、コメント、コーナーの右側) キー 2 - 情報表示の種類を 1 つ進みます。 キー 3 - 情報ライン表示の位置を変更します。 ホットキーは設定で再割り当てできます。 このインジケーターは使いやすく、非常に有益です。設定で不要な情報項目を無効にすることも可能です。
設定 表示された情報を置き換えるホット キー (戻る) - 情報表示の種類に戻ります。 表示情報を切り替
FREE

Star Reversal Pro - Morning & Evening Star Pattern Detector with Advanced Filters Star Reversal Pro is a professional technical indicator for MetaTrader 4 that automatically detects Morning Star and Evening Star candlestick patterns. The indicator features an intelligent trend filter and Higher Timeframe confirmation to improve signal quality and reduce false signals. Main Features: The indicator precisely detects Morning Star (bullish reversal signal) and Evening Star (bearish reversal signal)
FREE

Free Market structure zig zag to assist in price action trading the screenshots describe how to use and how to spot patterns new version comes with alerts, email alert and push notification alert can be used on all pairs can be used on all timeframes you can add additional confirmation indicators the indicator shows you your higher high and low highs as well as your lower lows and lower highs the indication makes price action analysis easier to spot.
FREE

Scalper Arrow x is a buy sell arrow type indicator, the strategy behind its signals is based on the MFI indicator with trend filter using Halftrend formula, this indicator can be used alone or mixed with other tools. NOTE : THIS INDICATOR DOESN'T REPAINT OR BACK PAINT, AND ITS ARROW SIGNALS ARE NOT DELAYED. ---------------------------------------------------------------
FREE

Consolidation Zone Indicator is a powerful tool designed for traders to identify and capitalize on consolidation patterns in the market. This innovative indicator detects consolidation areas and provides timely alerts when the price breaks above or below these zones, enabling traders to make informed trading decisions. MT5 Version : https://www.mql5.com/en/market/product/118748 Join To Learn Market Depth - https://www.mql5.com/en/channels/suvashishfx
Key Features:
1. Consolidation Detecti
FREE
Hi Trader, ================================================================================ If you like my indicator, please do not hesitate to give a review and/or comment. Thank you! ================================================================================
This indicator draws trade entry zone and target levels based on the levels of the previous day.
A blue zone (BUY) or red zone (SELL) is drawn and two targets. The optimal trade entry value is also indicated.
A second gray zone is
FREE
概要
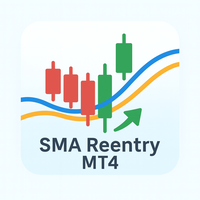
SMA Reentryは、主要トレンド内での再エントリーポイントを特定するために設計されたMetaTrader 4用インジケーターです。短期的な値動きを捉える高速SMAと、市場全体の方向をフィルタリングする低速SMAの2本の単純移動平均線を使用します。 高速SMAが低速SMAの上にあり、前のローソク足で高速SMAを下回った後に再び上抜けした場合は買いシグナルが発生します。高速SMAが低速SMAの下にあり、前のローソク足で高速SMAを上回った後に再び下抜けした場合は売りシグナルが発生します。 動作原理
矢印はローソク足の値幅に比例した距離でチャート上に描画され、視認性を向上させます。シグナルはローソク足の確定時に生成され、再描画や誤ったアラートを防ぎます。 アラート機能
ポップアップ、Eメール、プッシュ通知によるアラート送信が可能です。各アラートタイプはトレーダーの好みに応じて個別に有効・無効を設定できます。 メリット 2本の移動平均線によるフィルタで逆張りエントリーを回避 チャート上に明確かつ即時のシグナルを表示 期間、色、矢印の距離を自由にカスタマイズ可能 軽量設計で全て
FREE

MT4用 マーケットストラクチャーシフトとフェアバリューギャップ (FVG) インジケーター このMT4インジケーターは、市場構造の変化とフェアバリューギャップ(FVG)を特定し、トレーダーに潜在的な取引機会を提供します。モバイル通知を通じてこれらのイベントをユーザーに警告し、変化する市場状況に迅速に対応できるようにします。 主な特徴: 市場構造シフトの検出: スイング高値/安値のブレイクと、平均と比較して значительный なキャンドル本体サイズに基づいて、強気と弱気の市場構造シフトを識別します。チャート上の上/下矢印で視覚化されます。 フェアバリューギャップ (FVG) の識別: 過去3本のキャンドルの価格アクションに基づいて、強気と弱気のFVGを検出します。 FVGはチャート上で色付きの長方形で強調表示されます。 モバイル通知: マーケットストラクチャーシフトとFVG形成の両方に関するリアルタイムのモバイル通知を受信し、潜在的な取引設定を見逃さないようにします。 カスタマイズ可能なパラメータ: ルックバック期間 (Lookback Period): スイング高値/安値計
FREE

チャート投影インジケーター チャートの予測は、組み込みのジグザグテクニカルインジケーターを使用して将来の価格アクションを予測する小さなインジケーターとして始まりました(古いアルゴリズムはコメントで見つけることができます)
アイデアは単純で、 過去の価格行動は未来に変換されませんが、過度に具体的、または過度に一般的でない場合は、何が起こる可能性があるかについてのガイドラインを抽出できます。
チャート投影の「論文」はこれです: トレーダーはチャートを見て決定を下すので、アルゴリズムはチャートも見ることができます。指標値を読み取らない、価格を読み取らないが、チャートを見る 何かを探すことは、繰り返しのなじみのあるパターンを見つけることです。そして、そのなじみのあるパターンを見つけるためには、それを保存する必要があります。
ジグザグはそれだけでは不十分であり、それを実行し、チャートの視覚的側面に関するデータを保持する新しいアルゴリズムが必要でした。したがって、光学アルゴリズムが必要でした。
チャートプロジェクションには、ペア価格アクションの低、中、高範囲スキャン用の3つの光学アルゴリ
FREE
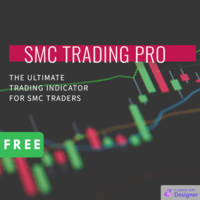
Welcome to the world of SMC (Smart Money Concepts) Trading, where we empower traders with the tools and knowledge to make smarter trading decisions. Our latest addition to our suite of trading tools is the SMC Trading Pro indicator, version 1.0. Key Features: Major Market Structure Identification with BODY break. Order Block must be in Major Swing ( not Small Swing ). Order Block with Fair Value Gap Detection. Order Block in Discount | Premium zone. Filter for only Bullish, Bearish or All Order
FREE
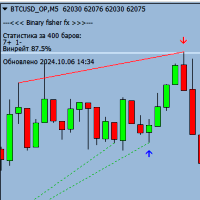
Binary Fisher FX は、あらゆる時間枠と通貨ペアで機能する強力なバイナリー オプション インジケーターです。このインジケーターはトレンドの動きを識別するように設計されており、現在のローソク足が閉じる前に矢印の形でエントリーポイントを示します。
インジケーターの主な特徴:
あらゆる時間枠で動作します (M1、M5、M15、M30、H1、H4、D1) あらゆる通貨ペアをサポート 有効期限は 1 ~ 3 キャンドル (デフォルトは 1 キャンドル) 現在のローソク足が閉じる前にエントリーポイントを矢印の形で示します トレンドに応じて機能するため、大きく変動する市場を特定できます。 重要な情報:
インジケーターが正しく機能するには、ターミナルフォルダーに「MQL5」フォルダーをダウンロードしてインストールする必要があります。リンクからインジケーターが含まれるフォルダーをダウンロードできます: https://disk.yandex.ru/d/DPyo0ntaevi_2A Binary Fisher FXインジケーターを使用する利点:
トレンドの動きを正確に特定することで
FREE

Scalping Edge Pro Indicator Unleash the Power of Precision Trading: Introducing Scalping Edge Pro Tired of market noise and conflicting signals that cloud your judgment? Are you searching for a tool that delivers the clarity and confidence needed to seize rapid opportunities in volatile markets? Scalping Edge Pro is the engineered solution designed for traders who demand precision and professionalism in every trade. It is meticulously calibrated for peak performance on the 15-minute (M15) timef
FREE
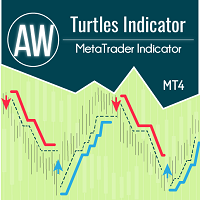
このインジケーターはタートル システムに従って機能し、古典的に 20 ローソク足と 55 ローソク足の時間間隔を想定しています。傾向は、指定された時間間隔にわたって監視されます。エントリーはサポートまたはレジスタンスレベルを下抜けた瞬間に行われます。出口シグナルは、同じ時間間隔のトレンドの反対方向への価格ブレイクアウトです。 利点:
金融商品: 通貨ペア、株式、商品、指数、暗号通貨 タイムフレーム: 古典的には D1、あらゆるタイムフレームでの作業にも適しています 取引時間: 24時間 資金管理戦略: 取引あたりのリスクは 1% 以下 追加注文を使用する場合、追加ポジションごとのリスクは 0.25% MT5 indicator version -> HERE / AW Turtles EA MT4 -> HERE / More products -> HERE エントリールール: 1) 短いエントリー: エントリー条件は20日間の高値または安値をブレイクアウトすることです。
前のシグナルが成功した場合、取引はスキップされます。
注記!以前の取引が利益で終了した場合
FREE
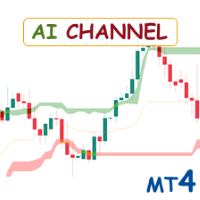
Special offer : ALL TOOLS , just $35 each! New tools will be $30 for the first week or the first 3 purchases ! Trading Tools Channel on MQL5 : Join my MQL5 channel to update the latest news from me AI Channels インジケーターは、クラスタリング分析における強力な機械学習技術である ローリングK-平均クラスタリング を使用して、価格の基礎的なトレンドについてリアルタイムの洞察を提供します。このインジケーターは、クラスタ化された価格データに基づいた適応チャネルを作成し、トレーダーがトレンド方向や市場の状況について情報に基づいた判断を下せるようにします。 インジケーターにはリスク管理に柔軟性を持たせるため、 トレーリングストップオプション も設定内に含まれています。 MT5バージョンを見る: AI Channels MT5 他の製品を見る: すべて
FREE

このプロジェクトが好きなら、5つ星レビューを残してください。 このインジケータは、指定されたためのオープン、ハイ、ロー、クローズ価格を描画します
特定のタイムゾーンの期間と調整が可能です。 これらは、多くの機関や専門家によって見られた重要なレベルです
トレーダーは、彼らがより多くのかもしれない場所を知るために有用であり、
アクティブ。 利用可能な期間は次のとおりです。 前の日。 前週。 前の月。 前の四半期。 前年。 または: 現在の日。 現在の週。 現在の月。 現在の四半期。 現年。
FREE
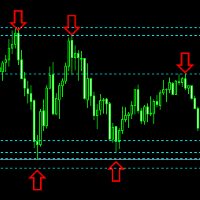
.....................................hi....................... ................for showing high s and low s and support and resistanses .....................we have a lot of ways............................... it can be helpful for finding trends , higher highs , higher lows , lower highs , lower lows
.......................today i write on of thems.......................... ........................you can enter the number of last support and resistanses .........................and it will dra
FREE
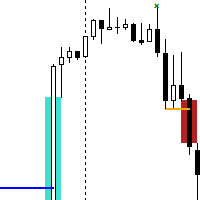
The Break of Structure (BoS) and Change of Character indicator with Fair Value Gap (FVG) filter is a specialized tool designed to enhance trading strategies by pinpointing high-probability trading opportunities on price charts. By integrating the BoS and Change of Character concepts with the FVG formation, this indicator provides traders with a robust filtering mechanism to identify optimal entry and exit points. The indicator identifies instances where the structure of price movements is disrup
FREE

1.需給は取引に使用されるコア戦略の1つである。それは古代の需給法則と自由流動市場における価格の動きに注目している。この戦略の基本は、利用可能なツールの数と購入者のツールに対するニーズが価格を決定することです。グラフには、需要が供給(需要領域)を圧倒し、価格上昇を推進する領域または供給が需要(供給領域)を圧倒し、価格下落を推進する領域が示されています。多くの需給トレーダーは、多頭または空頭頭頭頭頭頭頭寸に入る前に、これらの主要な売買活動が発生した地域に価格が入るのを待っている。 2.需要領域で購入し、供給領域で販売することは意味がありますが、再テストされた領域よりも新鮮な領域の方が効果的であることを覚えておいてください。これらは、継続的な傾向の進入領域として使用することも、変化傾向の逆転領域として使用することもできます。大胆に取引を行うことも、保守的に行うこともでき、取引ごとに独自の参入や脱退ルールがある。これらの規則に従ってグラフを作成するツールにより、ユーザーはグラフ上でこれらのレベルを直感的に認識することができます。 3.グラフのK線が黄色になると、価格は突破しようとしている。
FREE

トレンドの識別インジケータを使用すると、非常に正確に、そして最も重要なこととして、わずかな遅延で、(1)真のトレンドの動きの開始、および(2)フラットを識別できます。このような指標は、スキャルパー戦略による取引と長期取引戦略の使用の両方に使用できます。インディケーター操作アルゴリズムは、最後のスクリーンショットで詳しく説明されています。 指標の読みは視覚的で非常に単純で、コメントを必要としません。インディケータの青い線は上昇トレンドを表し、金色の線はフラット、そして赤い線は下降トレンドです。したがって、赤または金の線が青に置き換えられた場合はBuyのエントリポイント、青または金の線が赤に置き換えられた場合はSell - のエントリポイントです。 このインディケータにはあらゆる種類の警告があります。(トレンド方向の)インジケーターの表示が最後の2つのバーに一致すると、アラートがアクティブになります。 価格の動きの方向が変化する可能性のある瞬間も
FREE

The indicator analyzes the volume scale and splits it into two components - seller volumes and buyer volumes, and also calculates the delta and cumulative delta. The indicator does not flicker or redraw, its calculation and plotting are performed fairly quickly, while using the data from the smaller (relative to the current) periods. The indicator operation modes can be switched using the Mode input variable: Buy - display only the buyer volumes. Sell - display only the seller volumes. BuySell -
FREE

It works based on the Stochastic Indicator algorithm. Very useful for trading with high-low or OverSold/Overbought swing strategies. StochSignal will show a buy arrow if the two lines have crossed in the OverSold area and sell arrows if the two lines have crossed in the Overbought area. You can put the Stochastic Indicator on the chart with the same parameters as this StochSignal Indicator to understand more clearly how it works. This indicator is equipped with the following parameters: Inputs d
FREE

Buy Sell Signal Low TF gives buy/sell signals and alerts with up and down arrow at potential reversal of a pullback or a trend continuation pattern in low timeframe. This is an indicator which gives signals based on trend => It works best in trend market with the principle is to ride on the trend not trade against the trend.
The components of Buy Sell Signal Low TF: - The trend is determined by SMMA 13 , SMMA 21 and SMMA 35 ( can be changed manually to suit your preference). - The signal is b
FREE
価格アクション取引を強化するHigher Highs and Lows MT4インジケーターは、フラクタル分析を活用して重要なスイングポイントを特定し、Higher Highs (HH)、Lower Highs (LH)、Lower Lows (LL)、Higher Lows (HL) などのトレンド定義パターンを識別し、市场方向の明確な洞察を提供します。1900年代初頭のダウ理論に根ざした価格アクションの基礎原則に基づき、現代取引でAl Brooksの "Trading Price Action" シリーズのような専門家により普及したこのインジケーターは、トレンド継続と反転を検出するトレーダーの必需品となっています。特に外汇、株式、暗号通貨トレーダー間で人気があり、上昇トレンド (HH/HL) または下降トレンド (LL/LH) を確認する能力により、ノイズをフィルタリングし、プルバック中のエントリータイミングを決め、偽ブレイクを避ける—ボラティルセッションでの精度を高め、感情的な決定を減らし、スカルピングからポジショントレーディングまでの戦略で全体的な収益性を向上させます。 Hig
FREE
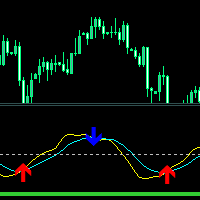
Crossing Line Indicator - トレンドの方向へのインパルスの動きを早期に検出するために設計されたインジケーター。
スムージングと動作修正を備えた RVI インジケーター上に構築されたオシレーターが含まれています。 2 本の細い線が交差すると、価格が変化する瞬間が発生し、その結果として衝動または激しい動きが発生する可能性があります。
トレンドの方向を決定するための指標は、加重 MA 指標に基づいています。太い薄緑色の線が中心レベルより下にある場合は下降傾向、上にある場合は上昇傾向を示します。
使いやすく、パラメータの設定も簡単です。メインチャートは読み込まれません。
インジケーターの機能
シグナル矢印は現在のローソク足に表示され、再描画されません。 信号が発生したときに複数の種類のアラートを提供します。 これは汎用性があり、あらゆる取引商品や時間枠で使用できます。 主にスキャルピングや短期取引に使用できます。
入力パラメータの設定
このインジケーターには、計算を調整するための 2 つの主要なパラメーターが含まれています。 Period of tre
FREE

基本的な需給インジケータは、あなたの市場分析を強化し、あらゆるチャート上の重要な機会領域を特定するために設計された強力なツールです。直感的で使いやすいインターフェイスで、この無料のメタトレーダー用インディケータは、需給ゾーンを明確に表示し、より多くの情報に基づいた正確な取引判断を可能にします / MT5無料版 この指標のダッシュボードスキャナー: ( Basic Supply Demand Dashboard )
特徴 チャートの需給ゾーンを自動的にスキャンし、面倒な手動分析を不要にします。 直近の需給ゾーンまでの残り距離をグラフィカルに表示 供給ゾーンは特徴的な色で強調表示され、需要ゾーンは別の色で表示されるため、迅速かつ正確な解釈が可能。 このインディケータは、最も近い供給ゾーンまたは需要ゾーンとチャート上の現在価格との距離をpips単位で自動的に計算し、明確かつ定量的な指標を提供します。pips単位の距離はチャート上にはっきりと見やすく表示され、現在価 格との距離が大きい、または小さいエリアを素早く特定できます。 需給ゾーンの接近やブレイクを警告 どのタイムフレームでも機
FREE
Multi Timeframe Buy and Sell Power MT4
The Multi Timeframe Buy and Sell Power indicator for MetaTrader 4 is a versatile tool designed to provide traders with a clear visual representation of market pressure across nine standard timeframes, from M1 to MN1. By aggregating buy and sell strength percentages derived from recent price action and tick volume, it helps identify potential trends, reversals, and neutral conditions in real-time. The indicator displays this information in a compact dashbo
FREE

MACD divergence indicator finds divergences between price chart and MACD indicator and informs you with alerts (popup, mobile notification or email). Its main use is to find trend reversals in the chart. Always use the divergence indicators with other technical assets like support resistance zones, candlestick patterns and price action to have a higher possibility to find trend reversals. Three confirmation type for MACD divergences: MACD line cross zero level Price returns to previous H/L Creat
FREE

The Omega Trend Indicator is an advanced tool that has been specifically designed to detect market trends early, and follow them efficiently. The indicator draws two lines. The main (thicker) Trend Line represents the presumed lower or upper volatility limits of the current market trend. A break in the main Trend Line indicates a potential reversal or shift in the movement of the trend. The Trend Line also indicates the best point to place a stop loss order. In Omega Trend Indicator, the Trend L
FREE

クオンツ移動平均勾配は、方向性と勢いを与える非常に強力な指標です。 インジケーターは塗り直しではありません。ma角度を効率的に計算してトレンドを見つけることができます。
シグナルキャンドルが閉じられると、利益カウントが始まります。 したがって、ライブで行われるのは正確な結果です。
提案されたTimeFrameはH1でそれを使用しています。 インジケーターのすべてのオプションは編集可能です。
ヒント:トレードスイングとトレンドブレイクアウトの方向。 フラクタル、練行足、ボリンジャーバンドは、精度と収益性を向上させることができます。
高低は、角度線の発散アプローチを使用して見つかる可能性があります。 このインジケータは、サポート抵抗、供給需要インジケータの追加確認として使用できます。
Ma勾配情報は、トレンドの方向と出口点を使用して入力するのに非常に役立ちます。 それは外国為替、株式、インデックスのために働きます。
PushNotifications / Email / SoundAlerts / PopUpAlertsでアラートを受け取ることができます。
改善が必要な場合はい
FREE

Trading doesn’t have to be complicated. With the right visual guidance, market decisions become clearer, calmer, and more confident.
Nebula Arrow is designed to help traders focus on what truly matters: high-quality entries based on refined market behavior. Just load it on your chart and let the arrows guide your trading decisions. Trade With Confidence We believe that simplicity is power. Nebula Arrow was created after extensive market observation and practical research, transforming complex
FREE

Auto Fibo は、手動での取引を強化するために開発されたインジケーターです。自動で黄金比を描き、時間を節約し、取引を円滑にします。 グラフにインジケータを取り付けると、自動的に正確な黄金比が描かれるので、臨界点を探す手間が省けます。 インターフェイスは、お使いのコンピュータに応じて、バンドのおおよそのハイポイントとローポイントに調整されます。 このインジケータは、ほとんどの始点と終点の選択ミスを修正します。 各バンドには、正確な価格が表示されます。 警告 私はMQL5.comで私のEAを販売するだけです。もし誰かが私のEAを売ってくれと連絡してきたら、それはあなたのお金が欲しいだけの詐欺師です。
また、もしあなたが私のEAを外部のウェブサイトから購入した場合、それは偽のバージョンであり、オリジナルのものと同じようには動作しないことを保証します。
FREE
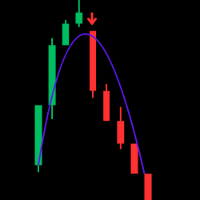
Trend WTS — Advanced Modular Trend & Signal Indicator for XAUUSD (M5 Optimized) Unlock precise trading insights with Trend WTS , a powerful and modular trend and signal indicator designed specifically for XAUUSD on the M5 timeframe. Built for traders seeking accuracy and clarity, Trend WTS combines fast moving average crossovers with a long-term EMA filter to deliver reliable buy and sell signals tailored for the gold market. Key Features: Dual Moving Average Trend Detection: Detect strong trend
FREE
Special offer : ALL TOOLS , just $35 each! New tools will be $30 for the first week or the first 3 purchases ! Trading Tools Channel on MQL5 : Join my MQL5 channel to update the latest news from me 概要
OA SnR Powerは、サポートおよびレジスタンスレベルの強度を識別して評価するために設計された強力なツールです。取引量、反発頻度、再テスト回数などの重要な要素を組み込むことで、このインジケーターは市場の重要な価格ゾーンを包括的に可視化します。 その他の製品を見る: すべての 製品 OA SnR Powerの仕組み 高値と安値の特定 このインジケーターは、ローカル高値と安値を計算するための高度なアルゴリズムを使用します。 ユーザーはゾーン幅の設定を調整でき、サポートおよびレジスタンスの潜在的なレベルを正確に検出します。 主要レベルのフィルタリングと統合
FREE
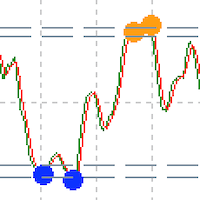
Custom Relative Strength Indicator with multiple timeframe selection About RSI The relative strength index is a technical indicator used in the analysis of financial markets. It is intended to chart the current and historical strength or weakness of a stock or market based on the closing prices of a recent trading period. Features
Indicator gives alert when reached oversold or overbought levels Gives dot indication while reaching levels. Can set indicator bar alert intervals for alerts Can choos
FREE
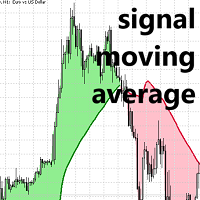
MT5向けシグナル移動平均 Lux Algo
移動平均クロスオーバーシステムにおけるシグナルラインの使用に特化した、独自の移動平均インジケーターをご紹介します。この高度なツールは、レンジ相場では価格から乖離し、トレンド相場では標準移動平均線を忠実に反映することで、他のツールとは一線を画しています。この特性により、トレーダーは市場の変動による不要なノイズや過剰な取引を回避できます。
移動平均線は、レンジ相場では価格から乖離し、トレンド相場では通常の移動平均線の値に達します。
移動平均クロスオーバー戦略では、多くの場合「シグナル」ラインが用いられます。シグナルラインとは、全体的なトレンドを判断するために使用される低速移動平均線です。このシグナルラインは、高速移動平均線と組み合わせることで、通常価格とシグナルラインのクロスによって生じる可能性のある急激な変動を抑制します。
提案されたインジケーターは、より多くのレンジ相場で価格から乖離することで価格のクロスを回避し、価格とシグナルラインのクロス数を効果的に削減します。
価格とシグナルラインの間の領域の色は、シグナルラインに対する価
FREE
SR PrevPeriods MT4 概要
SR PrevPeriods は、MetaTrader 4 のチャート上に前日、高値・安値、前週、高値・安値、前月、高値・安値をリアルタイムで表示するインジケーターです。軽量設計で、価格の反応ゾーン、ブレイクアウト、リバランスゾーンと重なることが多い、過去のサポート・レジスタンス領域を強調表示します。 機能
主要な過去レベルに水平線を描画し、必要に応じて正確な価格を表示するテキストラベルも追加します。新しいティックごとに自動更新され、内部のオブジェクト管理機能によってチャートが常に整然と保たれます。 有用性
前日、前週、前月の価格レベルは、多くの裁量トレーダーやシステムトレーダーにとって重要な指標です。これらのレベルを把握することで、相場状況の認識が高まり、押し目買いや戻り売りの精度が向上し、ブレイクアウトの確認にも役立ちます。過剰取引を減らし、あらゆる時間足で客観的なコンテキストを提供します。 主な特徴
日足・週足・月足レベルの個別表示切替
各レベルの価格を表示するオプションラベル
タイムフレームごとのカラー、ラインスタイル、太さを
FREE
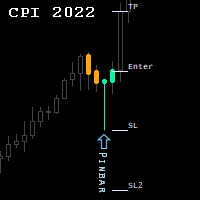
Candlestick Patterns Indicator.
NEW! FREE Candlestick Patterns Expert Advisor > https://www.mql5.com/en/market/product/105634?source=Site +Profile
The Indicator draws colored candlestick patterns, their description and future levels of Stop Loss / Take Profit. Combined with other market analysis, can greatly improve trading results. Indicator can be highly customized by the user including change of colors, fonts, levels, candle sizes etc...
developed, tested and optimized on " VantageMark
FREE
MT4 バージョン: https://www.mql5.com/ja/market/product/157679 MT5 バージョン: https://www.mql5.com/ja/market/product/157680
サポート・レジスタンス — スマートな市場構造レベル
プロのトレーダーと自動システム向けに開発された、シンプルでインテリジェント、かつ信頼性の高いサポート&レジスタンスインジケーターです。
サポート・レジスタンスは、フラクタル、ATRベースの価格セグメンテーション、マルチタイムフレーム分析を組み合わせた高度なクラスタリングアルゴリズムを用いて、真の市場レベルを検出するように設計されています。
このインジケーターは、ランダムなラインやノイズの多いラインを描くのではなく、価格が繰り返し反応した統計的に検証されたレベルを生成します。そのため、裁量取引、アルゴリズム取引、リスク管理、ブレイクアウト検証に最適です。
主な機能 高度なサポート・レジスタンス・エンジン ATRスケールのグリッドセグメンテーションを使用 上方フラクタルと下方フラクタルをクラスター化し
FREE

価格波形パターン MT4へようこそ --(ABCD パターン)-- ABCD パターンは、テクニカル分析の世界で強力で広く使用されている取引パターンです。
これは、トレーダーが市場での潜在的な売買機会を特定するために使用する調和的な価格パターンです。
ABCD パターンを使用すると、トレーダーは潜在的な価格変動を予測し、いつ取引を開始および終了するかについて十分な情報に基づいた決定を下すことができます。 EA バージョン : Price Wave EA MT4
MT5バージョン: Price Wave Pattern MT5
特徴 :
ABCDパターンの自動検出。
強気パターンと弱気パターン。
任意のシンボルと任意の時間枠で機能します。 主要なレベルと価格目標。
カスタマイズ可能な設定と繊維レベルの調整。 アラートと通知。 今後さらに多くの機能が追加される予定です。
FREE
Our modernised version of the popular Order Blocks Indicator for MT4 identifies major trend reversal and momentum exhaustion points by providing arrow signals on the chart. As a result, traders can identify bullish and bearish price reversal zones and BUY and SELL accordingly. Moreover, the indicator provides Buy and Sell Arrow signals.
An order block is a market structure that is defined as the last bearish candle before a bullish price move and vice versa. These order blocks act as support a
FREE

It identifies the pivot, support, and resistance price levels of the selected timeframe and then draws lines onto the chart. FEATURES: Option to specify the Timeframe Period in the PivotSR calculation. Option to display the PivotSR of the last candle, of every candle, or of the current candle. Options for displaying labels, line thickness, and line color. PivotSR can be interpreted as reversal levels or past price reactions that can be used as the basis for current price analysis. Some traders b
FREE

enom Trend Pro — マルチタイムフレーム対応トレンド分析ツール Venom Trend Pro は、あらゆる通貨ペアと時間足において明確な方向性の動きを特定するために設計された、トレンドフォローおよびスイングトレード用インジケーターです。FX、ゴールド、仮想通貨、指数などのデイトレードやスイングトレードに適しています。 このインジケーターは、直近の価格構造とモメンタムを分析して、新たなトレンドまたは継続中のトレンドを検出します。トレンドが確認されると、シグナルはローソク足の確定後も再描画されることはありません。 主な特徴: すべての時間足に対応(M1〜MN) 一度確定したシグナルは再描画されない安定性 対応資産:FX、メタル、仮想通貨、指数など トレンドエントリーとエグジットの両方に対応 チャートを見やすくするミニマルな表示 Venom Trend Pro は、ノイズの少ない構造化されたマーケット判断を提供します。
明確な視覚的シグナルを求める、落ち着いたルールベースのトレードスタイルに最適です。
FREE

これは無料でご利用いただける製品です。お客様のニーズに合わせてご利用ください。
また、肯定的なフィードバックをいただければ幸いです。どうもありがとうございます。
高品質のトレーディングロボットとインジケーターをご覧になるにはここをクリックしてください!
Crypto_Forex インジケーター: MT4 用 Heiken Ashi Candles。再描画なし。 - Heiken_Ashi_Candles は、画像にあるように、トレンドライン MA インジケーターとの組み合わせが優れています。 - インジケーター Heiken_Ashi_Candles は、トレンドをより目立たせるための非常に便利な補助インジケーターです。 - ローソク足チャートをより読みやすくし、トレンドを分析しやすくするのに役立ちます。 - 利益のほとんどは、市場がトレンドのときに発生するため、トレンドを正しく予測する必要があります。 - 平均足チャートは、各バーを計算するための式が異なることを除いて、通常のローソク足チャートと同様に構築されています - 平均足は、基本的に動きの平均を取っているため、より滑ら
FREE
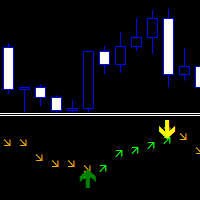
Direction Change Detector - 強気の動きと弱気の動きのバランスを分離するトレンドインジケーター。方向を確認する信号が付いた 2 列の矢印があります。
トレンドを見つけるためのスタンドアロンインジケーターとして、または取引を開始してシグナルの方向に従うための追加ツールとして機能します。
あらゆる市場と時間枠に適応します。 歴史に彼の証言を塗り替えることはない。 通知にはいくつかの種類があります。 上向きの緑の矢印は、価格が強気の方向であることを示します。 下向きのオレンジ色の矢印は、価格が弱気な方向であることを示しています。 読み取り値を変更するためのカスタマイズ可能なパラメータが 1 つあります。方向の数が増えると、価格はよりスムーズになり(低いタイム フレームに使用)、方向の数が減ると、価格はより早くなります(高いタイム フレームに使用)。
Length Directions - 方向の変化を計算するためのローソク足の数。
FREE

このインジケーターは CCIオシレーターと市場構造検出を組み合わせています。CHoCH(キャラクター変化)とBOS(構造ブレイク)分析を使用して、メイントレンド方向のプルバックエントリーを識別します。 仕組み インジケーターはチャート上のスイングハイとスイングローを分析して市場構造(強気または弱気)を判断します。構造ブレイク(高値切り上げ+安値切り上げ)またはキャラクター変化(トレンド反転)が検出されると、バイアスが設定されます。その後、 CCIが売られすぎ/買われすぎゾーンにプルバックするのを待ちます。CCIがゾーンから抜けると、シグナルが生成されます。 買いシグナル条件 • 市場構造が強気(BOSまたはCHoCHを検出) • CCIが-Level以下に低下(売られすぎゾーン) • CCIが-Levelを上抜け 売りシグナル条件 • 市場構造が弱気(BOSまたはCHoCHを検出) • CCIが+Level以上に上昇(買われすぎゾーン) • CCIが+Levelを下抜け 無料版の機能 • 構造検出——スイングポイントからの自動CHoCHおよびBOSバイアス • BUY/SELL矢印—
FREE

About: Someone recently shared a pinescript with me. And asked me to convert it to MT4. I found the FVG blocks very effective as SR areas. So here it is. Enjoy!!
What are Fair Value Gaps (FVG)? Fair Value Gaps occur when price moves so quickly that it creates an imbalance between buyers and sellers. These gaps represent areas where price "skipped" levels, creating potential zones for price to return and "fill the gap". Think of it as unfinished business in the market that often gets revisited.
FREE

短い説明 G3D Full Confluence は、**スマートマネーコンセプト(SMC)**と高度なテクニカル分析を融合させたエリート向けインジケーターです。強力なマルチタイムフレームの根拠に基づき、 オーダーブロック(OB) 、 フェアバリューギャップ(FVG) 、 RSIダイバージェンス を精密に特定します。 インジケーターの概要 プロフェッショナルな精度とチャートの明瞭さを求めるトレーダーのために設計された G3D Full Confluence は、相場のノイズを徹底的に排除します。機関投資家のロジックとボリュームの裏付けを組み合わせることで、複数の根拠が一致した高精度なシグナルのみを配信します。 主な機能: オーダーブロック(OB)の自動検知 : 大きな価格変動の起点となる機関投資家の供給・需要ゾーンを特定します。 フェアバリューギャップ(FVG)の識別 : 価格の不均衡(リクイディティゾーン)を検出し、市場が回帰しやすいターゲットを可視化します。 スマートRSIダイバージェンス : 価格とモメンタムの乖離から、トレンドの終焉や反転の兆しをいち早く捉えます。 マルチタイム
FREE
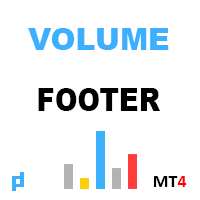
インジケータは、垂直方向の音量を示しています。 設定では、高と極を決定するための2つの係数、および低ボリュームを決定するための1があります。 同様のアルゴリズムが指標 UDP1 Volume Pixel でも使用されます。 指定されたボリュームが検出されると、ヒストグラムは適切な色で着色されます。 ヒストグラムの幅は、スケールに応じて自動的に選択されます。 原則として、価格は最大量と最小量に反応します。 しかし、確認信号を使用する必要があります。
入力パラメータ 。
基本設定 。 Bars Count - インジケータが表示されるキャンドルの数 。 Calc Bars - ボリューム偏差を決定するためのキャンドルの平均数 。 Low Volume Factor - 我々は、低ボリュームを定義する以下の係数 。 High Volume Factor - 我々は大きなボリュームを定義する上の係数 。 Extreme Volume Factor - 我々は極端なボリュームを定義する上の係数 。
視覚的な設定 。 Histo Color - キャンドルのボリュームと方向に応じてヒストグ
FREE

Description Helps you detect the structure of the market, using different types of Smart Money concepts. This should help you to upgrade your trading strategy in every way. MT5 Version Here Smart Money Features: Color candle to signal the type of structure Shows CHOCH and BOS Equal Lows and Highs Order Blocks Internal and Swings Weak and strongs high and lows Fair Value Gaps High and Lows in daily weekly and monthly timeframes Premium and discount Zones KEY LINKS: How to Install – Frequent
FREE
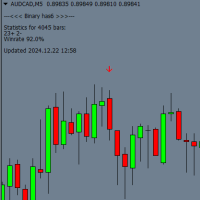
Binary has 6 は、MT4でバイナリーオプション取引を行うためのインジケーターで、どの時間枠や通貨ペアでも動作します。また、FX取引にも使用可能です。 主な特徴: 有効期限: デフォルトでは1本のローソク足に設定されていますが、設定で1~3本の期間に調整可能です。 トレンドベースの取引: インジケーターは現在のトレンドに基づいてシグナルを生成します。 シグナル: 現在のローソク足がクローズする前に、チャート上に矢印(赤または青)が表示され、エントリーのシグナルとなります。このシグナルはバッファーを介して利用でき、外部EAと連携して自動取引が可能です。 柔軟性: さまざまな市場状況や戦略に適しています。 インストール: 正常に動作させるには、 MQL5 フォルダーをターミナルのディレクトリに追加する必要があります。 こちら のリンク からフォルダーをダウンロードできます。インストール手順の詳細は こちら のビデオ をご覧ください。 補足: シグナルが表示された際にポップアップ通知を受け取るには、追加インジケーターを こちら からインストールしてください。
FREE
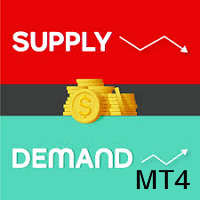
このインジケーターは、チャート上に需要と供給のゾーンを描画します。独自のルールやテクニックと組み合わせることで、このインジケーターを使用して独自の強力なシステムを作成 (または強化) できます。さらに多くの機能を提供する 有料版 もぜひご確認ください。私の推奨は、少なくとも 25 バー後に最初のゾーン テストが発生する取引機会を探すことです。 特徴 ゾーンには 3 つの色があります (入力によって調整可能)。テストされていないゾーンは暗い色、テスト済みのゾーンは中くらいの色 、壊れたゾーンは明るい色です 。 各ゾーンにはゾーン外枠の価格とゾーンテストの金額が記載されています。 入力パラメータ 最初の極値を検索するための最大バックバー数 - デフォルトは 3000 です。最初の極値を xx バー分遡って検索します。値が大きいほど、より多くのシステム リソースが必要になります 。遅いコンピューターの場合は、500 ~ 1000 の値が適している場合があります。 ゾーンテスト間のキャンドルの最小数 未テストの需要色 テスト済みの需要色 壊れた需要の色 未テスト供給色 テスト済みの供給
FREE
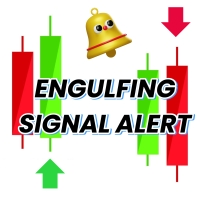
Engulfing Candle Signal Alert: Elevate Your Trading Strategy Unlock the full potential of your trading with the Engulfing Candle Signal Alert, the ultimate tool for identifying market reversals and enhancing your trading precision. Designed specifically for traders who value accuracy and timely alerts, this powerful indicator detects engulfing candle patterns, a key signal in technical analysis that often indicates a potential shift in market direction. What is an Engulfing Candle? An engu
FREE
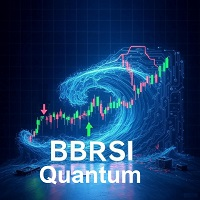
BBRSI Quantum (Free Edition) BBRSI Quantum is a powerful, 100% Non-Repainting indicator for MetaTrader 4 that generates clear Buy and Sell arrows based on an advanced momentum strategy. This tool is designed for traders who want to identify precise entry points during overbought or oversold conditions. This is the fully functional FREE edition. The Core Strategy: Bollinger Bands on RSI Unlike standard indicators, BBRSI Quantum does not apply Bollinger Bands to the price. Instead, it applies th
FREE
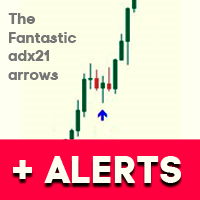
.See screenshots of the indicator. Uses information about the current trend. It is based on the classic ADX indicator. Gives a signal to enter a trade using a non-standard strategy.
Settings: Name Description Period of ADX The period of the classic ADX indicator Distance between +D & -D lines Distance between + D and -D lines . Determines the strength of the trend. Freshness of the signal (bars) Checking the freshness of a buy or sell signal.
Selects the very first signal in the span.
The numbe
FREE

Free automatic Fibonacci is an indicator that automatically plots a Fibonacci retracement based on the number of bars you select on the BarsToScan setting in the indicator. The Fibonacci is automatically updated in real time as new highest and lowest values appears amongst the selected bars. You can select which level values to be displayed in the indicator settings. You can also select the color of the levels thus enabling the trader to be able to attach the indicator several times with differe
FREE
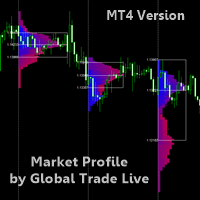
READ THE DESCRIPTION ITS IMPORTANT - ONLY TAKES 2 MINUTES - THIS IS A TOOL NOT A TRADING STRATEGY
Market Profile By Global Trade Live A Market Profile is a graphical representation that combines price and time information in the form of a distribution. A Market Profile is used to determine elapsed time, number of ticks and volumes traded at specific prices, or over a price interval, over a given period. A Market Profile also makes it possible to identify prices accepted or rejected by the mark
FREE
MetaTraderマーケットが取引戦略とテクニカル指標を販売するための最適な場所である理由をご存じですか?宣伝もソフトウェア保護も必要なく、支払いのトラブルもないことです。これらはすべて、MetaTraderマーケットで提供されます。
取引の機会を逃しています。
- 無料取引アプリ
- 8千を超えるシグナルをコピー
- 金融ニュースで金融マーケットを探索
新規登録
ログイン