Participe de nossa página de fãs
Coloque um link para ele, e permita que outras pessoas também o avaliem
Avalie seu funcionamento no terminal MetaTrader 5

- Visualizações:
- 16749
- Avaliação:
- Publicado:
- Atualizado:
-
 Você está perdendo oportunidades de negociação:
- Aplicativos de negociação gratuitos
- 8 000+ sinais para cópia
- Notícias econômicas para análise dos mercados financeiros
Registro LoginVocê concorda com a política do site e com os termos de uso
Se você não tem uma conta, por favor registre-se -
 Precisa de um robô ou indicador baseado nesse código? Solicite-o no Freelance
Ir para Freelance
Precisa de um robô ou indicador baseado nesse código? Solicite-o no Freelance
Ir para Freelance
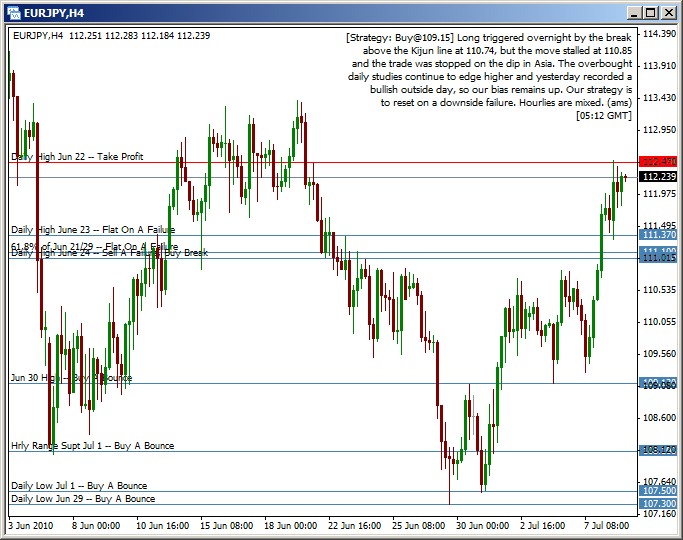
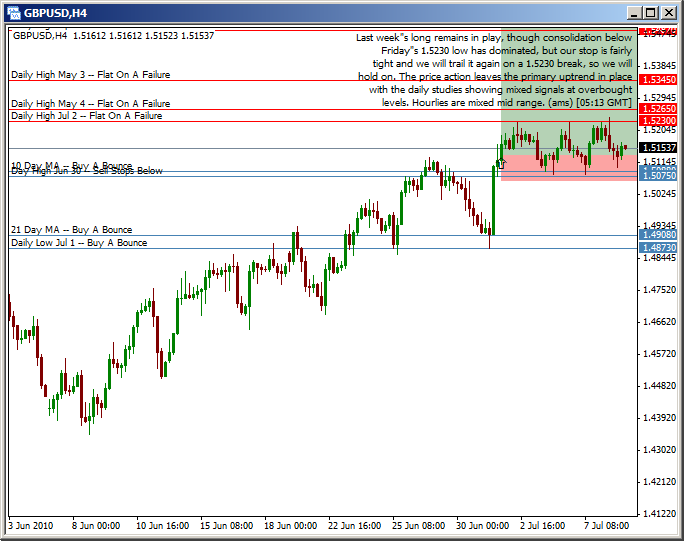
This script plots price levels and open positions from the IFR trading pages provided via the FXNews program offered to accounts registered with OANDA Corporation's FXTrade and FXGame platforms. The IFR trading pages offer a great deal of detail but the strategy and levels are difficult to visualize without actually seeing them on a live chart. This script reads in these trading pages and plots price levels that are of technical significance according to the analysts at IFR Forex Watch. It also plots their latest commentary/strategy on the currency pair in question, as well as any position they currently have open on the pair, along with their profit target and stop loss in the form of colored rectangles.
Operation of this script requires a small amount of effort from the user, as the trading pages need to be manually copied and pasted to file before they can be read in. Follow the below instructions to operate the script.
- Install the script as normal in your MT4 scripts/ folder.
- For each pair you wish to plot, do the following:
- Open the trading page from OANDA's FXNews application.
- Select all (Ctrl+A) and copy (Ctrl+C) the whole page from the window to Notepad, and save to a file in your MT4 experts/files/ folder. The filename MUST be the symbol of the pair you're plotting with .txt at the end. For example, copy the EUR/USD trading page text to a file called experts/files/EURUSD.txt
- Save the file
- Drag the script onto the window you wish to plot.
This is a one-shot script; when you want to update the price levels, you must carry out these steps again. As well, when recent price action is high enough, the text in the top right obscures the candles and would make more sense being plotted in the bottom right corner instead. Thus a couple nice opportunities to further automate and improve this script exist.
 Market-Heart-Beat
The indicator will show how many ticks occurred every minute of an hour and the number of points.
 EA: ytg_Speed_MA_ea
The adviser uses the indicator Moving Average.
psar bug 3
Opens and closes orders using parabolic SAR
USD Strength Effect Indicator
This indicator uses the position and direction of 7 pairs to gauge the overall effect that (by default) the USD currency may have on the pair that you are trading. Base currency can be changed.