 MetaTrader 5
 Experts
 Indicadores
 Scripts
 Bibliotecas
 Repositório
Participe de nossa página de fãs
Coloque um link para ele, e permita que outras pessoas também o avaliem
Avalie seu funcionamento no terminal MetaTrader 5
- Publicado por:
-
Joao Prata Silva Yglesias
 Trader e desenvolvedor de robôs com foco em automação e gestão de risco para o mercado Forex. Crio Expert Advisors que priorizam proteção de capital e sobrevivência, em vez de promessas — estratégias reais, resultados transparentes e monitoramento ao vivo.
 - Visualizações:
- 158
- Publicado:
- Atualizado:
-
 Você está perdendo oportunidades de negociação:
- Aplicativos de negociação gratuitos
- 8 000+ sinais para cópia
- Notícias econômicas para análise dos mercados financeiros
Registro LoginVocê concorda com a política do site e com os termos de uso
Se você não tem uma conta, por favor registre-se -
 Precisa de um robô ou indicador baseado nesse código? Solicite-o no Freelance
Ir para Freelance
Precisa de um robô ou indicador baseado nesse código? Solicite-o no Freelance
Ir para Freelance
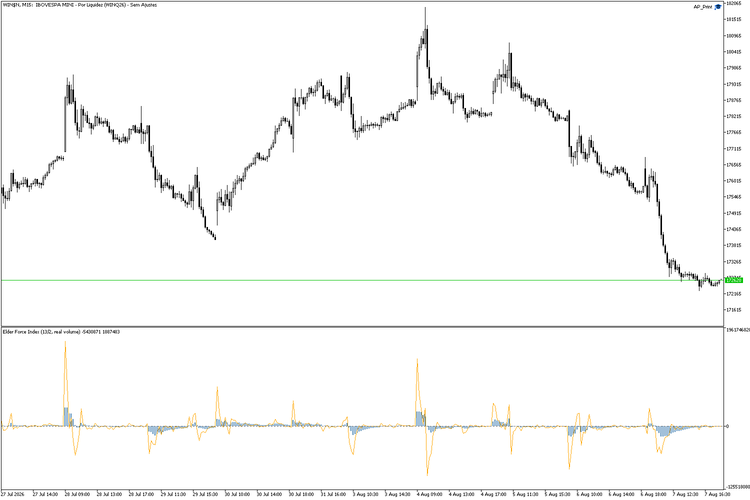
O nome da subjanela indica qual fonte de volume foi usada - neste caso, o volume real de um instrumento negociado em bolsa.
O QUE É ISTO?
O Índice de Força é um dos indicadores que Alexander Elder introduziu em "Trading for a Living" e continuou a usar em livros posteriores. Ele relaciona o movimento do preço ao volume por trás dele, partindo da ideia de que um movimento acompanhado por um volume elevado significa algo diferente do mesmo movimento com um volume baixo.
Esta implementação segue a definição conforme descrita nos livros. Isso pode parecer uma afirmação pequena, mas não é: as implementações do Índice de Força em uso apresentam divergências entre si, e essas divergências não são meramente superficiais.
A DEFINIÇÃO
Do livro "The New Trading for a Living" :
Índice de Força = Volume x (Fechamento de hoje - Fechamento de ontem)
A série resultante é então suavizada por uma média móvel. Elder utiliza dois períodos, ambos descritos em seu texto: uma EMA de 2 períodos para entradas de curto prazo e uma EMA de 13 períodos para a tendência subjacente e para divergências.
A ORDEM DAS OPERAÇÕES É O PONTO
Este indicador calcula:
MA[ Volume(i) x (Fechamento(i) - Fechamento(i-1)) ]
A força bruta é calculada barra por barra primeiro, e a média é aplicada a essa série.
Existe uma construção diferente que parece similar, mas não é a mesma coisa: primeiro suavizar o preço e depois multiplicar a diferença suavizada pelo volume. Por extenso:
Elder MA[ Volume(i) x (Fechar(i) - Fechar(i-1)) ] o outro Volume(i) x ( MA(i) - MA(i-1) )
Essas são séries diferentes e não convergem. A primeira mede a força de cada barra individual e depois calcula a média dessas forças. A segunda mede a velocidade de deslocamento de uma média móvel e a escala pelo volume do dia — que é uma grandeza diferente, com significado diferente, e reage de forma distinta em relação a picos de volume.
Nenhuma das duas está matematicamente errada. Apenas a primeira corresponde ao que Elder escreveu. Se você comparar este indicador com outra implementação e os valores forem diferentes, verifique a ordem utilizada pela outra implementação antes de presumir que alguma delas esteja com defeito.
VOLUME: UMA DECISÃO QUE O USUÁRIO DEVE LEVAR EM CONSIDERAÇÃO
Elder escreveu sobre ações, onde o volume é real: cada ação negociada é registrada. Em instrumentos que publicam apenas o volume de ticks — o número de variações de preço — a mesma fórmula mede algo relacionado, mas não idêntico.
Este indicador prioriza o volume real quando o instrumento o reporta e utiliza o volume de ticks quando não o faz. O parâmetro permite forçar qualquer um dos dois. Dois detalhes garantem a segurança da utilização do volume real como alternativa:
- A fonte realmente utilizada está escrita no nome da subjanela, portanto o gráfico sempre indica qual você está visualizando. - Uma única barra com volume real zero não altera toda a série para volume de ticks - barras ilíquidas não geram negociação alguma. A disponibilidade é determinada por uma janela de barras, não por uma única amostra. - Uma barra sem volume real retorna ao seu próprio volume de ticks em vez de usar zero. Usar zero nesse caso apagaria silenciosamente da série um movimento de preço que de fato ocorreu.
COMO UM IDOSO O UTILIZA
Do livro "Come Into My Trading Room" , leitura de curto prazo:
Tendência de alta e EMA de 2 períodos abaixo de zero -> sinal de compra. Tendência de baixa e EMA de 2 períodos acima de zero -> sinal de venda.
A lógica é que, em uma tendência de alta, um breve colapso de força marca o momento em que os vendedores se esgotam - um recuo dentro da tendência, em vez de uma reversão dela.
E a leitura mais longa, da EMA de 13 períodos: divergências entre ela e o preço marcam pontos de inflexão importantes, enquanto novas máximas ou mínimas do Índice de Força indicam que a tendência de força é forte e provavelmente continuará.
O filtro de tendência não faz parte deste indicador propositalmente. Cada uma dessas regras é condicional à direção da tendência, e um oscilador usado sem essa condição está sendo usado contra a sua própria definição. Forneça a tendência a partir de qualquer fonte em que você já confie — o próprio Elder usa o gráfico semanal para isso.
PARÂMETROS
Período lento 13 por padrão, leitura de tendência de Elder. Período rápido 2 por padrão, leitura de entrada de Elder; defina como 0 para ocultá-lo. EMA de suavização por padrão, conforme especificado por Elder. SMA, SMMA e LWMA são oferecidas porque a fórmula permanece inalterada e as pessoas solicitam. Fonte de volume real com fallback para tick, somente tick ou somente real.
NOTAS SOBRE A IMPLEMENTAÇÃO
A série original é armazenada em um buffer de cálculo e o suavizamento é aplicado a ela com a biblioteca padrão MovingAverages, de modo que o indicador recalcula incrementalmente em vez de reconstruir todo o histórico a cada tick.
Ambos os buffers plotados provêm da mesma série bruta - as leituras rápida e lenta são duas médias de um único cálculo, não dois cálculos separados. A linha zero é a referência em relação à qual os sinais acima são definidos.
O QUE NÃO É REIVINDICADO
Este indicador não garante desempenho e não oferece backtesting. Trata-se de uma implementação fiel de uma fórmula publicada, não de um sistema de negociação.
Essa distinção é mais importante do que parece. Recuperar a fórmula corretamente e ter motivos para acreditar que ela gera lucro são duas coisas diferentes, e este arquivo oferece apenas a primeira. Teste-o com seus próprios dados, em seu próprio equipamento e com seus próprios custos antes de confiar nele.
 Envelope SAR
Este indicador é um oscilador de tendência e momentum que acompanha a posição do preço em relação ao seu canal de volatilidade estrutural, utilizando uma relação normalizada entre o SAR Parabólico e os Envelopes.
 T5Copier - MT 5 client to client Local trade copier
Um copiador de negociações ponto a ponto local com painel personalizado em C# e canal de transporte em Go; o código-fonte completo está disponível no arquivo (versão baseada em soquete), com latência ultrabaixa
EA KCI N-Matrix engine
O ápice da grade algorítmica e do impulso cinético. Bem-vindo ao KCI Native Matrix Engine — um gigante algorítmico implacável, orientado matematicamente e desenvolvido nativamente para o MetaTrader 5. Projetado para ambientes de negociação de alta frequência (HFT), este EA elimina as bibliotecas padrão pesadas e opera diretamente no nível de roteamento do servidor.
KCI Directional Matrix
A Matriz Direcional KCI (KCI-DX) é uma ferramenta analítica avançada, inspirada na física, que extrai a cinemática do mercado por meio da medição do comprimento da trajetória dos preços e da energia da volatilidade. Ao contrário das ferramentas convencionais de momentum, o KCI-DX emprega uma normalização dinâmica do Z-Score combinada com uma função de ativação sigmoide. Isso garante que o resultado fique perfeitamente restrito entre 0 e 100, proporcionando uma identificação hiper-responsiva da força da tendência e do viés direcional, sem distorção causada por extremos históricos.