Participe de nossa página de fãs
Coloque um link para ele, e permita que outras pessoas também o avaliem
Avalie seu funcionamento no terminal MetaTrader 5
- Visualizações:
- 37357
- Avaliação:
- Publicado:
-
Precisa de um robô ou indicador baseado nesse código? Solicite-o no Freelance Ir para Freelance
Relative Strength Oscillator or RSO is an Oscillator version of RSI. RSI as a powerful and accurate indicator is very popular. It is an index indicator and varies in the range of 0 to 100. We used to see 70s or 30s on RSI, then decide to open a new position. But as an indicator, symmetry is more readable and more suitable for comparison. Oscillators have a center line of usually 0.0 and swing around center line. RSO intends to do this role. With RSO everything is as the same as before on RSI, just minus 50. Here are 20s and -20s as overbought and oversold positions now.
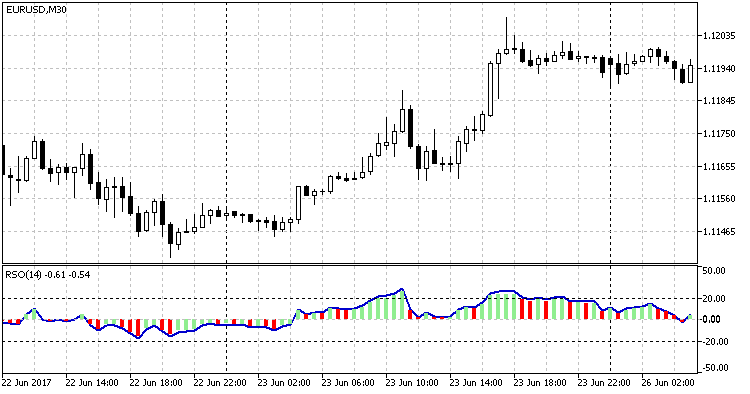
I added colored bars just for more clarity. Green bars show increasing of RSO and red bars show decreasing. RSO or RSI curves cannot show little changes, while colored bars can. For example when RSO is over 20, first red bar reveals direction change. As you can see, RSO with bars is more comprehensible with just a glimpse.

Fig 1. RSO indicator
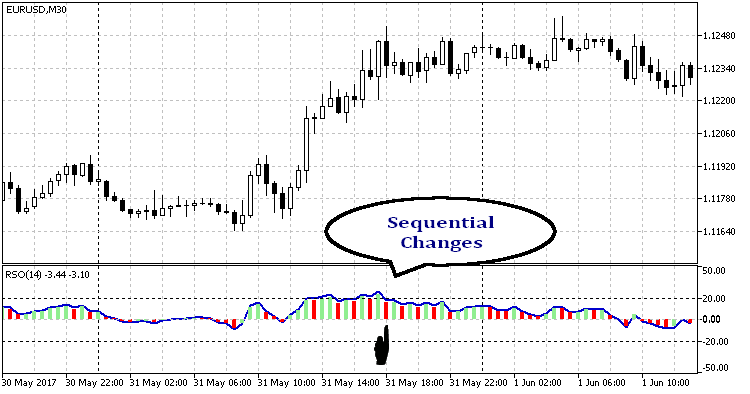
Sequential Green/Red bars indicate that we should wait more for direction change. As showed in following picture, RSO is around 20 and starts to decrease. Without bars warning, we may be convinced to open a short position. However sequential opposite color bars is a good indicator alert to aware us do not do anything.

Fig 2. RSO sequential color change
I used MetaQuotes RSI source code as a base to recode RSO.
 Strategy Checklist
This indicator allows you to define a checklist for you to manually check and confirm your strategy before entering into a trade.
 Tipu EA
A simple EA based on Tipu Trend indicator and Tipu Stops indicator.
 Hidden Stop Loss and Take Profit
Stores and implements a basic hidden Stop Loss and Take Profit system.
 Track/close buys and sells buttons
Open two buttons on a chart, one for closing all shorts, one for closing all longs. The buttons labels display the current total profit for each type of order.