Participe de nossa página de fãs
Coloque um link para ele, e permita que outras pessoas também o avaliem
Avalie seu funcionamento no terminal MetaTrader 5
- Visualizações:
- 69245
- Avaliação:
- Publicado:
-
 Você está perdendo oportunidades de negociação:
- Aplicativos de negociação gratuitos
- 8 000+ sinais para cópia
- Notícias econômicas para análise dos mercados financeiros
Registro LoginVocê concorda com a política do site e com os termos de uso
Se você não tem uma conta, por favor registre-se -
 Precisa de um robô ou indicador baseado nesse código? Solicite-o no Freelance
Ir para Freelance
Precisa de um robô ou indicador baseado nesse código? Solicite-o no Freelance
Ir para Freelance
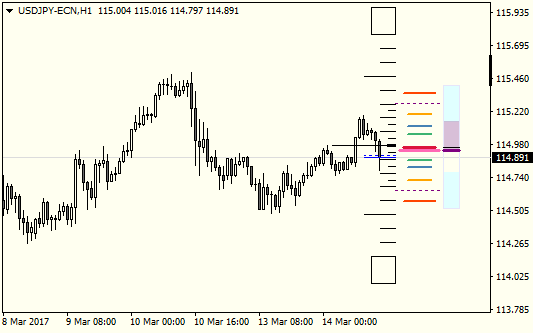
Experimental indicator I wrote for myself. It's made to show some reference (it's more like a rifle scope, than a rifle). Main components are pip scale, ATR/pivot, MA level, RSI, and spread alert. Can be used on any timeframe, but since it's made for scalping it is somewhat adjusted for M1-M15.
Pips Scale
Settings: Scale Zero Level Shift.
This is simple scale. Middle (zero level) is placed at the middle of the body of chosen candle. This can be adjusted so that you can differentiate reversal from pullbacks.
Rule of thumb is: Trend is up when price is above Zero Level, trend is down when price is below.
ATR/Pivots
Settings: Mode(Standard,Fibonacci), Period (No of M5 Bars), Lines - Style, Color, Width.
There's some math behind this one. Weighted average of chosen number of M5 bars (for open/close/high/low price)
 for(int i=1;i<N_Bars;i++)
     {
      mod=(double)(N_Bars-i);
      mod*=(double)(iVolume(NULL,inpTimeFrame,PivotBar+i));
      xOpen+=mod*iOpen(NULL,inpTimeFrame,PivotBar+i);
      xClose+=mod*iClose(NULL,inpTimeFrame,PivotBar+i);
      xHigh+=mod*iHigh(NULL,inpTimeFrame,PivotBar+i);
      xLow+=mod*iLow(NULL,inpTimeFrame,PivotBar+i);
      div+=mod;
     }
Range is adjusted with ATR from this range,
   double xATR=iHigh(NULL,ATRTimeFrame,iHighest(NULL,ATRTimeFrame,MODE_HIGH,5*N_Bars,0))
               -iLow(NULL,ATRTimeFrame,iLowest(NULL,ATRTimeFrame,MODE_LOW,5*N_Bars,0));
   double xRange=(xHigh-xLow)+xATR;
and all these are used to calculate pivot levels.
Because of that these levels will be dynamic, depending on ATR value, so chosen Period makes big difference here. The lower number the more dynamic levels (they will expand and contract). For intraday trading/scalping Period 12 - 288 is reasonable (1-24 hours).
Rule of thumb just like other pivot tools.
MA Level
Settings: Period, Method, Applied price, Timeframe, Line Color/Style/Width.
This is additional line that shows latest price of Moving Average from a chosen time-frame. If the level is "outside" the chart the line is drawn at the top/bottom of the chart (longer and thicker). I use EMA(16) of typical price on H1, that shows the trend pretty well.
Rule of thumb: trend is up then price is above the MA level, trend is down when price is below.
RSI indicator
Settings: Period
This one may seem confusing at first. (it's more like looking at RSI from the side, like a plan view). Line shows current RSI, color fill shows plan view of last n bars (min/max value) (n is the same as RSI period).
Rule of thumb: RSI > 50 trend is up, RSI < 50 trend is down. Also when trending sideways the color fill is tight around 50.
Spread Alert
Settings: Ratio, Color.
Set the ratio of spread and ATR to trigger alert. When it's triggered it changes color of Bid/Ask line, and some scale lines to draw your attention. Enable debug mode to show some internal numbers, also spread, ATR and %ratio to help you adjust this level.

 Messages Helpers
Various helper functions for sending messages of different types to different sources.
 Zig Zag & Fibonacci
One of the best indicators about with a slight tweak to make it less noisy. Shows ZigZag lines to help spot cycles and draws Fibonacci lines to indicate support and resistance levels.
Detrended Synthetic Price (histo)
Detrended Synthetic Price (histogram form)
Detrended Synthetic Price (bars)
Detrended Synthetic Price (bars form).