 MetaTrader 5
 Experts
 Indicadores
 Scripts
 Bibliotecas
 Repositório
Assista a como baixar robôs de negociação gratuitos
Encontre-nos em Twitter!
Participe de nossa página de fãs
Participe de nossa página de fãs
Script interessante?
Coloque um link para ele, e permita que outras pessoas também o avaliem
Coloque um link para ele, e permita que outras pessoas também o avaliem
Você gostou do script?
Avalie seu funcionamento no terminal MetaTrader 5
Avalie seu funcionamento no terminal MetaTrader 5
- Publicado por:
- Visualizações:
- 33363
- Avaliação:
- Publicado:
- Atualizado:
-
 Você está perdendo oportunidades de negociação:
- Aplicativos de negociação gratuitos
- 8 000+ sinais para cópia
- Notícias econômicas para análise dos mercados financeiros
Registro LoginVocê concorda com a política do site e com os termos de uso
Se você não tem uma conta, por favor registre-se -
 Precisa de um robô ou indicador baseado nesse código? Solicite-o no Freelance
Ir para Freelance

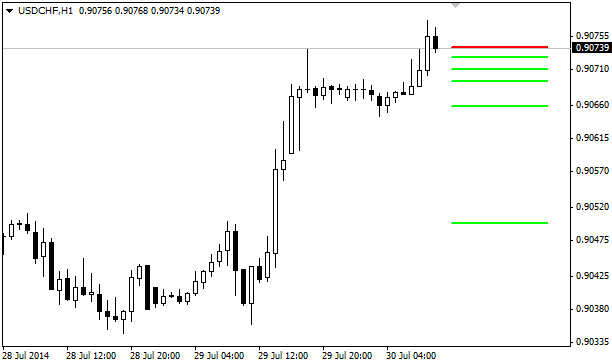
This indicator helps to find possible support/resistance areas after a trend has developed (normally first pullback ends at EMA's region).
It shows the value for EMA 20 from M1 to MN1 timeframes.
 Oscillators on Chart
A few oscillators (RSI, CCI & PercentRange) drawn in the chart window.
Moving Avreage
Once the price closes above or below the two moving (60 &100) a signal is generated. Signal must be generated ONLY in-case the price closes above/below the TWO lines.
MACD Momentum
MACD Momentum indicator (The Red line is the Momentum 10 of the histogram MACD, smoothed 3).
 СloseAll
A collection of scripts for closing various types of orders.