Participe de nossa página de fãs
Coloque um link para ele, e permita que outras pessoas também o avaliem
Avalie seu funcionamento no terminal MetaTrader 5

Kijun Sen Candles Two Colors - indicador para MetaTrader 4

- Visualizações:
- 54094
- Avaliação:
- Publicado:
- Atualizado:
-
 Você está perdendo oportunidades de negociação:
- Aplicativos de negociação gratuitos
- 8 000+ sinais para cópia
- Notícias econômicas para análise dos mercados financeiros
Registro LoginVocê concorda com a política do site e com os termos de uso
Se você não tem uma conta, por favor registre-se -
 Precisa de um robô ou indicador baseado nesse código? Solicite-o no Freelance
Ir para Freelance
Precisa de um robô ou indicador baseado nesse código? Solicite-o no Freelance
Ir para Freelance
Kijun Sen Candles Two Colors: Also available for MT5 This Indicator draws different colored candles above and below a Kijun Sen (KS) line. The user is required to ensure that the Kijun Sen period on both the present Indicator and the user provided Kijun Sen match each other exactly. This indicator has been updated to automatically change the the chart to a Line Chart and set the Line Chart to color None before drawing the the Kijun Sen Candles. Steps 1 to 7 are therefore no longer necessary.
Kijun Sen Indicator: Predefined Kijun Sen Indicators of periods 21, 34, 50 and 100 are included in a zip file above.
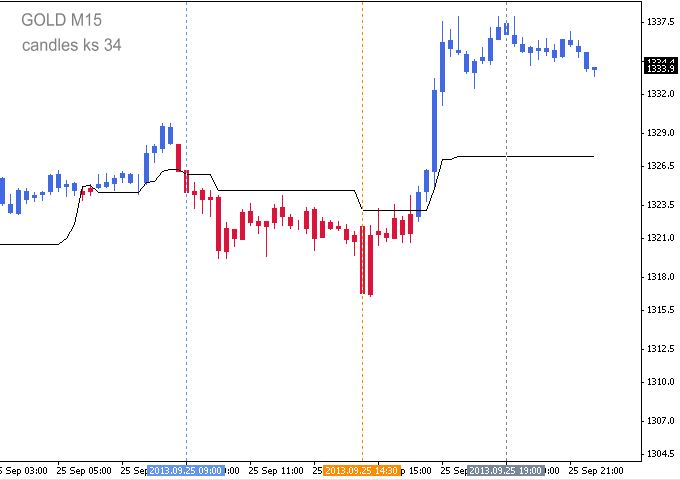
Image: 25-Sept-2013 First vertical Line - London Open 08:00 (03:00 ET). Second vertical line - London 13:30 (08:30 ET - US News Release). Session Open V-Line
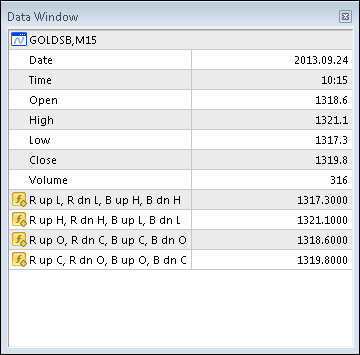
Candle Accuracy: Although the standard chart price graphic is hidden it is not
disabled and Open, High, Low and Close prices are available in MT4 Data Window
(press Ctrl+D or View → Data Window). Accuracy of the Indicators Open, High, Low
and Close can be checked against Open, High, Low and Close in MT4 Data
Window. When cross-referencing the cursor point must be on the relevant colored candle: Interpretation of the the Data Windows:
The indicator candle H, L, O and C are listed in Columns R up, R dn, B up and B dn (Red up candle, Red down, Blue uo candle, Blue down candle). The hidden candle open is less than the close so the candle is a up candle. The indicator Red up candle in column 1 corresponds to the hidden up candle.
 All Inputs parameters and options can be changed and will save automatically. If after changing Inputs or Color parameters a Reset is used the Color Candles will display as Bars. To revert to Color Candles switch to a different timeframe and then back. Input and Parameters
| |
0 comments |
 Color Fill - Tenkan + Kijun
Draws Tenkan and Kijun with Color Fill between 1. Price and Tenkan, 2. Price and Kijun, 3. Tenkan and Kijun and 4. No Fill.
Color Fill MA
The indicator draws 2 Moving Averges with different color filling.
MA Candles Two Colors
Draws different color candles above and below MA lines. Supported MA methods: SMA, EMA, SMMA, WMA & TMA.
 NewsTradingEA
EA for Trading on News event, will set BUY and SELL Stop (pending order) then will delete one pending order after open BUY/SELL occur (OCO) on specifed date and time.