 MetaTrader 5
 Experts
 Indicadores
 Scripts
 Bibliotecas
 Repositório
Assista a como baixar robôs de negociação gratuitos
Encontre-nos em Twitter!
Participe de nossa página de fãs
Participe de nossa página de fãs
Script interessante?
Coloque um link para ele, e permita que outras pessoas também o avaliem
Coloque um link para ele, e permita que outras pessoas também o avaliem
Você gostou do script?
Avalie seu funcionamento no terminal MetaTrader 5
Avalie seu funcionamento no terminal MetaTrader 5

- Visualizações:
- 40764
- Avaliação:
- Publicado:
- Atualizado:
-
 Você está perdendo oportunidades de negociação:
- Aplicativos de negociação gratuitos
- 8 000+ sinais para cópia
- Notícias econômicas para análise dos mercados financeiros
Registro LoginVocê concorda com a política do site e com os termos de uso
Se você não tem uma conta, por favor registre-se -
 Precisa de um robô ou indicador baseado nesse código? Solicite-o no Freelance
Ir para Freelance
Description:
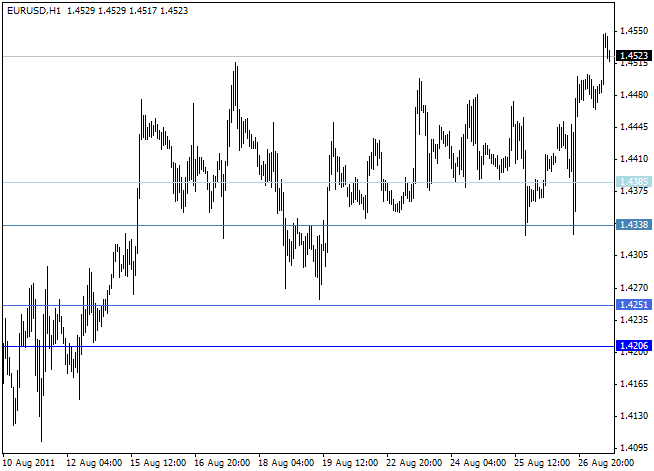
Basic code for fast and handy Fibos and DiNapoli objectives (OP, COP, XOP) ploting on chart.
Every Blue line is indicating averaged Fibo levels calculated from: .328, .500, .618 for corrisponding fractals specified by user.(lighter color is meaning nearest fractals (H/H, L/L).
Fibo nodes averaged to eliminate to many lines ploted on chart.
Red, Violet, Pink, Brown lines are indicating DiNapoli targets. (lighter lines for COP's, darker for XOP's)
Happy trading.
- extern int FracsFromBar = 6; // this is number of bar from which indi calculates back fractals specified below,"0" means current bar.
- extern int FibFractals01 = 12; // first and nearest to bar specified before range for fractals (H/H,L/L for spec. nr of bars)
- extern int FibFractals02 = 22; // second range for fractals (H/H,L/L for spec. nr of bars)
- extern int FibFractals03 = 32; // third range
- extern int FibFractals04 = 45; // fourth, wider range
- extern bool CommentsOn = false; // short description on chart, leave it "false" if to chart is attached another indi with comments.
Image:
 RideAlligator
Simple EA based on Alligator indicator.
 GRUCHA Percentage Index
 LOCLinePipsAgile a Script to display distance in pips from horizontal lines to current market price
This script is useful when you drop lines on chart and want to see the distance to current market price. You can drag line and see the distance in pips.
204060 program
Three grades take profit Grid System, use it on weak market and fluctuating market, may need close all positions at some time.