How to check if an indicator repaints - a simple test with the standard Fractals
17 outubro 2026, 11:05

0
1
Many indicators look amazing on history: arrows exactly at tops and bottoms, 80%+ win rate. Often the reason is simple: the signal was drawn AFTER the price moved (repainting).
A simple way to check it:
1. Record every signal at the moment the bar closes (what you could really see live).
2. Some bars later, compare with what the indicator shows on history.
3. Count signals that VANISHED and signals that APPEARED LATE.
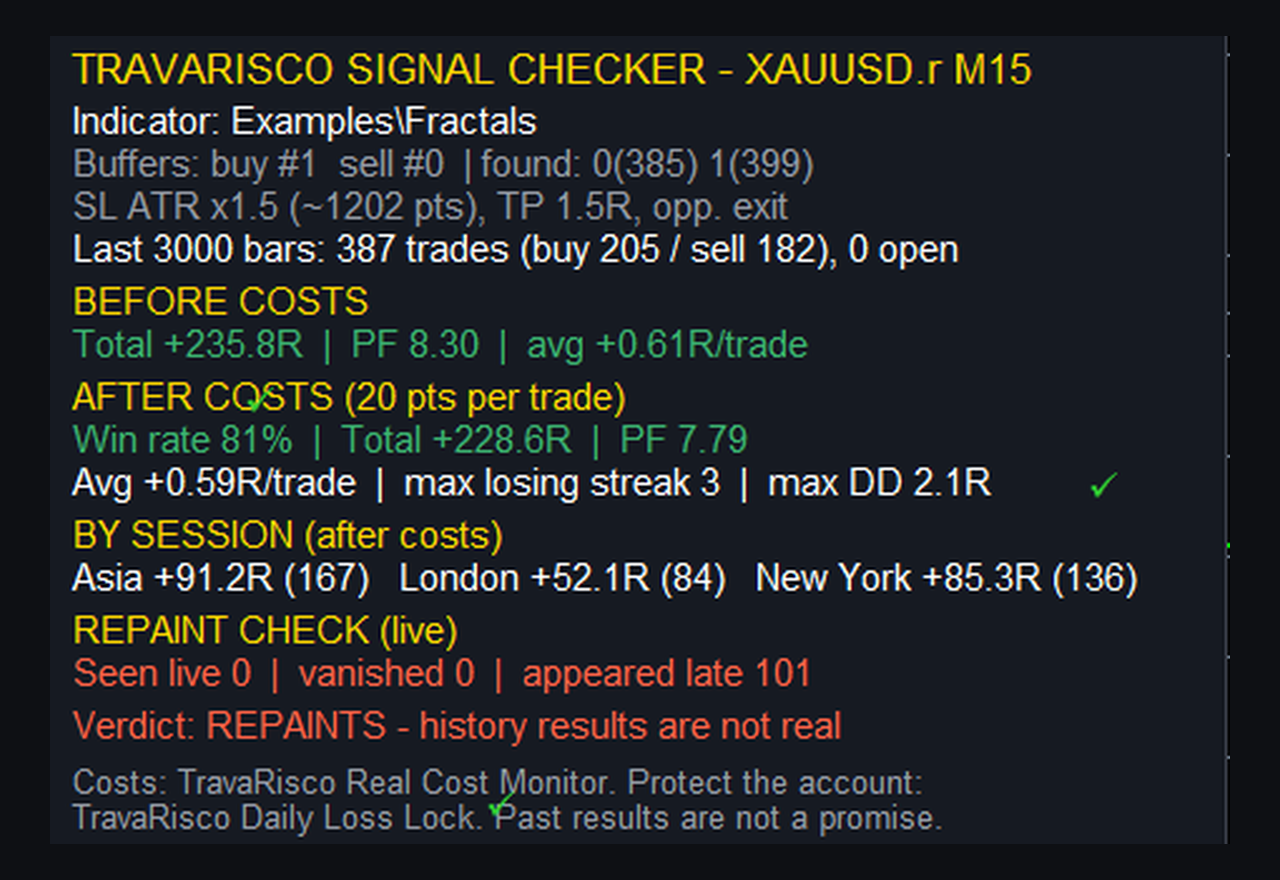
I tested the standard Fractals on XAUUSD M15 (Strategy Tester, visual mode, 2 weeks):
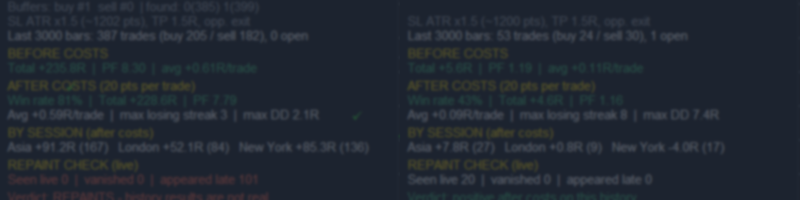
- On history: 387 trades, 81% win rate, profit factor 7.8 after costs.
- Live check: 0 signals seen at bar close, 101 signals appeared late.
Fractals need 2 more bars to confirm, so every arrow is drawn 2 bars after the top/bottom. The history result is impossible to trade.
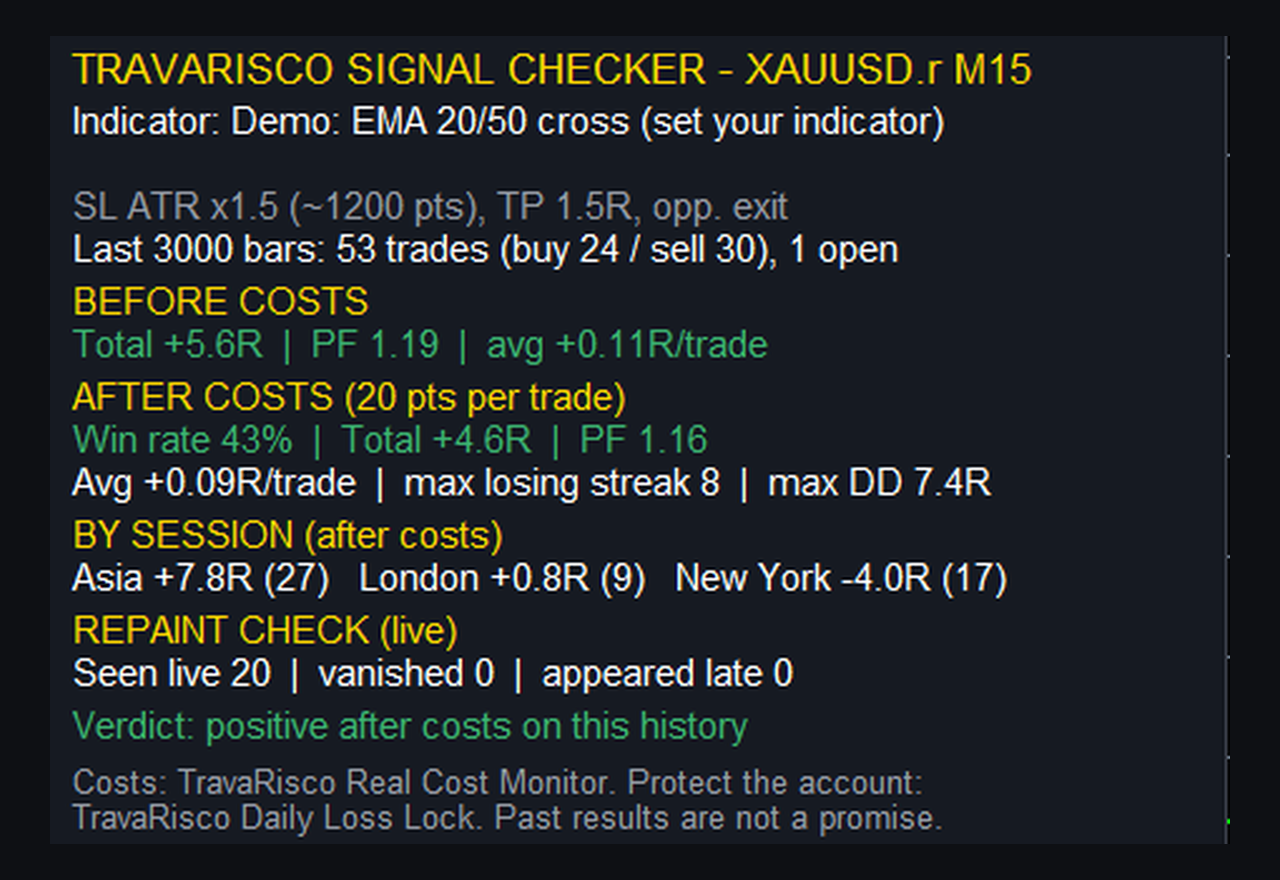
For comparison, a simple EMA 20/50 cross: 53 trades, 43% win rate, PF 1.16 after costs, 0 late signals. Not exciting, but real.
Rule of thumb: if a backtest looks too good, check the signals live before trusting it. And always count costs (spread, commission, slippage) - many "winning" systems lose after costs.
What methods do you use to detect repainting?
I made a free MT5 tool that does this check automatically (with costs and results by session):
Video: https://youtu.be/YOFQ4NDv0Zk
Free download: https://www.mql5.com/en/market/product/201906
Arquivos anexados:
SC_02_repaints.png
687 kb
SC_03_honest.png
649 kb