Key level breaker block MT5
- 지표
- 버전: 1.0
- 활성화: 5

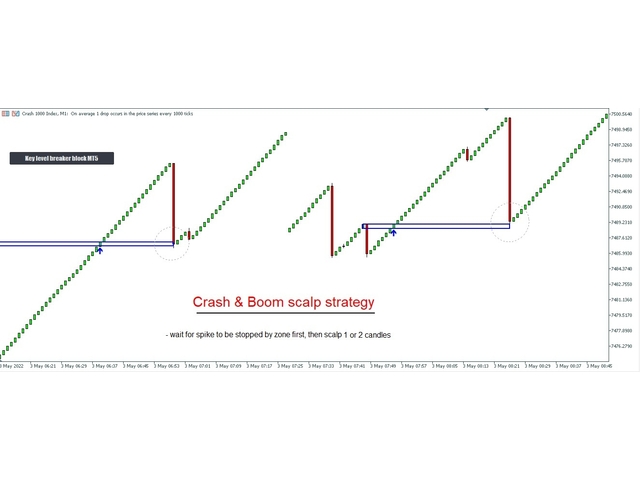
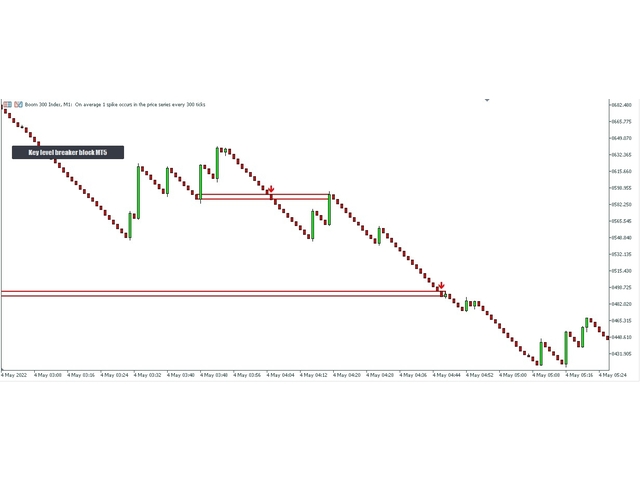
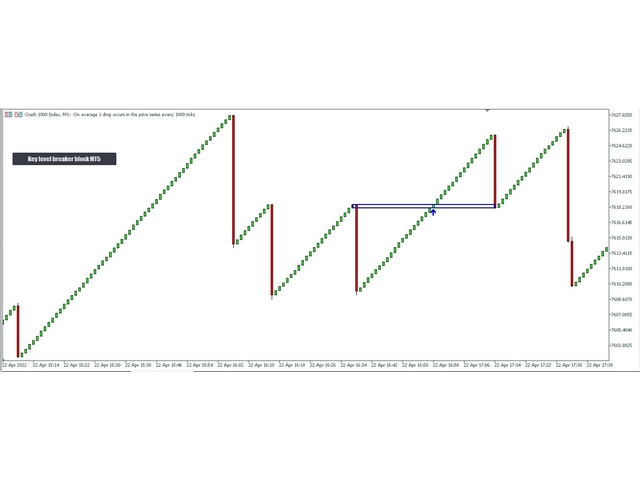
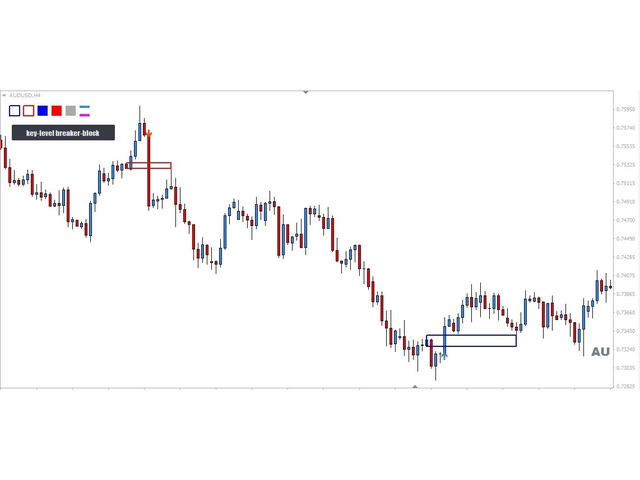
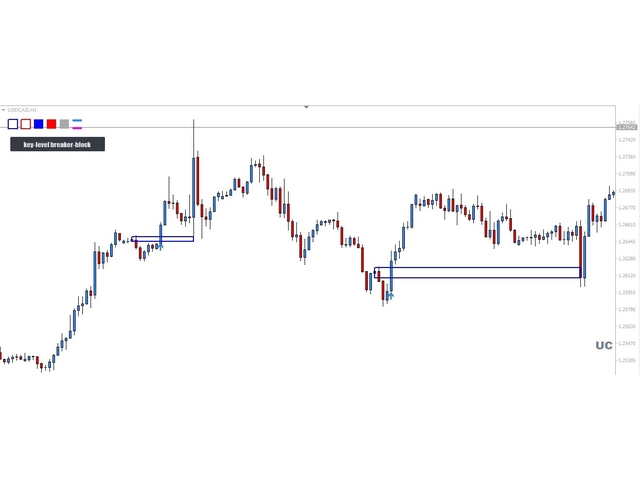
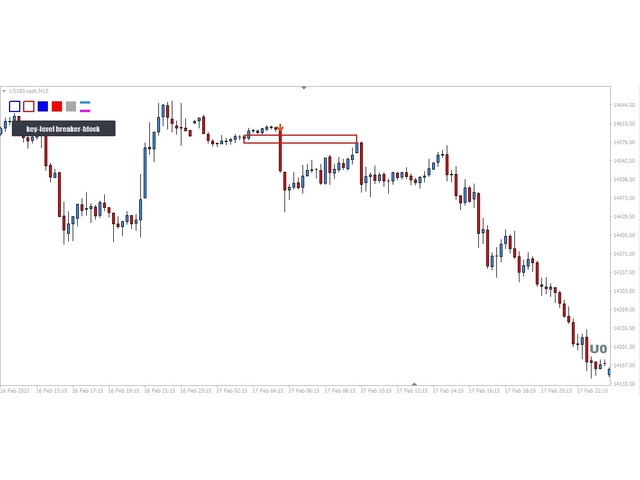
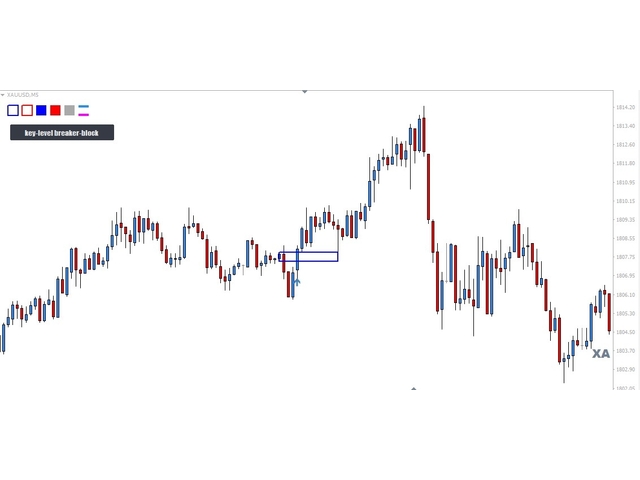
The key level breaker block indicator automatically draws breaker blocks for you on the chart. Breaker blocks are, in short, failed order blocks, but create strong support and resistance zones when price comes back to re-test them.
Advantages
- The key level breaker block DOES NOT RE-PAINT, giving you confidence when a signal appears and also helps when looking back.
- The key level breaker block includes an on/off button on the chart to easily keep the charts clean after analysis by just one click.
- The key level breaker block works on all markets from stocks, indices to currency pairs aswell as crypto-currency.
- Automatically draws arrow to show impulsive move.
- Since the indicator automatically draws the breaker blocks for you, it gives a more mechanical approach to your analysis removing the emotion and subjectivity involved when personally drawing them.
- It works well with Volatility indices aswell from Deriv Broker including Boom, Crash, Volatity 75, Step index etc...
Recommendation
Please first watch the instructional video below to learn how to pick the best breaker block zones.
사용자가 평가에 대한 코멘트를 남기지 않았습니다