Key level supply and demand
- 지표
- 버전: 1.1
- 업데이트됨: 26 10월 2022
- 활성화: 10

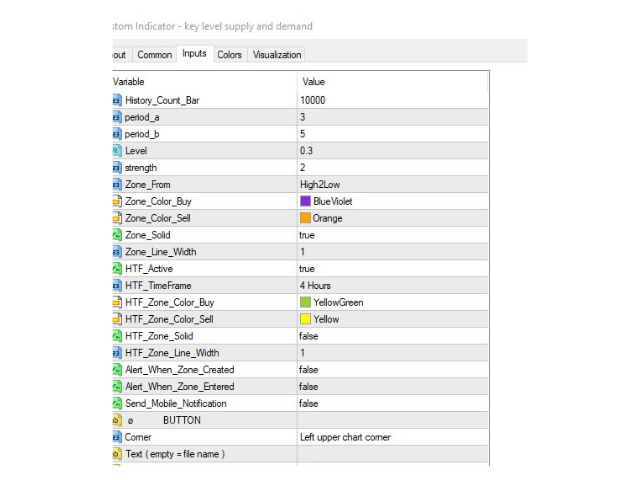
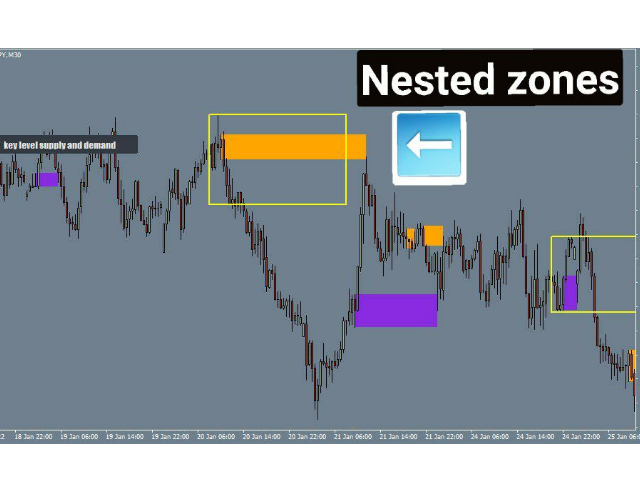
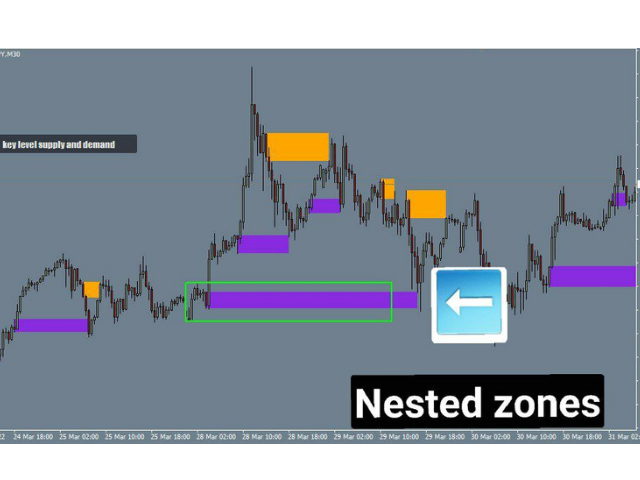
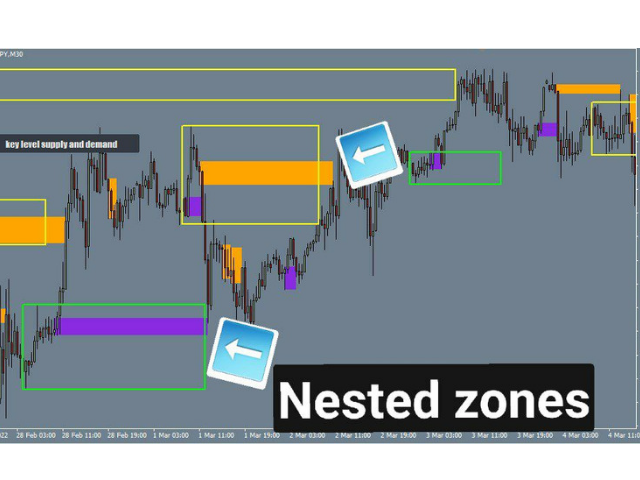
The key level supply and demand indicator is the first supply and demand indicator with options to change settings to show different zones, giving you the choice to pick the zones you see are being respected the most and saving the settings.
Advantages
- The key level supply and demand DOES NOT REPAINT unlike other supply and demand currently in the market. This gives you a massive advantage to scroll back and see how price reacted on previous levels.
- The key level supply and demand has the option to show higher time frame zones along with your current timeframe zones on the chart. This will give you a good confluence when you see both the higher timeframe zone at the same price as the current zone, creating higher probability trades
- The key level supply and demand also gives you the option if if you desire to see lower timeframe zones when you are on a higher timeframe incase these a lower time frame zone your are keeping an eye on
- You will also have the option to get alerts when a zone is created and also an alert when price touches a zone if you want.
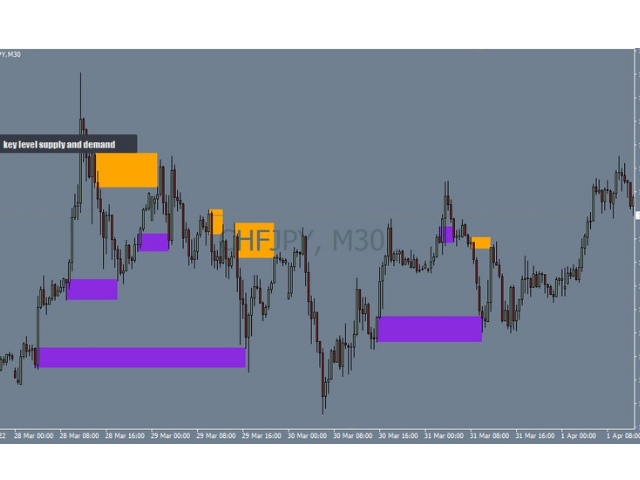
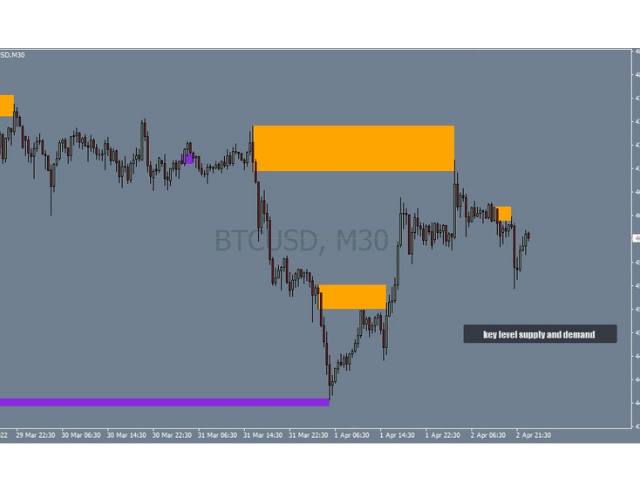
- The key level supply and demand works on all markets from stocks, indices to currency pairs aswell as crypto-currency.
- The key level supply and demand includes an on/off button on the chart to easily keep the charts clean after analysis by just one click.
Recommendation
The main job for the key level supply and demand is to show you zones where price is more likely to react and or turn, and with the option of being able to change settings to see different types of zones, you can try out different zones and scroll back the charts to see how they reacted until you find the most profitable settings for you. For the best entries i recommend using the key level supply and demand alongside key level wedge
N.B : For a limited time only, if you have purchased 2 or more Key level indicators leave a rating and a review on them, and get a Key level wedge dashboard for free. (dashboard only works when you have downloaded the Key level wedge indicator, but you can keep it and later use it if you happen to download the wedge indicator in the future)
Please watch the video below for a more detailed explanation of how the indicator works.