Rira Renko
- 지표
-
Vitor Palmeira Abbehusen
 I've studied Electrical Engineering and MSc. in Telecommunications Engineering.
I started learning to code when I was a teenager starting with C and C++.
I learned coding for microcontrollers in University. - 버전: 1.0
- 활성화: 20
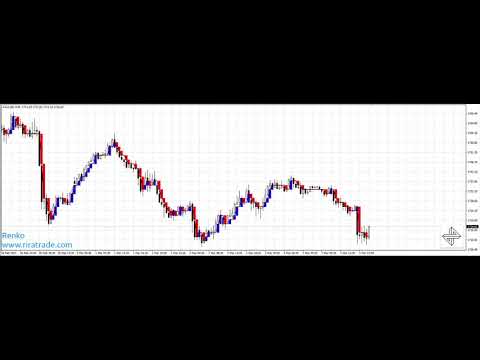
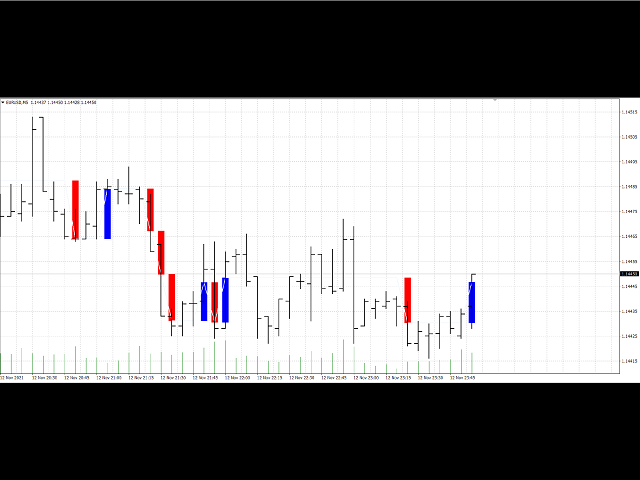
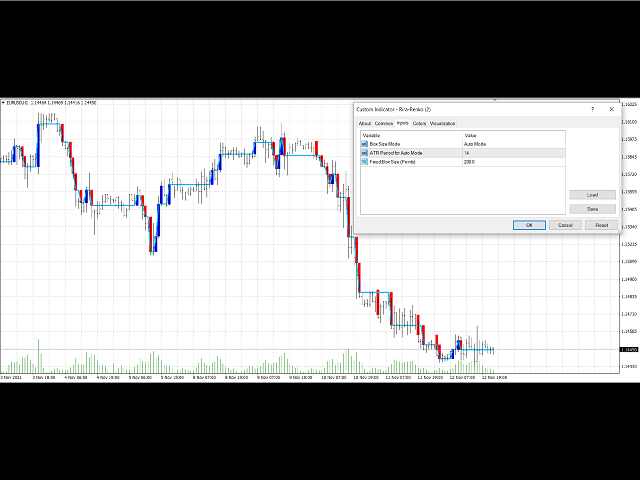
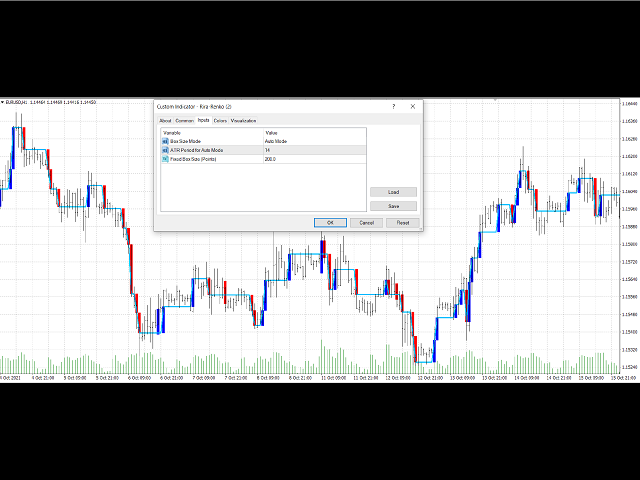
RENKO on Time Chart
This indicator is an enhanced Renko, so you can watch the Renko bricks on the chart to understand price movement more clearly
the other improvement is automated box size according to ATR (Average True Range) period
you can set the ATR number as you want and the box size of Renko changes automatically based on price movement
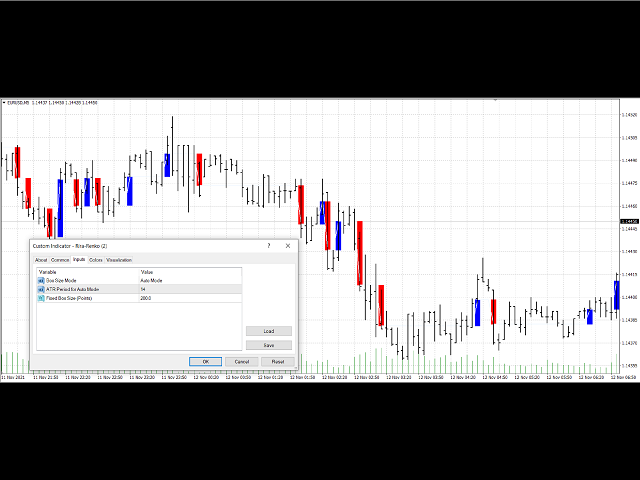
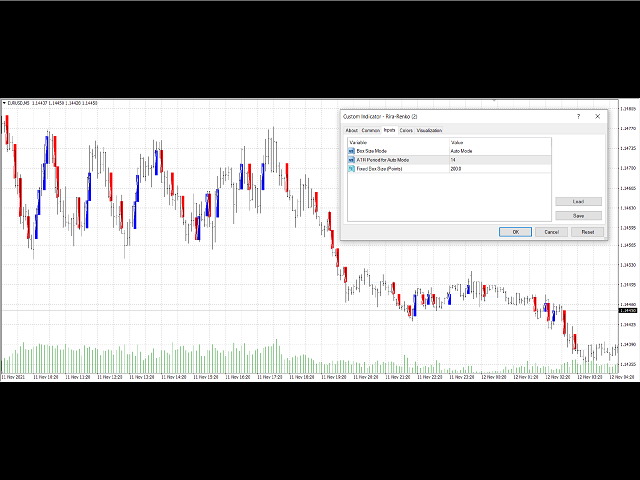
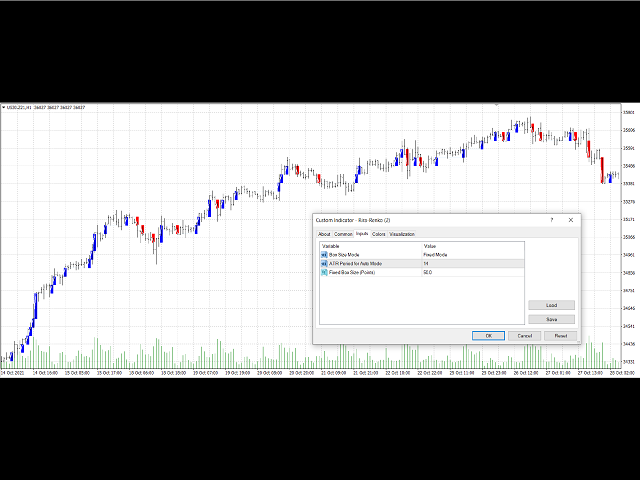
Inputs
- Mode: Box size is the input to specify the size of the Renko box you want to print on the chart. This input lets you choose the fixed box size or automated based on the ATR period
- ATR Period: If you chose automated box size set a compatible period with your strategy
- Fixed Box Size: if you chose the fixed box size (input you enter in this section is based on points)


사용자가 평가에 대한 코멘트를 남기지 않았습니다