Blahtech Fisher Transform MT5
- 지표
-
Blahtech Limited
 Professional IT developer with over 20 years of experience working with top tier investment banks (Barclays Capital, Credit Suisse, Merrill Lynch, ABN Amro, Mizuho Bank) - LinkedIn profile available on request
 - 버전: 1.4
- 업데이트됨: 5 5월 2021
- 활성화: 8
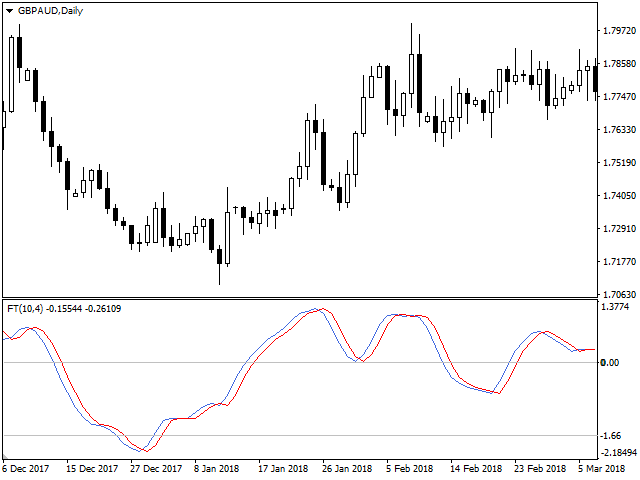
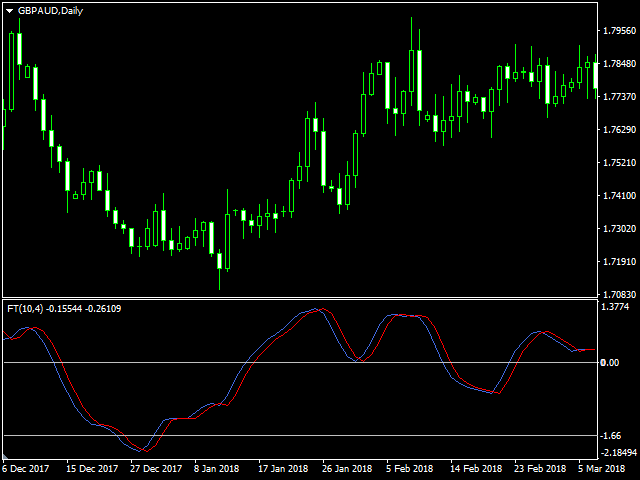
Blahtech Fisher Transform indicator is an oscillator that displays overbought and oversold locations on the chart. The Fisher Transform algorithm transforms prices with any distribution shape into a normal distribution. The end result is a curve with sharp turning points that may help to identify bullish or bearish trends.
Fisher Transform values exceeding 1.66 on the daily chart are considered to be good areas for reversal trades.
Links [ Install | Update | Training | All Products ]
Feature Highlights
- Configurable calculation variables
- Customizable alerts and messages
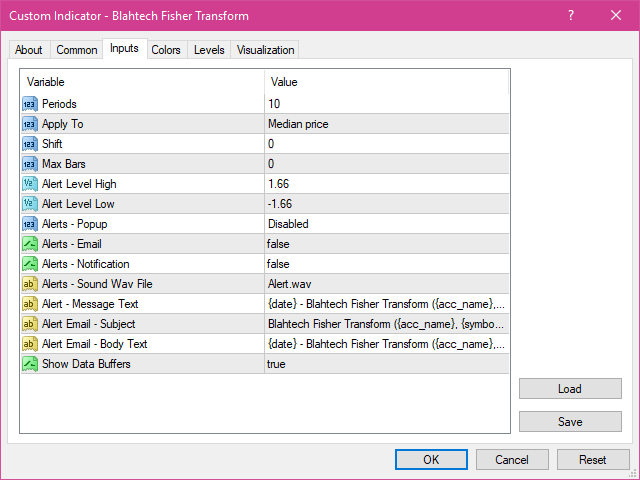
Input Parameters
- Periods - Number of candles back to use for the calculation
- Apply To - Price to use
- Close
- Open
- High
- Low
- Median
- Typical
- Weighted Close
- Shift - Offset display on chart by a number of bars
- Alert Level High - Set the high trigger level
- Alert Level Low - Set the low trigger level
- Alerts -Popup - Enable/disable sound and popup dialog for active alerts
- Disabled
- Sound Only
- Popup and Sound
- Alerts - Email - Enable/disable email for active alerts
- Alerts - Notification - Enable/disable notifications for active alerts
- Alerts - Sound Wav File - Set the wav file to be used for alerts
- Alerts - Message Text - Configure the popup and notification alert message text
- Alerts - Email - Subject - Configure the email alert subject
- Alerts - Email - Body - Configure the email alert body
- Show Data Buffers - Show the iCustom Buffers in the Data window
Developers - iCustom buffers
- Fisher
- Trigger