Advanced ZigZag with Fibo TL and Swing info
- 지표
- 버전: 1.0
- 활성화: 5

Description
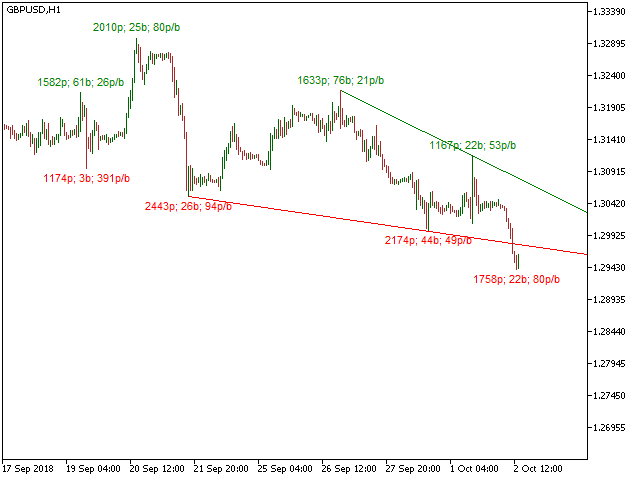
The base of this indicator is an ZigZag algorithm based on ATR and Fibo retracement. The ZigZag can be drawn like a classic ZigZag or like Arrows or needn't be drawn at all. This indicator is not redrawing in sense that the ZigZag's last shoulder is formed right after the appropriate conditions occur on the market. The shoulder doesn't change its direction afterwards (can only continue). There are some other possibilities to show advanced information in this indicator:
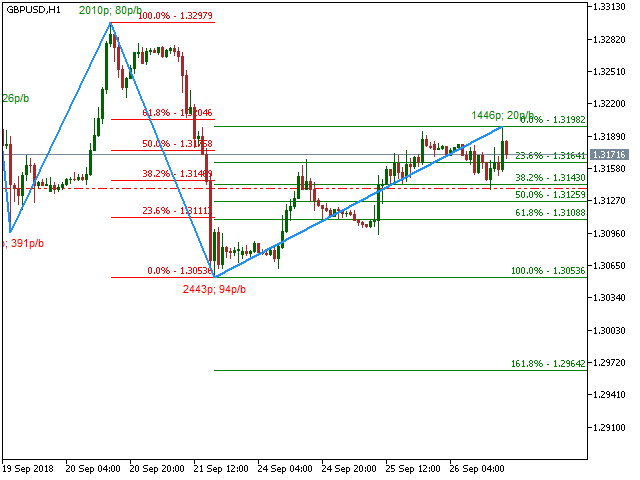
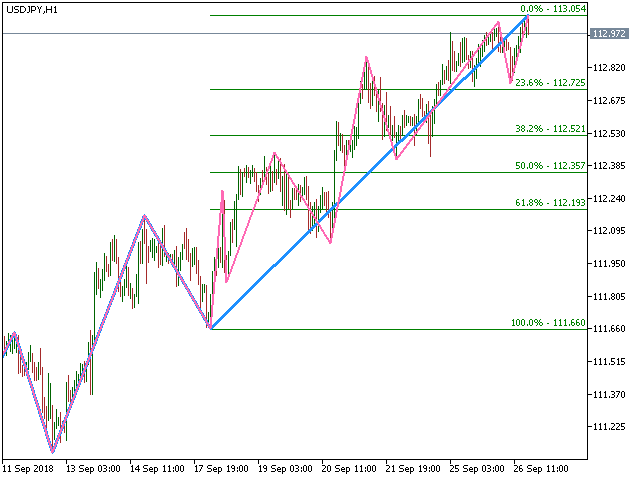
- Auto Fibo on the last and/or previous swing
- Trend lines (0-3 pairs) which connect swing highs / swing lows
- Information about swing size in points and bars and swing "slope" above high swings/under low swings
- Level where the ZigZag will turn a direction
- Levels (price labels) where the ZigZag began a new direction. Note: They can't be drawn backwards and they can appear only if a new direction change happens. If backward analysis is needed a visual tester supposed to be used.
The indicator can alert on a ZigZag direction change (trend change) by notification, e-mail, alert and sound playing.
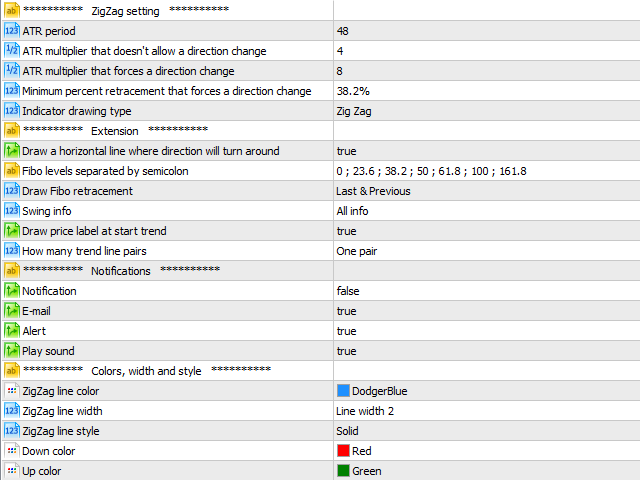
Indicator input parameters
For the ZigZag visualization these three inputs are crucial. They allow to change the sensitivity of the ZigZag.
- ATR multiplier that doesn't allow a direction change
- ATR multiplier that forces a direction change
- Minimum percent retracement that forces a direction change
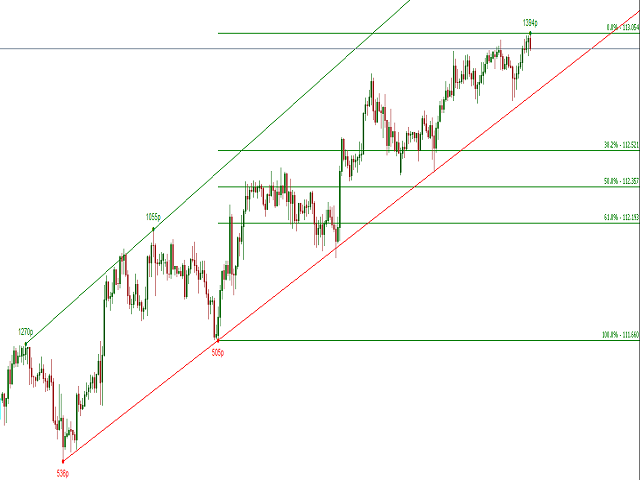

This indicator does draw a few straight lines, but very limited. On occasion the monthly is not seen even though it has two touches. Another observation is if you apply it to the 15M chart on Stock assets, the fib lines are all squished together and not clear. And the green and red numbers are bunched up and unreadable. (It does not say it is only for Forex alone). I think the indicator had good intentions and I give it a 3.5, but would be better priced at around 30 bucks. I purchased it for the trendlines, but will keep looking.