Casual Channel

5

              차트에서 보는 추세가 항상 수익을 올릴 수 있는 추세는 아닙니다. 트렌드에는 두 가지 종류가 있다:  1)  안정적이고 따라서 거래자에게 신뢰할 수 있는 이익을 제공할 수 있는 근본적인 경제적 이유에 의해 야기되는 진정한 추세;  2)   추세처럼 보이지만 일련의 무작위 이벤트로 인해 발생하는 잘못된 추세 섹션 - 가격(주로)을 한 방향으로 이동. 이러한 잘못된 추세 섹션은 짧고 언제든지 방향을 바꿀 수 있습니다(그리고 일반적으로 식별 후 즉시 역전됨).  따라서 잘못된 추세로 돈을 버는 것은 (우연이 아닌) 불가능합니다. 시각적으로 참과 거짓 추세는 처음에는 구별할 수 없습니다. 더욱이 무작위 가격 변동이나 그에 의해 생성된 잘못된 추세는 항상 실제 추세에 중첩되어 특히 실제 추세에서 후퇴를 일으킬 수 있습니다. 그러한 국지적 역전은 새로운 근본적인 경제적 원인에 의해 야기된 글로벌 역전과 식별되고 구별될 필요가 있습니다.

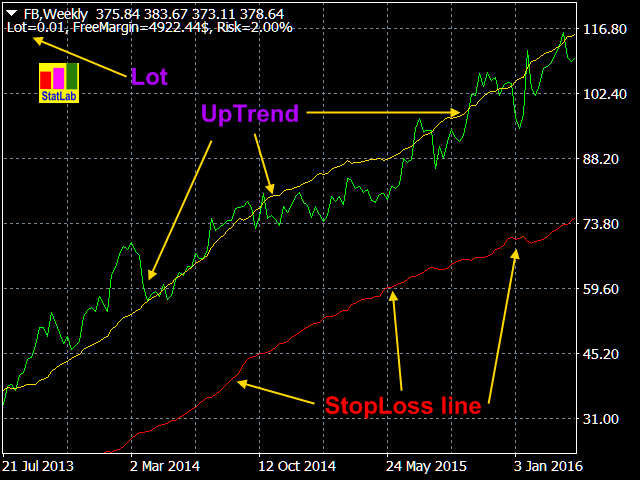
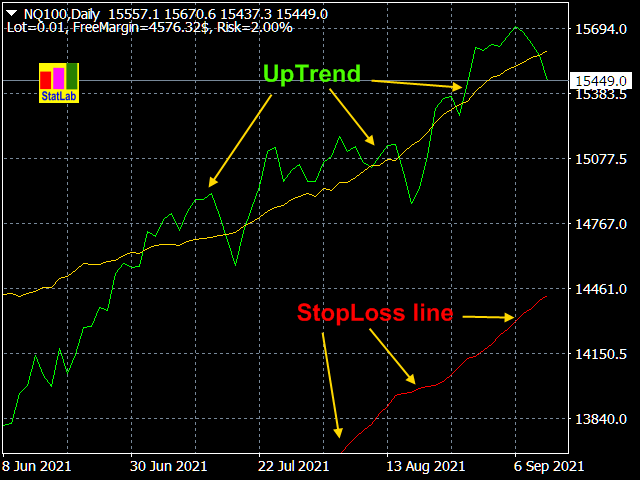
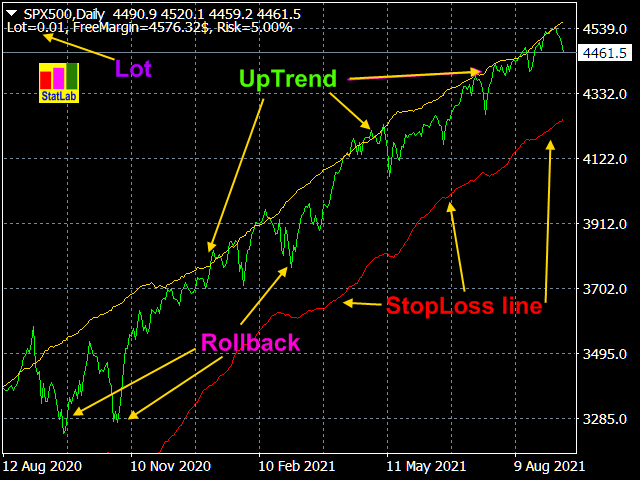
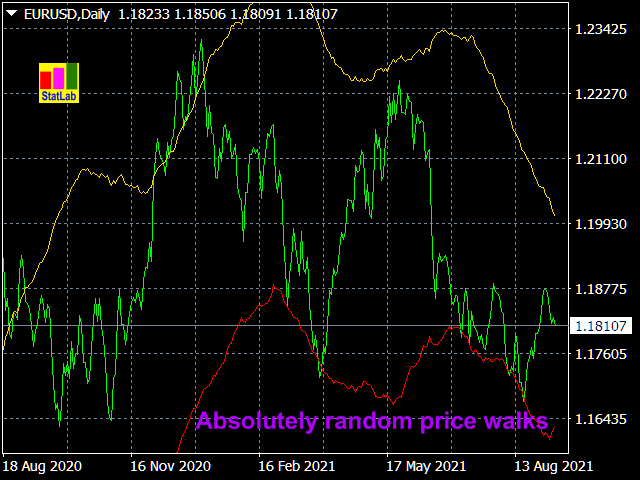
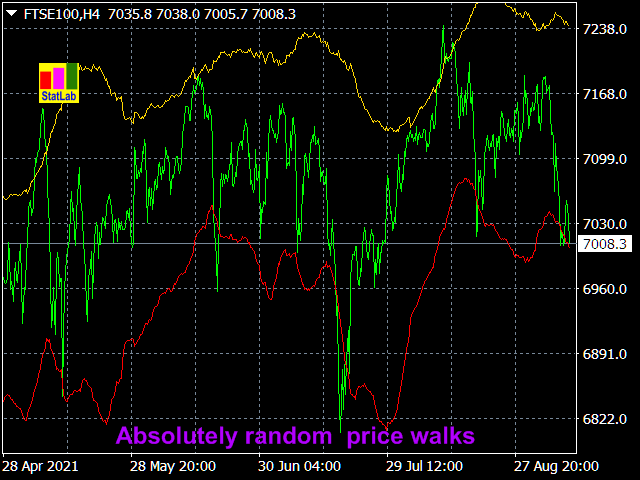
             캐주얼 채널 표시기는 임의의 가격 이동 채널을 표시하여 이러한 두 가지 유형의 추세를 구분합니다. 이 표시기를 통화 쌍 차트에 연결하면 일반적으로 이러한 차트는 전체가 아닌 많은 추세 섹션이 거짓인 랜덤 워크 채널 내부에 있게 됩니다. 동시에 가격은 한 채널 테두리에서 채널 테두리만 만지는 다른 채널 테두리로 이동합니다. "캐주얼 채널(Casual Channel)"을 큰 기간의 지수, CFD 또는 주식 차트에 첨부하면 경우에 따라 해당 견적이 상당히 오랜 기간 동안 랜덤 워크 채널 외부에 있음을 발견할 수 있습니다. 즉, 가격은 상승 추세에서 채널 상단에 있고 가격은 하락 추세에서 채널 하단에 있습니다. 이러한 경우 우리는 진정한 추세를 가지고 있으며 차트가 위쪽 지표선 위에 있거나 차트가 아래쪽 지표선 아래에 있을수록 진정한 추세가 더 강해집니다. 차트가 지표 라인 중 대략 하나를 따를 경우 진정한 추세가 식별된 것으로 간주될 수 있습니다.

             진정한 상승세에서 매수 포지션을 열 때 StopLoss는 지표의 하단 라인에 배치되어야 합니다. 그리고 하락세에서 매도 포지션을 열 때 StopLoss는 지표의 상단 라인에 배치되어야 합니다. 이 경우 롤백으로 나타나는 잘못된 추세 섹션 또는 임의의 가격 움직임을 실제 추세에 부과하면 StopLos가 트리거되지 않으며 이는 글로벌 추세 반전의 경우에만 작동합니다. 그러나 CFD의 추세는 매우 느리게 성장하고 일반적으로 후퇴는 성장 자체를 크게 초과하므로 순전히 추세 전략을 저수익 및 고위험으로 만듭니다.

             지표에는 추세 전략을 사용할 때 StopLoss 라인, 예금 및 선택한 위험 수준을 기반으로 로트를 계산할 수 있는 내장 자금 관리 기능이 있습니다.  채널 내 전략에 이 로트 값을 사용할 수도 있습니다. 그러나 채널 내에서 재생하는 것은 권장되지 않습니다. 채널의 내부 부분은 순전히 무작위 프로세스로 채워져 있습니다. 이 프로세스는 한 표시기 라인에서 다른 표시기 라인으로 정확히 따라갈 필요는 없지만 한 라인에서 채널로 이동하고 다시 돌아올 수 있습니다.


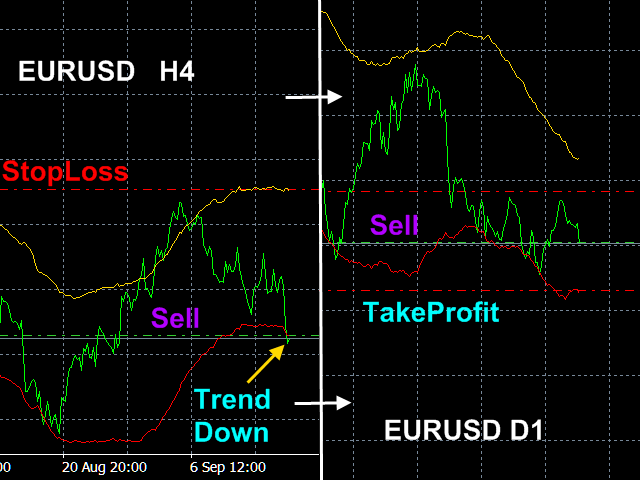
           통화 쌍에 대한 신뢰할 수있는 게임을 위해 특별한 추세 채널 전략이 개발되었으며 그 본질은 다음과 같습니다.

             더 짧은 기간에 추세가 있는 경우(포지션을 여는 시점), 더 큰 기간에 채널 경계에서 멀어지는 추세로 이 추세로 이동하는 가격은 이 채널의 이동 평균선에 도달할 가능성이 큽니다. 그런 다음 큰 채널의 이동 평균 라인에서 이익 실현을 설정해야 합니다. 더 큰 기간의 가격이 더 작은 기간에 설정된 추세를 따르고 추세를 따라 이동 평균에서 멀어지면 큰 채널의 반대쪽 경계에 도달합니다. 따라서 이익실현은 큰 채널의 반대쪽 경계에 설정해야 합니다. 랜덤 워크 채널의 경계는 매우 정확하게 계산됩니다.


표시기 설정.

  • The averaging period.   평균 기간. 수량–임의의 양의 정수(60기본).
  • Calculate the lot size from the risk, deposit and StopLoss? 위험, 예금 및 손절매를 기반으로 로트 크기를 계산하시겠습니까?수량: true, false.
  • Allowable losses in % from Free Margin.  무료 마진의 허용 손실(%). 수량: 0에서 100까지(2.0기본).  


리뷰 1
Kelton Carlos Actis
1171
Kelton Carlos Actis 2022.11.16 10:47 
 

Very useful.

추천 제품
Owl smart levels
Sergey Ermolov
4.24 (37)
MT5 버전  |   FAQ Owl Smart Levels Indicator 는   Bill Williams 의 고급 프랙탈, 시장의 올바른 파동 구조를 구축하는 Valable ZigZag, 정확한 진입 수준을 표시하는 피보나치 수준과 같은 인기 있는 시장 분석 도구를 포함하는 하나의 지표 내에서 완전한 거래 시스템입니다. 시장과 이익을 취하는 장소로. 전략에 대한 자세한 설명 표시기 작업에 대한 지침 고문-거래 올빼미 도우미의 조수 개인 사용자 채팅 ->구입 후 나에게 쓰기,나는 개인 채팅에 당신을 추가하고 거기에 모든 보너스를 다운로드 할 수 있습니다 힘은 단순함에 있습니다! Owl Smart Levels   거래 시스템은 사용하기 매우 쉽기 때문에 전문가와 이제 막 시장을 연구하고 스스로 거래 전략을 선택하기 시작한 사람들 모두에게 적합합니다. 전략 및 지표에는 눈에 보이지 않는 비밀 공식 및 계산 방법이 없으며 모든 전략 지표는 공개되어 있습니다. Owl Smart Leve
Alpha Trend sign has been a very popular trading tool in our company for a long time. It can verify our trading system and clearly indicate trading signals, and the signals will not drift. Main functions: Based on the market display of active areas, indicators can be used to intuitively determine whether the current market trend belongs to a trend market or a volatile market. And enter the market according to the indicator arrows, with green arrows indicating buy and red arrows indicating se
Auto Fibo Pro m
DMITRII GRIDASOV
"Auto FIBO Pro" Crypto_Forex 지표 - 거래에 유용한 보조 도구입니다! - 지표는 자동으로 Fibo 수준과 로컬 추세선(빨간색)을 계산하여 차트에 배치합니다. - Fibonacci 수준은 가격이 반전될 수 있는 주요 영역을 나타냅니다. - 가장 중요한 수준은 23.6%, 38.2%, 50%, 61.8%입니다. - 역전 스캘핑이나 존 그리드 거래에 사용할 수 있습니다. - Auto FIBO Pro 지표를 사용하여 현재 시스템을 개선할 수 있는 기회도 많습니다. - Info Spread Swap Display가 있습니다. 현재 Spread와 Swap이 부착된 외환 쌍을 표시합니다. - 디스플레이에는 계정 잔액, 자본 및 마진도 표시됩니다. - 차트의 어느 모서리에서나 Info Spread Swap Display를 찾을 수 있습니다. 0 - 왼쪽 상단 모서리, 1 - 오른쪽 상단, 2 - 왼쪽 하단, 3 - 오른쪽 하단. 여기를 클릭하여 고품질 트레이딩 로봇과
Happy Scalping Indicator
Leandro Bernardez Camero
이 지표는 공격적인 스캘핑 과 바이너리 옵션에서 빠른 진입 을 위해 설계되었습니다 , 각 캔들 마다 신호를 생성하여 언제든지 무엇이 일어나고 있는지 정확히 알 수 있습니다. Happy Scalping 채널에 가입하세요: MQL5 재작성 없음 : 현재 캔들의 신호는 실시간 으로 생성됩니다. 이는 캔들이 아직 형성 중일 때 가격이 이전 캔들의 종가에 비해 상승하거나 하락하는지에 따라 신호가 변경될 수 있음을 의미합니다. 그러나 캔들이 닫히면 , 신호의 색상은 완전히 고정됩니다 . 변경되지 않으며, 사라지지 않고, 이동하지 않습니다. 보이는 그대로 남습니다. 왜 이렇게 설계되었나요? 많은 스캘퍼들은 특히 가격의 돌파나 급격한 움직임 이 있을 때 즉시 신호를 받는 것을 선호합니다. 이를 통해 그런 빠른 피프스를 바로잡을 수 있습니다. 반면, 일부 트레이더는 닫힌 캔들로 확인을 기다리는 것 을 선호하며, 이 지표는 그들도 완벽하게 사용할 수 있습니다. 두 가지 접근 방식 모두 유효합니
Infinity Trend Pro
Yaroslav Varankin
1 (1)
This is a trend indicator without redrawing Developed instead of the binary options strategy (by the color of the Martingale candlestick) Also works well in forex trading When to open trades (binary options) A signal will appear in the place with a candle signaling the current candle It is recommended to open a deal for one candle of the current timeframe M1 and M5 When a blue dot appears, open a deal up When a red dot appears, open a trade down. How to open trades on Forex. When a signal is rec
The Th3Eng PipFinite indicator is based on a very excellent analysis of the right trend direction with perfect custom algorithms. It show the true direction and the best point to start trading. With StopLoss point and Three Take Profit points. Also it show the right pivot of the price and small points to order to replace the dynamic support and resistance channel, Which surrounds the price. And Finally it draws a very helpful Box on the left side on the chart includes (take profits and Stop loss
PABT Pattern Indicator - it's classical system one of the signal patterns. Indicator logic - the Hi & Lo of the bar is fully within the range of the preceding bar, look to trade them as pullback in trend. In the way if indicator found PABT pattern it's drawing two lines and arrow what showing trend way.  - First line - it's entry point and drawing at: 1. On the high of signal bar or on middle of the signal bar (depending from indicator mode) for buy; 2. On the low of signal bar or on middle of t
Line Magnit
Aleksey Trenin
The LineMagnit Indicator for MT4 is a highly precise tool that builds support and resistance levels which magnetically attract prices. This feature allows traders to easily determine the most probable entry and exit points in the market, as well as identify the market's directional forces, as levels are based on capital inflows into the instrument. Equipped with an intuitively understandable graphical interface, the LineMagnit Indicator enables users to quickly locate and analyze support and res
Stepping Trend
Mpendulo Chiliza
The Stepping Trend Indicator     The Steppi ng Trend indicator uses the  average true range  (ATR indicator) in its calculation. This gives you control to set your own average true range period, I set the Default as 10.   Indicator Details. Green Arrow Up: This means you are at the starting point of a new bullish trend, it’s time to buy.   Red  Arrow  Down : This means you are at the starting point of a new  bearish  trend, it’ s time to sell .   What if you miss the Arrow Signal?   No prob
Super Reversal Pattern
Parfait Mujinga Ndalika
Super Reversal Pattern Indicator Unlock the power of advanced pattern recognition with our Super Reversal Pattern Indicator. Designed for traders seeking precision and reliability, this indicator identifies one of the most effective reversal patterns in technical analysis, offering a significant edge in your trading strategy. Key Features: Non-Repainting Accuracy: Enjoy the confidence of non-repainting technology. Once a Super Reversal Pattern is detected, it remains static, providing consiste
Trendiness Index
Libertas LLC
5 (3)
"The trend is your friend" is one of the best known sayings in investing, because capturing large trendy price movements can be extremely profitable. However, trading with the trend is often easier said than done, because many indicators are based on price reversals not trends. These aren't very effective at identifying trendy periods, or predicting whether trends will continue. We developed the Trendiness Index to help address this problem by indicating the strength and direction of price trend
Chart Patterns Detect 15 patterns (Ascending Triangle, Descending Triangle, Rising Wedge, Falling Wedge, Bullish Flag, Bearish Flag, Bullish Rectangle, Bearish Rectangle Symmetrical triangle, Head and Shoulders, Inverted Head and Shoulders, Triple top, Triple Bottom, Double Top, Double Bottom) Use historical data to calculate the probability of each pattern to succeed (possibility to filter notification according to the chance of success) gives graphic indication about the invalidation level and
캔들의 종가를 예측하는 지표입니다. 지표는 주로 D1 차트에서 사용하기 위한 것이. 이 지표는 전통적인 외환 거래와 바이너리 옵션 거래 모두에 적합합니다. 지표는 독립형 거래 시스템으로 사용하거나 기존 거래 시스템에 추가로 사용할 수 있습니다. 이 표시기는 현재 양초를 분석하여 양초 본체 내부의 특정 강도 요인과 이전 양초의 매개변수를 계산합니다. 따라서 지표는 시장 움직임의 추가 방향과 현재 양초의 종가를 예측합니다. 이 방법 덕분에 지표는 단기 및 중장기 거래 모두에 적합합니다. 지표를 사용하면 시장 상황을 분석하는 동안 지표가 생성할 잠재적 신호의 수를 설정할 수 있습니다. 표시기 설정에는 이를 위한 특별한 매개변수가 있습니다. 또한 인디케이터는 새로운 신호에 대해 차트의 메시지 형태, 이메일 및 PUSH 알림 형태로 알릴 수 있습니다. 구매 후 저에게 꼭 써주세요! 나는 당신에게 지표와 거래에 대한 나의 추천을 줄 것입니다! 또한 보너스를 받으세요!
Power Renko MT4
Pierce Vallieres
Power Renko is an indicator which plots Renko bricks underneath the chart using a histogram. You can select the brick size and the timeframe of the Renko bricks as well as whether or not to use the close price or the high/low price of the candles. Renko bricks are based on price alone, not time, therefor the Renko bricks will not be aligned with the chart's time. They are extremely useful for trend trading and many different strategies can be formed from them. Buffers are provided allowing you t
Octave Fractal Channel — Dynamic Gann-Based Support/Resistance Levels with Auto-Scaling. This indicator plots a dynamic channel based on the fractal structure of price movement. Channel levels adapt to the current symbol and timeframe, making it suitable for use across various financial instruments — from currency pairs to cryptocurrencies and indices. The indicator can be used in combination with other technical tools, such as the RSI oscillator, to provide additional signal filtering. How to
Advanced Trend Regime
Shellard Securities (Pty) Ltd
The indicator has been designed to function on any time-frame and any pair.   This regime filter will help the trader better evaluate whether the current market is trending, and in which direction. It quickly reacts to changes in market dynamics using a series of advanced calculations. The user is able to select whether the calculation remains standard, or if a further filter constraint is added to the calculation.   A Yellow moving average of the signal has been included for the trader to smoot
ZhiBiCCI MT4
Qiuyang Zheng
[ZhiBiCCI] indicators are suitable for all cycle use, and are also suitable for all market varieties. [ZhiBiCCI] Green solid line is a reversal of bullish divergence. The green dotted line is a classic bullish divergence. [ZhiBiCCI] The solid line to the red is a reverse bearish divergence. The red dotted line is a classical bearish divergence. [ZhiBiCCI] can be set in the parameters (Alert, Send mail, Send notification), set to (true) to send instant signals to the alarm window, email, insta
Wave Wolf MT4
Andrei Salanevich
거래 단말기의 현재 창에 늑대 파도를 검색하여 표시하도록 설계되었습니다. 거래에 늑대 파도를 사용하는 상인을위한 훌륭한 지표. 거래 전략에서의 적용은 효율성과 수익성을 크게 증가시킬 것입니다. 표시기에 대한 정보 다른 늑대 웨이브 지표와는 달리,웨이브 고원지 외환 지표는 크게 그 효과를 증가 기능을 가지고 있습니다: 첫 번째는 열린 창 5 점 매개 변수(진정한 값)정보 지원을 제공합니다,즉 늑대 파도가 나타난 차트의 창을 확장합니다. 예를 들어,유로화 차트가 열려 있고 각각에 웨이브 월드 표시기가 설치되어있는 경우 유로화 모델이 감지되면 해당 차트가 자동으로 다른 차트의 맨 위에 포 그라운드로 가져 오므로 많은 상품을 거래 할 때 매우 편리합니다.  두 번째 기능은 맥 디에 내장 된 발산 분석,사용자가 자신을 선택할 수있는 매개 변수(기본 설정(12,26,9))입니다. 그런데 일반적인 오실레이터의 값은 작업 창에 표시되지 않으며 점을 형성 할 때 가격 라벨의 색상에만 반영됩니다
Rainbow Price Visualizer
Vincent Jose Proenca
Rainbow Price Visualizer v1.21 See where the market really breathes. Turns your MT4 chart into an ultra-precise heatmap that highlights price zones favored by big players. Why it matters 300 price levels at 0.2‑pip resolution — microscopic detail. 8 visual themes (Rainbow, Fire, Ocean…) for instant readibility. Smart opacity: low noise fades, real zones pop. Lightweight rendering with automatic cleanup. Fully customizable: saturation, opacity, resolution, history depth. Bands project into the f
Renko, Heiken Ashi, Ticks Bar, Range Bar.    Easy switching, easy setup, all in one window.        Place the Custom Chart indicator and view Renko, Heiken Ashi, Tick bar, Range bar charts in real time at real chart.    Position the offline chart window so that the indicator control panel is visible.    Switch the chart mode by click of a button.    Connect to the output chart any indicator, expert advisor without any restrictions.    No, it doesn't work in the tester.    Yes, you can use an
PipFinite Trend PRO
Karlo Wilson Vendiola
4.88 (2247)
Breakthrough Solution For Trend Trading And Filtering With All Important Features Built Inside One Tool! Trend PRO's smart algorithm detects the trend, filters out market noise and gives entry signals with exit levels. The new features with enhanced rules for statistical calculation improved the overall performance of this indicator. Important Information Revealed Maximize the potential of Trend Pro, please visit www.mql5.com/en/blogs/post/713938 The Powerful Expert Advisor Version Automatin
Trend Oscillator mw
DMITRII GRIDASOV
Trend Oscillator - 고급 맞춤형 Crypto_Forex 지표, 효율적인 거래 도구입니다! - 고급 새로운 계산 방법 사용 - 매개변수 "계산 가격"에 대한 20가지 옵션. - 지금까지 개발된 가장 매끄러운 오실레이터. - 상승 추세는 녹색, 하락 추세는 빨간색. - 과매도 값: 5 미만, 과매도 값: 95 이상. - 이 지표로 표준 전략도 업그레이드할 수 있는 기회가 많습니다. - PC 및 모바일 알림. ................................................................................................................................................ 여기를 클릭하여 고품질 트레이딩 로봇과 지표를 확인하세요! 이 MQL5 웹사이트에서만 제공되는 오리지널 제품입니다.
Gold Phoenix
Yaroslav Varankin
The perfect tool for Scalng in the Forex markets You can trade both from signal to signal and using take profit  The algorithm does not use Zigzag!  No redrawing!  This is a channel instrument that uses a moving average as a filter. Moving Average  There are 2 parameters for the settings Ma Period = 5 period Moving Average  Channel 1.0 distance of channel lines from the chart Price Signal Filter - calculation of signal opening and filter There is a complete set of Alert There is a multi-timefram
Distinctive
Tatiana Savkevych
Distinctive is a forex trending arrow indicator for identifying potential entry points. I like it, first of all, because it has a simple mechanism of work, adaptation to all time periods and trading tactics. Created on the basis of a regression channel with filters. Plotting the Lawrence indicator signals on a price function chart using a mathematical approach. How it works - when the price breaks out in the overbought / oversold zone (channel levels), a buy or sell signal is generated. Everyt
Trend PA
Mikhail Nazarenko
5 (3)
The Trend PA indicator uses   Price Action   and its own filtering algorithm to determine the trend. This approach helps to accurately determine entry points and the current trend on any timeframe. The indicator uses its own algorithm for analyzing price changes and Price Action. Which gives you the advantage of recognizing, without delay, a new nascent trend with fewer false positives. Trend filtering conditions can be selected in the settings individually for your trading style. The indicator
Trade with Gann on your side!! MASTER CIRCLE 360 CIRCLE CHART, originally created by Gann admitted that this is “The Mother of all charts”. It is one of the last studies that this great trader left for us. The numeric tab le is apparently quite simple like all the tables and is based on square numbers, the SQUARE OF 12 and is by evolution, one of the most important square numbers. Here we can find CYCLE, PRICE AND TIME thanks to angles and grades, to show past and future support and resistance.
Trend Monitor
Pavel Zamoshnikov
4 (4)
The indicator generates early signals basing on ADX reading data combined with elements of price patterns. Works on all symbols and timeframes. The indicator does not redraw its signals. You see the same things on history and in real time. For better visual perception signals are displayed as arrows (in order not to overload the chart). Features Easy to use. Filter configuration only requires selection of sensitivity in the " Sensitivity of the indicator " input. Signals can be filtered using
Crypto_Forex 지표 "Morning Star pattern" for MT4. - 지표 "Morning Star pattern"은 가격 액션 거래에 매우 강력한 지표입니다. 다시 칠할 필요 없고 지연도 없습니다. - 지표는 차트에서 강세 Morning Star 패턴을 감지합니다. 차트에 파란색 화살표 신호가 있습니다(그림 참조). - PC, 모바일 및 이메일 알림이 있습니다. - 또한 형제인 약세 "Evening Star pattern" 지표도 사용할 수 있습니다(아래 링크를 따라가세요). - 지표 "Morning Star pattern"은 지지/저항 수준과 결합하기에 매우 좋습니다. 여기를 클릭하여 고품질 트레이딩 로봇과 지표를 확인하세요! 이것은 이 MQL5 웹사이트에서만 제공되는 오리지널 제품입니다.
Trend Ray
Andriy Sydoruk
The indicator shows the potential trend direction by cyclical-wave dependence. Thus, all the rays of the intersection will be optimal rays, in the direction of which the price is expected to move, taking into account the indicator period. Rays can be used as a direction for potential market movement. But we must not forget that the approach must be comprehensive, the indicator signals require additional information to enter the market.
QuantumEdge Trader
Hossam Ali Ahmed Ali
QuantumEdge Trader v1.0 AI-Powered Precision Signals for Serious Traders QuantumEdge Trader is a smart and reliable indicator that delivers accurate BUY and SELL signals using advanced market analysis and trend detection. Designed for M1 to M60 timeframes, it's ideal for scalping and intraday strategies. --- Key Features: No Repaint – Signals never change after appearing Smart trend filters to reduce noise Adjustable sensitivity and alerts Perfect for XAUUSD, EURUSD, and m
이 제품의 구매자들이 또한 구매함
Gann Made Easy
Oleg Rodin
4.82 (148)
Gann Made Easy 는 mr.의 이론을 사용하여 최고의 거래 원칙을 기반으로 하는 전문적이고 사용하기 쉬운 Forex 거래 시스템입니다. W.D. 간. 이 표시기는 Stop Loss 및 Take Profit Levels를 포함하여 정확한 BUY 및 SELL 신호를 제공합니다. PUSH 알림을 사용하여 이동 중에도 거래할 수 있습니다. 거래 팁, 보너스, GANN MADE EA를 무료로 받으시려면 구매 후 저에게 연락주세요! 아마도 Gann 거래 방법에 대해 이미 여러 번 들었을 것입니다. 일반적으로 Gann의 이론은 초보자 거래자뿐만 아니라 이미 거래 경험이 있는 사람들에게도 매우 복잡한 것입니다. Gann의 거래 방식은 이론적으로 적용하기 쉽지 않기 때문입니다. 나는 그 지식을 연마하고 Forex 지표에 최고의 원칙을 적용하기 위해 몇 년을 보냈습니다. 표시기는 적용하기가 매우 쉽습니다. 차트에 첨부하고 간단한 거래 권장 사항을 따르기만 하면 됩니다. 지표는 지속적으로 시장
현재 20% 할인 ! 초보자 또는 전문가 트레이더를 위한 최고의 솔루션! 이 대시보드 소프트웨어는 28개의 통화 쌍에서 작동합니다. 2가지 주요 지표(Advanced Currency Strength 28 및 Advanced Currency Impulse)를 기반으로 합니다. 전체 Forex 시장에 대한 훌륭한 개요를 제공합니다. 고급 통화 강도 값, 통화 이동 속도 및 모든(9) 시간대의 28 Forex 쌍에 대한 신호를 보여줍니다. 추세 및/또는 스캘핑 기회를 정확히 파악하기 위해 차트의 단일 지표를 사용하여 전체 시장을 볼 수 있을 때 거래가 어떻게 개선될지 상상해 보십시오! 잠재적인 거래를 식별하고 확인하면서 강력한 통화와 약한 통화를 더욱 쉽게 식별할 수 있도록 이 지표에 기능을 내장했습니다. 이 표시기는 통화의 강세 또는 약세가 증가 또는 감소하는지 여부와 모든 시간대에서 수행되는 방식을 그래픽으로 보여줍니다. 추가된 새로운 기능은 현재 시장 조건 변화에 적응하는
Meravith
Ivan Stefanov
5 (1)
이 인디케이터는 각 지점에서 볼륨을 분석하고 해당 볼륨에 대한 시장의 피로 레벨을 계산합니다. 이 인디케이터는 세 개의 라인으로 구성됩니다: 강세 볼륨 피로 라인 약세 볼륨 피로 라인 시장 추세를 나타내는 라인. 이 라인은 시장이 강세인지 약세인지에 따라 색이 변합니다. 원하는 시작 지점에서 시장을 분석할 수 있습니다. 볼륨 피로 라인에 도달하면 다음 분석을 시작할 새 지점을 식별하세요. 트렌드와 수정 모두 분석할 수 있습니다. 좋은 접근 방법은 트렌드 라인에 도달하거나 고점 또는 저점에 도달할 때마다 인디케이터를 이동시키는 것입니다. 트렌드 라인과 볼륨 피로 라인 간의 거리가 클수록 해당 방향의 볼륨이 더 큽니다. 트렌드 라인은 주문을 열기 위한 장소로 사용할 수 있으며, 피로 라인은 수익을 얻는 데 사용됩니다. 이 시스템은 정말 독특하지만 매우 직관적입니다. 시장에는 비슷한 제품이 없습니다. 사용에 제한이 없습니다. 모든 시장과 모든 시간 프레임에서 적용할 수 있습니다. 중요:
M1 Sniper
Oleg Rodin
4.89 (18)
M1 SNIPER 는 사용하기 쉬운 거래 지표 시스템입니다. M1 시간대에 맞춰 설계된 화살표 지표입니다. 이 지표는 M1 시간대 스캘핑을 위한 단독 시스템으로 사용할 수 있으며, 기존 거래 시스템의 일부로도 사용할 수 있습니다. 이 거래 시스템은 M1 시간대 거래용으로 특별히 설계되었지만, 다른 시간대에도 사용할 수 있습니다. 원래는 XAUUSD와 BTCUSD 거래를 위해 이 방법을 설계했지만, 다른 시장 거래에도 유용하다는 것을 알게 되었습니다. 이 지표의 신호는 추세 방향과 반대로 거래될 수 있습니다. 저는 지표의 신호를 활용하여 양방향으로 거래할 수 있도록 돕는 특별한 거래 기법을 알려드립니다. 이 방법은 특별한 동적 지지선과 저항선 가격 영역을 활용하는 것을 기반으로 합니다. 구매하시면 M1 SNIPER 화살표 지표를 바로 다운로드하실 수 있습니다. 또한, 아래 스크린샷에 표시된 Apollo Dynamic SR 지표는 M1 SNIPER 도구를 사용하는 모든 사용자에게 무료로
Scalper Inside PRO
Alexey Minkov
4.74 (69)
An exclusive indicator that utilizes an innovative algorithm to swiftly and accurately determine the market trend. The indicator automatically calculates opening, closing, and profit levels, providing detailed trading statistics. With these features, you can choose the most appropriate trading instrument for the current market conditions. Additionally, you can easily integrate your own arrow indicators into Scalper Inside Pro to quickly evaluate their statistics and profitability. Scalper Inside
Currency Strength Exotics
Bernhard Schweigert
4.88 (33)
현재 20% 할인! 초보자 또는 전문가 트레이더를 위한 최고의 솔루션! 이 표시기는 Exotic Pairs Commodities, Indexes 또는 Futures와 같은 기호에 대한 통화 강도를 표시하는 데 특화되어 있습니다. 금, 은, 석유, DAX, US30, MXN, TRY, CNH 등의 진정한 통화 강도를 보여주기 위해 9번째 줄에 모든 기호를 추가할 수 있습니다. 이것은 독특하고 고품질이며 저렴한 거래 도구입니다. 우리는 많은 독점 기능과 새로운 공식을 통합했습니다. 새로운 추세 또는 스캘핑 기회의 정확한 트리거 포인트를 정확히 찾아낼 수 있기 때문에 거래가 어떻게 개선될지 상상해 보십시오. 사용 설명서: 여기를 클릭 https://www.mql5.com/en/blogs/post/708876 모든 시간대에 작동합니다. TREND를 빠르게 확인할 수 있습니다! 새로운 기본 알고리즘을 기반으로 설계되어 잠재적인 거래를 더욱 쉽게 식별하고 확인할 수 있습니다. 8개의
Advanced Supply Demand
Bernhard Schweigert
4.91 (296)
현재 33% 할인! 초보자나 전문 트레이더를 위한 최고의 솔루션! 이 보조지표는 우리가 다수의 독창적 기능과 새로운 공식을 통합한 독특하고 고품질이며 저렴한 거래 도구입니다. 이 업데이트를 통해 이중 시간대를 표시할 수 있습니다. 더 높은 TF를 표시할 수 있을 뿐만 아니라 차트 TF와 더 높은 TF 모두를 표시할 수 있습니다: 중첩 영역 표시. 모든 Supply Demand 트레이더들이 좋아할 것입니다. :) 중요한 정보 공개 Advanced Supply Demand의 잠재력을 극대화하려면 다음을 방문하십시오. https://www.mql5.com/ko/blogs/post/720245   진입 또는 목표의 명확한 트리거 포인트를 정확히 찾아냄으로 해서 거래가 어떻게 개선될지 상상해 보십시오. 새로운 알고리즘을 기반으로 매수자와 매도자 간의 잠재적인 불균형을 훨씬 더 쉽게 분간할 수 있습니다. 왜냐하면 가장 강한 공급영역과 가장 강한 수요 영역과 과거에 어떻게 진행 되었는지를(이전
Trend indicator AI
Ramil Minniakhmetov
5 (74)
트렌드 인공 지능 지표는 실행 가능한 진입 점 및 반전 경고와 추세 식별을 결합하여 상인의 시장 분석을 향상시킬 훌륭한 도구입니다. 이 표시기는 사용자가 자신감과 정밀도로 외환 시장의 복잡성을 탐색 할 수 있도록 지원합니다 기본 신호 외에도 트렌드 인공 지능 지표는 풀백 또는 되돌림 중에 발생하는 2 차 진입 점을 식별하여 거래자가 기존 트렌드 내에서 가격 수정을 활용할 수 있도록합니다. 중요한 장점: ·작동 4 및 5 *명확한 구매 또는 판매 신호 *다시 칠하지 않습니다 *모든 자산에서 작동 나는 전보 사기에 개 또는 세트를 판매하지 않도록주의. 모든 설정은 블로그에 여기에 무료.  중요! 지침 및 보너스를 얻기 위해 구입 후 즉시 저에게 연락! 진짜 가동 감시는 뿐 아니라 나의 다른 제품 여기에서 찾아낼 수 있습니다: https://www.mql5.com/en/users/mechanic/seller&nbsp ; 설정 및 입력: 모든 자산에 대해 기본 설정을 권
SMC Easy Signal
Mohamed Hassan
4.73 (15)
3 copies left at $65, next price is $120 SMC Easy Signal was built to remove the confusion around the smart money concept by turning structural shifts like BOS (Break of Structure) and CHoCH (Change of Character) into simple buy and sell trading signals. It simplifies market structure trading by automatically identifying breakouts and reversals as they happen, allowing traders to focus on execution rather than analysis. Whether the market is continuing its trend or preparing to reverse, the i
이 지표를 구매하면 제 프로페셔널 트레이드 매니저를 무료로 드립니다. 우선 이 거래 시스템이 리페인팅, 리드로잉 및 레이그 인디케이터가 아니라는 점을 강조하는 것이 중요합니다. 이는 수동 및 로봇 거래 모두에 이상적인 것으로 만듭니다. 온라인 강좌, 설명서 및 프리셋 다운로드. "스마트 트렌드 트레이딩 시스템 MT5"은 새로운 및 경험이 풍부한 트레이더를 위해 맞춤형으로 제작된 종합적인 거래 솔루션입니다. 10개 이상의 프리미엄 인디케이터를 결합하고 7개 이상의 견고한 거래 전략을 특징으로 하여 다양한 시장 조건에 대한 다목적 선택이 가능합니다. 트렌드 추종 전략: 효과적인 트렌드 추이를 타기 위한 정확한 진입 및 손절 관리를 제공합니다. 반전 전략: 잠재적인 트렌드 반전을 식별하여 트레이더가 범위 시장을 활용할 수 있게 합니다. 스캘핑 전략: 빠르고 정확한 데이 트레이딩 및 단기 거래를 위해 설계되었습니다. 안정성: 모든 인디케이터가 리페인팅, 리드로잉 및 레이그가 아니므로 신뢰
이 지표는 실제 거래에 완벽한 자동 파동 분석 지표입니다! 사례... 참고:   웨이브 그레이딩에 서양식 이름을 사용하는 데 익숙하지 않습니다. Tang Lun(Tang Zhong Shuo Zen)의 명명 규칙의 영향으로 기본 웨이브를   펜   으로 명명하고 2차 웨이브 밴드를   세그먼트   로 명명했습니다. 동시에, 세그먼트에는 추세 방향이 있습니다.   주요 추세 세그먼트에는   이름이 지정되지만(이 이름 지정 방법은 향후 노트에서 사용됩니다. 먼저 말씀드리겠습니다.) 알고리즘은 굴곡 이론과 거의 관련이 없으므로 그렇게 해서는 안 됩니다. 이는 나의 시장 분석을   통해 요약된 끊임없이 변화하고 복잡한 운영 규칙을   반영합니다. 밴드는 더 이상 사람마다 다르지 않도록 표준화되고 정의되었습니다. 인위적인 간섭의 드로잉 방법은 시장 진입을 엄격하게 분석하는 데 핵심적인 역할을 합니다. 이 지표를 사용하는 것은 거래 인터페이스의 미학을 개선하고 원래의 K-line 거래를
PRO Renko System
Oleg Rodin
5 (29)
PRO Renko System 은 RENKO 차트 거래를 위해 특별히 고안된 매우 정확한 거래 시스템입니다. 이것은 다양한 거래 상품에 적용될 수있는 보편적 인 시스템입니다. 체계는 효과적으로 당신에게 정확한 반전 신호에 접근을 주는 소위 시장 소음을 중화합니다. 이 표시기는 사용하기가 매우 쉽고 신호 생성을 담당하는 매개 변수가 하나만 있습니다. 당신은 쉽게 당신의 선택의 어떤 무역 계기에 공구를 적응시킬 수 있고 renko 막대기의 크기. 나는 항상 당신이 내 소프트웨어로 수익성있게 거래 할 수 있도록 추가 지원을 제공 할 준비가되어 있습니다! 나는 당신에게 행복하고 수익성있는 거래를 기원합니다! 구매 후 저에게 연락하십시오! 내 렌코 차트 생성기를 보내드립니다. 또한 내 개인 권장 사항 및 시스템의 다른 모듈을 무료로 공유 할 것입니다!
FX Power MT4 NG
Daniel Stein
4.95 (20)
FX Power: 통화 강세 분석으로 더 스마트한 거래 결정을 개요 FX Power 는 어떤 시장 상황에서도 주요 통화와 금의 실제 강세를 이해하기 위한 필수 도구입니다. 강한 통화를 매수하고 약한 통화를 매도함으로써 FX Power 는 거래 결정을 단순화하고 높은 확률의 기회를 발견합니다. 트렌드를 따르거나 극단적인 델타 값을 사용해 반전을 예측하고자 한다면, 이 도구는 귀하의 거래 스타일에 완벽히 적응합니다. 단순히 거래하지 말고, FX Power 로 더 스마트하게 거래하세요. 1. FX Power가 거래자에게 매우 유용한 이유 통화와 금의 실시간 강세 분석 • FX Power 는 주요 통화와 금의 상대적 강세를 계산하고 표시하여 시장 역학에 대한 명확한 통찰력을 제공합니다. • 어떤 자산이 앞서고 있고 어떤 자산이 뒤처지는지 모니터링하여 보다 현명한 거래 결정을 내릴 수 있습니다. 포괄적인 멀티 타임프레임 뷰 • 단기, 중기 및 장기 타임프레임에서 통화와 금의 강세를
Looking for a powerful yet lightweight swing detector that accurately identifies market structure turning points? Want clear, reliable buy and sell signals that work across any timeframe and any instrument? Buy Sell Arrow MT Swing is built exactly for that — precision swing detection made simple and effective. This indicator identifies Higher Highs (HH) , Higher Lows (HL) , Lower Highs (LH) , and Lower Lows (LL) with remarkable clarity. It is designed to help traders easily visualize market str
Dynamic Forex28 Navigator
Bernhard Schweigert
4.43 (7)
Dynamic Forex28 Navigator - 차세대 외환 거래 도구. 현재 49% 할인. Dynamic Forex28 Navigator는 오랫동안 인기 있는 지표의 진화형으로, 세 가지의 힘을 하나로 결합했습니다. 고급 통화 Strength28 지표(695개 리뷰) + 고급 통화 IMPULSE with ALERT(520개 리뷰) + CS28 콤보 신호(보너스). 지표에 대한 자세한 정보 https://www.mql5.com/en/blogs/post/758844 차세대 Strength 지표는 무엇을 제공합니까?  원래 지표에서 좋아했던 모든 것이 새로운 기능과 더 높은 정확도로 강화되었습니다. 주요 기능: 독점적인 통화 Strength 공식.  모든 시간대에 걸쳐 부드럽고 정확한 강도선. 추세와 정확한 진입을 식별하는 데 이상적입니다. 역동적인 시장 피보나치 수준(시장 피보나치).  이 지표에만 있는 고유한 기능. 가격 차트가 아닌 통화 강도에 피보나치가 적용됩니다.
ACB Breakout Arrows
KEENBASE SOFTWARE SOLUTIONS
4.15 (34)
ACB Breakout Arrows 지표는 특별한 돌파 패턴을 감지하여 시장에서 매우 중요한 진입 신호를 제공합니다. 이 지표는 차트를 지속적으로 스캔하며 한 방향으로 안정적인 모멘텀이 형성되는지를 확인하고, 주요 움직임 직전에 정확한 진입 신호를 제공합니다.  다중 심볼 및 다중 타임프레임 스캐너 받기 – ACB Breakout Arrows MT4용 스캐너 주요 기능 지표가 자동으로 손절(Stop Loss) 및 이익실현(Take Profit) 레벨을 제공합니다. 모든 시간대의 돌파 신호를 추적하는 MTF 스캐너 대시보드가 포함되어 있습니다. 단타 트레이더, 스윙 트레이더, 스캘퍼에게 적합합니다. 정확도를 높이기 위한 최적화된 알고리즘 사용. 손익분기(Breakeven) 또는 단기 목표를 위한 특수 라인(퀵 프로핏 라인) 제공. 승률, 성공률, 평균 수익 등과 같은 성과 분석 지표 제공. 리페인트 없음 – 한번 생성된 신호는 사라지지 않습니다. 거래 확인 -  신뢰도 낮은 신호를
Currency Strength Wizard
Oleg Rodin
4.84 (55)
통화 강도 마법사는 성공적인 거래를 위한 올인원 솔루션을 제공하는 매우 강력한 지표입니다. 표시기는 여러 시간 프레임의 모든 통화 데이터를 사용하여 이 또는 해당 외환 쌍의 힘을 계산합니다. 이 데이터는 특정 통화의 힘을 확인하는 데 사용할 수 있는 사용하기 쉬운 통화 지수 및 통화 전력선의 형태로 표시됩니다. 필요한 것은 거래하려는 차트에 표시기를 부착하는 것뿐입니다. 표시기는 거래하는 통화의 실제 강세를 보여줍니다. 지표는 또한 추세와 거래할 때 유리하게 사용할 수 있는 구매 및 판매 거래량 압력의 극한값을 보여줍니다. 지표는 또한 피보나치에 기반한 가능한 대상을 보여줍니다. 표시기는 PUSH 알림을 포함한 모든 유형의 알림을 제공합니다. 구매 후 연락주세요. 나는 당신과 거래 팁을 공유하고 당신에게 무료로 훌륭한 보너스 지표를 줄 것입니다! 나는 당신에게 행복하고 유익한 거래를 기원합니다!
Advanced Currency Strength28 Indicator
Bernhard Schweigert
4.91 (657)
현재 26% 할인 초보자 또는 전문가 트레이더를 위한 최고의 솔루션! 이 지표는 우리가 독점 기능과 새로운 공식을 통합했기 때문에 독특하고 고품질이며 저렴한 거래 도구입니다. 단 하나의 차트로 28 Forex 쌍의 통화 강도를 읽을 수 있습니다! 새로운 추세 또는 스캘핑 기회의 정확한 트리거 포인트를 정확히 찾아낼 수 있기 때문에 거래가 어떻게 개선될지 상상해 보십시오. 사용 설명서: 여기를 클릭  https://www.mql5.com/en/blogs/post/697384 그것이 첫 번째, 원본입니다! 쓸모없는 지망생 클론을 사지 마십시오. 더 스페셜  강력한 통화 모멘텀을 보여주는 하위 창의 화살표 GAP가 거래를 안내합니다! 기본 또는 호가 통화가 과매도/과매도 영역(외부 시장 피보나치 수준)에 있을 때 개별 차트의 기본 창에 경고 표시가 나타납니다. 통화 강도가 외부 범위에서 떨어질 때 풀백/반전 경고. 교차 패턴의 특별 경고 추세를 빠르게 볼 수 있는 다중 시간
Day Trader Master
Oleg Rodin
5 (15)
Day Trader Master 는 데이 트레이더를 위한 완벽한 거래 시스템입니다. 시스템은 두 개의 지표로 구성됩니다. 하나의 지표는 매수 및 매도를 위한 화살표 신호입니다. 얻을 수 있는 화살표 표시기입니다. 2차 지표를 무료로 드립니다. 두 번째 지표는 이러한 화살표와 함께 사용하도록 특별히 설계된 추세 지표입니다. 표시기는 반복하지 않고 늦지 않습니다! 이 시스템을 사용하는 것은 매우 간단합니다. 2색 선으로 표시되는 현재 추세 방향의 화살표 신호를 따라가기만 하면 됩니다. 파란색은 구매 추세입니다. 빨간색은 판매 추세입니다. 파란색 화살표는 매수 신호입니다. 빨간색 화살표는 매도 신호입니다. 추세선의 색상과 일치하려면 화살표의 색상과 신호의 방향이 필요합니다. 화살표 표시기는 주로 시간 간격 M5 및 M15에서 일중 거래를 위해 만들어졌습니다. 그러나 기술적으로 시스템은 다른 시간 간격으로 사용할 수 있습니다. 표시기에는 PUSH 메시지 기능이 있는 팝업 경고가 장착되어 있
Entry Points Pro
Yury Orlov
4.62 (172)
다시 색을 칠하지 않고 거래에 진입할 수 있는 정확한 신호를 제공하는 MT4용 지표입니다. 외환, 암호화폐, 금속, 주식, 지수 등 모든 금융 자산에 적용할 수 있습니다. 매우 정확한 추정값을 제공하고 매수와 매도의 가장 좋은 시점을 알려줍니다. 하나의 시그널로 수익을 내는 지표의 예와 함께 비디오 (6:22)시청하십시오! 대부분의 거래자는 Entry Points Pro 지표의 도움으로 첫 거래 주 동안 트레이딩 결과를 개선합니다. 저희의   Telegram Group 을 구독하세요! Entry Points Pro 지표의 좋은점. 재도색이 없는 진입 신호 신호가 나타나고 확인되면(시그널 캔들이 완성된 경우) 신호는 더 이상 사라지지 않습니다. 여타 보조지표의 경우 신호를 표시한 다음 제거되기 때문에 큰 재정적 손실로 이어집니다. 오류 없는 거래 게시 알고리즘을 통해 트레이드(진입 또는 청산)를 할 이상적인 순간을 찾을 수 있으며, 이를 통해 이를 사용하는 모든 거래자의 성공률이
Hidden Cycles
Lev Vladimirovic Marushkin
5 (1)
Black Friday Sale – Limited Time! Grab Hidden Cycles for only $129 (regular price $179 ). This is your chance to boost your strategy with a powerful, easy-to-use cycle-based trading tool. Offer ends soon — don’t miss it! Based on Universal Laws — NOT Some Guy’s Algorithm: Let the market adjust to the Hidden Cycles Geometry — not the other way around. Most indicators are based on a man-made formula. They often lag, fail over time, or need constant re-optimization.  Hidden Cycles is different.
Adaptive Volatility Range
Stanislav Konin
5 (3)
Adaptive Volatility Range [AVR] is a powerful tool for identifying key trend reversal points. AVR accurately reflects the Average True Range (ATR) of volatility, taking into account the Volume-Weighted Average Price (VWAP). The indicator adapts to any market volatility by calculating the average volatility over a specific period, ensuring a stable rate of profitable trades. You receive not just an indicator but a professional automated trading system , AVR-EA . Advantages: Automated Trading Sys
Smc Blast Signal
Mohit Dhariwal
SMC Blast Signal with FVG, BOS and trend Breakout The SMC Blast Signal  is a  Precise trading system for Meta Trader 4 that uses Smart Money Concepts (SMC) , including Fair Value Gaps (FVG) and Break of Structure (BOS) , to identify high-probability trades. It incorporates a Trend Filter using a higher timeframe moving average, ensuring trades align with the prevailing market trend. TREND SIGNAL-FVG DETECTION-BOS DETECTION-TRADE CONFIRMED-Precise Signal entries on m15  Best TF-M15 AND ABOVE Be
Upper and Lower Reversal - 반전 순간의 조기 예측을 위한 시스템입니다. 상한 및 하한 가격 이동 채널의 경계에서 가격 전환점을 찾을 수 있습니다. 표시기는 신호 화살표의 색상을 다시 지정하거나 위치를 변경하지 않습니다. 빨간색 화살표는 매수 신호, 파란색 화살표는 매도 신호입니다. 모든 기간 및 거래 수단에 맞게 조정됩니다. 표시기는 다시 그려지지 않으며 양초가 닫힐 때만 작동합니다. 신호에 대한 경고에는 여러 유형이 있습니다. 이 표시기는 사용하기 쉽고 2개의 외부 구성 매개변수만 있습니다. Channel Length - 신호가 구축될 가격 채널의 길이를 조정합니다. Signal Normalization - 신호 화살표의 품질 수준을 변경합니다. 매개변수가 높을수록 잘못된 신호가 줄어듭니다(BTC, 금 및 변동성이 높은 상품의 경우 몇 배로 변경됨). Alerts play sound / Alerts display message / Alerts send n
Advanced Currency IMPULSE with ALERT
Bernhard Schweigert
4.91 (489)
현재 31% 할인!! 초보자 또는 전문가 트레이더를 위한 최고의 솔루션! 이 지표는 우리가 독점 기능과 비밀 공식을 통합했기 때문에 독특하고 고품질이며 저렴한 거래 도구입니다. 단 하나의 차트로 28개 통화 쌍 모두에 대한 경고를 제공합니다. 새로운 추세 또는 스캘핑 기회의 정확한 트리거 포인트를 정확히 찾아낼 수 있기 때문에 거래가 어떻게 개선될지 상상해 보십시오! 새로운 기본 알고리즘을 기반으로 구축되어 잠재적인 거래를 훨씬 더 쉽게 식별하고 확인할 수 있습니다. 이는 통화의 강세 또는 약세가 가속되는지 여부를 그래픽으로 표시하고 가속 속도를 측정하기 때문입니다. 자동차의 속도계처럼 생각하면 됩니다. 가속화할 때 Forex 시장에서 동일한 일이 분명히 더 빠르게 발생합니다. 즉, 반대 방향으로 가속화되는 통화를 페어링하면 잠재적으로 수익성 있는 거래를 식별한 것입니다. 통화 모멘텀의 수직선과 화살표가 거래를 안내합니다! 역동적인 Market Fibonacci 23 레벨은
Royal Wave Pro M4
Vahidreza Heidar Gholami
5 (3)
Royal Wave is a Trend-Power oscillator which has been programmed to locate and signal low-risk entry and exit zones. Its core algorithm statistically analyzes the market and generates trading signals for overbought, oversold and low volatile areas. By using a well-designed alerting system, this indicator makes it easier to make proper decisions regarding where to enter and where to exit trades. Features Trend-Power Algorithm Low risk Entry Zones and Exit Zones Predictions for Overbought and Over
RelicusRoad Pro
Relicus LLC
4.63 (106)
훌륭한 백테스트 , 환상적인 숫자로 증명된 실계좌 성능 , 그리고 온갖 통계 를 가진 트레이딩 지표를 얼마나 많이 구매했지만, 사용 후에 결국 계좌를 날려버린 적이 있나요? 신호 자체만으로는 신뢰할 수 없습니다. 애초에 그 신호가 왜 나타났는지 알아야 하며, 이것이 바로 RelicusRoad Pro가 가장 잘하는 일입니다! 사용자 설명서 + 전략 + 교육 비디오 + VIP 접근 권한이 있는 비공개 그룹 + 모바일 버전 사용 가능 시장을 바라보는 새로운 방법 RelicusRoad는 외환, 선물, 암호화폐, 주식 및 지수를 위한 세계에서 가장 강력하고 최고의 트레이딩 지표 이며, 트레이더가 계좌를 성장 시키는 데 필요한 모든 정보와 도구를 제공합니다. 저희는 초보자 부터 고급 트레이더까지 모든 트레이더가 성공 할 수 있도록 기술적 분석 과 트레이딩 계획 을 제공합니다. 이것은 미래 시장을 예측 하기에 충분한 정보를 제공하는 핵심 트레이딩 지표 입니다. 저희는 차트에 여러 다른 지표
FX Volume
Daniel Stein
4.62 (37)
FX Volume: 브로커 시각에서 바라보는 진짜 시장 심리 간단 요약 트레이딩 접근 방식을 한층 더 향상시키고 싶으신가요? FX Volume 는 소매 트레이더와 브로커의 포지션을 실시간으로 파악할 수 있게 해 줍니다. 이는 COT 같은 지연된 보고서보다 훨씬 빠릅니다. 꾸준한 수익을 추구하는 분이든, 시장에서 더 깊은 우위를 원하시는 분이든, FX Volume 을 통해 대규모 불균형을 찾아내고, 돌파 여부를 확인하며 리스크 관리를 정교화할 수 있습니다. 지금 시작해 보세요! 실제 거래량 데이터가 의사결정을 어떻게 혁신할 수 있는지 직접 경험해 보시기 바랍니다. 1. 트레이더에게 FX Volume이 매우 유익한 이유 탁월한 정확도를 지닌 조기 경보 신호 • 다른 사람들보다 훨씬 앞서, 각 통화쌍을 매수·매도하는 트레이더 수를 거의 실시간으로 파악할 수 있습니다. • FX Volume 은 여러 리테일 브로커에서 추출한 실제 거래량 데이터를 종합해 명확하고 편리한 형태로 제공하는
ProEngulfing
Ashkan Hazegh Nikrou
4.5 (2)
ProEngulfing 소개 - MT4용 전문 Engulf 패턴 인디케이터 정밀도의 힘을 발휘하세요. ProEngulfing은 외환 시장에서 자격이 있는 Engulf 패턴을 식별하고 강조하기 위해 설계된 첨단 인디케이터로, MetaTrader 4용으로 개발되었습니다. ProEngulfing은 Engulf 패턴을 정확하게 식별하고 강조하기 위한 철저한 접근 방식을 제공하여 거래 결정에 대한 가장 신뢰할 수 있는 신호만을 제공합니다. ProEngulfing이 작동하는 방식: ProEngulfing은 Engulf 패턴을 분석하기 위해 정교한 알고리즘을 사용하여 패턴 인식 이상의 기능을 제공하여 이러한 패턴이 실제로 자격이 있는지 확인합니다. 다음은 그 작동 방식입니다. 자격 기준: 이 인디케이터는 몸통의 백분율을 전체 양초 크기와 비교하고 그림자의 백분율을 양초 크기와 비교합니다. 이 세심한 평가를 통해 고확률 Engulf 패턴만이 주목받도록 보장됩니다. 연속성 확인: ProEngulf
Candle Binary Scalper - is a technical analysis product for forex and binary options. Includes several technical indicators combined into a trading system. Suitable for manual trading within a trend, for scalping and binary options. Works on all time frames and trading instruments. Recommended Timeframes for trading M15, M30, H1 and H4, M5 and M1 should be used in case of high volatility. There are several types of alerts. How to use the product The optimal settings have already been selected
제작자의 제품 더 보기
Identify Trend
Aleksey Ivanov
4.09 (23)
"추세 식별" 표시기는 매우 정확하고 가장 중요한 것은 짧은 지연으로 진정한 추세 움직임의 시작을 확립할 수 있는 강력한 필터링 방법을 사용합니다. 지표는 거래 스캘퍼 전략과 장기 거래 전략 모두에 사용할 수 있습니다.              지표 평균 알고리즘은 마지막 스크린샷에 나와 있습니다.               표시기 판독값은 명확하고 매우 간단하며 설명이 필요하지 않습니다. 지표의 파란색 선은 상승 추세를 표시하고 금색 선은 플랫, 빨간색 선은 하락 추세를 나타냅니다.  빨간색 또는 금색 선이 파란색으로 바뀌면 바이 로트가 열려야 합니다. 파란색 또는 금색 라인이 빨간색으로 변경되면 매도 포지션이 열립니다.         가격 변경 방향의 가능한 순간은 어떤 상황에서도 다시 그려지지 않는 화살표로 표시됩니다. 표시기는 모든 유형의 알림을 포함합니다. 표시 지침(추세 방향에 대한)이 마지막 두 막대에서 일치할 때 경고가 트리거됩니다.     표시기 설
FREE
Scientific trade
Aleksey Ivanov
5 (1)
An extremely convenient indicator that truly makes the process of making money on the exchange easy. It is based on the scientifically rigorous theory of the market developed by the author, the beginning of which is presented here .                The full algorithm of this indicator operation is presented in the article .               The indicator calculates the most probable price movement trajectory and displays it on the chart. Based on the predicted price movement trajectory
Firstly , the script estimates how many Mx bars of the chart (on which this script is applied) the future trend will most likely continue and what is its quality. Secondly (and most importantly), the script is an auxiliary tool for the extremely mathematically advanced and extremely effective ScientificTrade indicator in trading. The script calculates the optimal averaging period, which is also equal to Mx, of the ScientificTrade indicator, which gives the maximum profit according to the strate
Absolute Bands
Aleksey Ivanov
4.67 (3)
Principles of construction of the indicator.               The Absolute Bands (AB) indicator is reminiscent of the Bollinger Bands indicator with its appearance and functions, but only more effective for trading due to the significantly smaller number of false signals issued to them. This effectiveness of the Absolute Bands indicator is due to its robust nature.               In the Bollinger Bands indicator, on both sides of the moving average - Ma, there are lines spaced from Ma by the standa
FREE
TrueChannel
Aleksey Ivanov
5 (7)
The TrueChannel   indicator shows us the true price movement channels. This indicator resembles Donchian Channel   in its appearance, but is built on the basis of completely different principles and gives (in comparison with Donchian Channel , which is better just to use to assess volatility) more adequate trading signals.              As shown in the article , the price actually moves in channels parallel to the time axis and jumps abruptly from the previous channels to the subsequ
FREE
The indicator visualizes the result of the   CalculateScientificTradePeriod    script (which, of course, also needs to be downloaded), which, firstly , estimates how many Mx bars of the active chart the future trend will most likely continue and what is its quality, and, secondly , calculates the optimal the averaging period (which is also equal to Mx) of the ScientificTrade   indicator, which gives the maximum profit according to the extremely effective   ScientificTrade strategy. For the FindS
StatChannel
Aleksey Ivanov
5 (1)
The principle of the indicator.               The StatChannel ( SC ) indicator is a development of the Bollinger Bands indicator ( ВВ ).  BB is a moving average, on both sides of which two lines are drawn, separated from it by standard deviations std multiplied by the corresponding coefficient. At the same time, a moving average with an averaging period (2n + 1) bars is always obtained lagging behind n bars.  Sliding std is also lagging behind on n bars, also calculated by (2n + 1) points. Such
Profit Trade
Aleksey Ivanov
The principle of constructing indicator lines .               Profit Trade  indicator is very effective for trading. Profit Trade  is a deep development of the well-known Donchian channel  indicator. The upper (BlueViolet color) Dup and the lower (IndianRed) Ddn lines of the indicator are constructed in the same way as in the Donchian channel , based on the highest (high of High) and lowest (low of Low) prices for the previous n1 = 20 periods. The middle line (Gold) Dm is constructed in the sam
Quality trend
Aleksey Ivanov
5 (1)
The Quality trend indicator expresses the ratio of the strength of a trend or the speed of its growth (fall) to the degree of its noisiness or a certain norm of amplitudes of chaotic fluctuations of a growing (falling) price. The position of the indicator line above zero shows an increasing trend, below zero - a falling trend, the fluctuation of the indicator line near zero shows a flat. If the indicator line begins to fluctuate rapidly around zero and approach it, then this indica
Alligator Analysis
Aleksey Ivanov
5 (1)
Indicator description.            The “ Alligator Analysis ” ( AA ) indicator allows you to build various (by averaging types and by scales) “ Alligators ” and their combinations, i.e. allows you to analyze the state of the market based on the correlation of this state with a whole range of different " Alligators ".  The classic " Alligator " by Bill Williams is based on moving averages and Fibonacci numbers, which makes it one of the best indicators now. The classic " Alligator "   is based on
FREE
Channel Builder
Aleksey Ivanov
4.75 (4)
The Channel Builder (CB) or Ivanov Bands indicator is a broad generalization of the Bollinger Bands indicator. First, in CB, the mean line <X> is calculated using various averaging algorithms. Secondly, the mean deviations calculated by Kolmogorov averaging are plotted on both sides of the middle line <X>.                The middle line <X>, besides the standard SMA, EMA, SMMA and LWMA averaging algorithms, can be Median = (Max + Min) / 2 sliding median (which is the default). In
FREE
PDP indicator is used for: defining price probability distributions. This allows for a detailed representation of the channel and its borders and forecast the probability of a price appearing at each segment of its fluctuations; defining the channel change moment. Operation principles and features PDP analyzes a quote history on lower timeframes and calculates a price probability distribution on higher ones. Forecast algorithms allow the indicator to calculate probability distributions and mov
Signal Bands
Aleksey Ivanov
Signal Bands is a sensitive and convenient indicator, which performs deep statistical processing of information. It allows to see on one chart (1) the price trend, (2) the clear price channel and (3) latent signs of trend change. The indicator can be used on charts of any periods, but it is especially useful for scalping due to its high sensitivity to the current market state. The functions of the indicator : First, the Signal Bands indicator draws channels into which all price fluctuations exa
Iterative Moving Average
Aleksey Ivanov
5 (1)
Iterative Moving Average – IMA.   IMA is obtained by correcting the usual   MA.   The correction consists in addition   to MA averaged difference between the time series (X) and its MA, i.e.   IMA(X)=MA(X) + MA ( Х -MA(X)). Correction is done in several iterations (and, exactly, 2 iterations in this indicator) and with a change in the averaging period.               As a result, the time-series points begin to cluster around (on all sides) of the getting   IMA and with a smaller de
Structure of the indicator.               The Cunning crocodile indicator consists of three moving averages (applied to the price   Median price   = (high + low)/2 ) :   1) the usual MA ( SMA , EMA , SMMA ,   LWMA )  or the mean <X> of the process X and her two generalizations 2) <XF> = <X / <X >> * <X> and 3) <XS> = <X * <X >> / <X> with the same averaging period. All three curves intersect at common points that (such an intersection in which the cunning crocodile, unlike the usual one, "never
Sensitive Signal
Aleksey Ivanov
5 (2)
The Sensitive Signal ( SS ) indicator, using the filtering methods  (which includes cluster multicurrency analysis) developed by the author, allows, with a high degree of probability, to establish the beginning of the true (filtered from interference - random price walks) trend movement. It is clear that such an indicator is very effective for trading on the currency exchange , where signals are highly distorted by random noise. The filtration developed by the author is carried out
Profit MACD
Aleksey Ivanov
5 (2)
I present an indicator for professionals. ProfitMACD is very similar to classic MACD in appearance and its functions . However, ProfitMACD is based on completely new algorithms (for example, it has only one averaging period) and is more robust, especially on small timeframes, since it filters random price walks. The classic MACD indicator (Moving Average Convergence / Divergence) is a very good indicator following the trend, based on the ratio between two moving averages, namely the EM
The principle of the indicator.               A simple moving average (SMA) with an averaging period (2n + 1) of bars is always obtained lagging by n bars. If SMA or other types of moving averages are the basis for making trading decisions, then their strong delay does not allow   to open positions in time and close positions, which leads to losses.                            The Estimation moving average without lag ( EMAWL ) indicator calculates the non-lagging moving average, which is calcula
The principle of the indicator.               The Strong Trend Flat Signal (STFS) indicator is the intersection of two, developed by the author, non-lagging moving averages with averaging periods 21 and 63.               A simple moving average (SMA) with an averaging period (2n + 1) of bars is always obtained lagging by n bars. If SMA or other types of moving averages are the basis for making trading decisions, then their strong delay does not allow  to open positions in time and close positio
StatPredict
Aleksey Ivanov
Introduction.             The indicator predicts the price in accordance with the prevailing trend  and its own small statistical price fluctuations around this trend. At the same time, in StatPredict , you need to set the time horizon of the forecasted events, which is set by the parameter settings of the “ Length of forecast in bars ” indicator and determined by the characteristic time scale of the current   trend, which is best measured by the ProfitMACD indicator or by the previous price co
Asummetry
Aleksey Ivanov
The principle of the indicator.                             The Asummetry  indicator allows you to predict the beginning of a change in the direction of trends, long before their visual appearance on the price chart.               The author statistically revealed that before changing the direction of the trend, the probability distribution function of the price is made as asymmetric as possible. More precisely, the price movement in any direction always pulls sideways the function of its dist
Indicator is used for: defining price probability distributions. This allows for a detailed representation of the channel and its borders and forecast the probability of a price appearing at each segment of its fluctuations; defining the channel change moment.   Operation principles and features Indicator analyzes a quote history on lower timeframes and calculates a price probability distribution on higher ones. Forecast algorithms allow the indicator to calculate probability distributions and m
Identify Market State
Aleksey Ivanov
5 (1)
The Identify Market State   indicator allows you to set the beginning of a new trends and pullbacks on an existing trend. This indicator can be used both for trading on scalper strategies and for long-term trading strategies.               The indicator is based on the 14 periodic DeMarker   indicator and the 8 periodic simple moving average from this indicator. Statistical studies have shown that the sharp peaks of the DeMarker   indicator curve when they drop below its minimum li
Signal Envelopes
Aleksey Ivanov
The Signal Envelopes   indicator uses the robust filtering method based on: (1) the moving median Buff0 = <Median> = (Max {x} + Min {x}) / 2 and (2) the averaging algorithm developed by the author Buff1 = <(<Median> ) ^ (- 3)> * (<Median>) ^ 4  based on the moving median. The Signal Envelopes   indicator allows you to most accurately and with the minimum possible delay set the beginning of a new trend.  The Signal Envelopes indicator can be used both for trading according to scalpe
Signal Channel
Aleksey Ivanov
The principle of constructing indicator lines and their meaning .               The Signal Channel   indicator uses a robust filtering method based on two moving medians applicable to the High and Low prices, i.e. the lines <High> and <Low>, where <..> is the sign of linear averaging, which are shifted by certain values ​​in an uptrend and by opposite values ​​in a downtrend, which allows you to get a narrow channel, approximately outlining each bar. Sharp kinks of the lines of such a channel a
Robust Filter
Aleksey Ivanov
5 (1)
The Robust filter   indicator is based on the robust filtering algorithm developed by the author using the multi-period averaged moving median. The algorithm for this averaging is shown in the last screenshot.                The indicator calculates and shows: 1. The direction of the trend; 2. Entry and exit points of positions; 3. StopLoss   lines calculated from current price probability distributions and selected probability of closing an order by StopLoss before the trend revers
Absolute price
Aleksey Ivanov
This   indicator is intended for professionals assessing fundamental market trends.  This indicator calculates the index of any instrument and analyzes it.              The index of the state currency shows the real purchasing power of this currency, and the dynamics of this index shows the dynamics of the economic state of the corresponding state. An analysis of the indices of both currencies included in a currency pair makes it much more reliable to identify the trend of this cur
The Multicurrency Trend Detector ( MTD ) indicator allows you to immediately and on one chart on a selected time interval (extending from a zero bar to a bar set in the settings by the value horizon) determine the presence, direction and strength of trends in all major currencies, as well as assess the reliability of these trends.               This is achieved by calculating indices (non-relative purchasing power) of eight major currencies, namely: AUD, CAD, CHF, EUR, GBP, JPY, NZ
StatZigZag
Aleksey Ivanov
The StatZigZag  indicator looks like a regular ZigZag , but is built on the basis of completely different algorithms. The StatZigZag  indicator is a broken line built from segments of regression lines of different lengths, the beginning of each of which comes from the end of the previous segment. Each regression segment is built until the variance or spread of price around it begins to exceed a certain critical value, after which the construction of this segment ends and the constr
Velocity of price change
Aleksey Ivanov
5 (1)
The Velocity of price change   ( VP ) indicator shows the average rate of price change at those characteristic time intervals where this rate was approximately constant. The robust algorithm used in VP   to smooth out the price from its random jumps, ensures the reliability of the indicator reading, which does not react to simple price volatility and its insignificant movements.             The indicator allows you to track trends and the moments of their reversals , during which t
필터:
Kelton Carlos Actis
1171
Kelton Carlos Actis 2022.11.16 10:47 
 

Very useful.

리뷰 답변