FZR Fractal Zigzag Reversal mql5
- 지표
- 버전: 1.0
- 활성화: 5

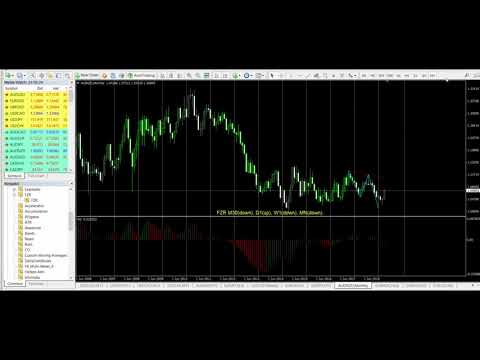
FZR indicator determines fractal zigzag reversal pattern of all the time frames of the chosen symbol and shows the information in the Info label. Indicator draws the detected pattern in the chosen time frame and also you can select in the menu to draw the trend line according to FZR peaks.
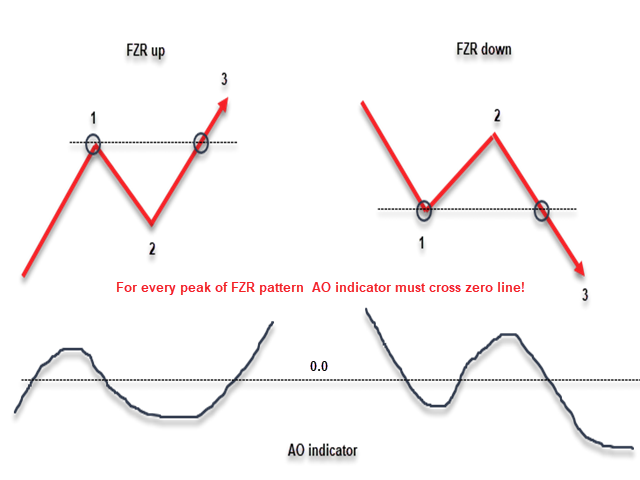
What it is FZR? See the first picture in the screenshots. As you can see for every peak of FZR the AO indicator must cross zero line. FZR indicator determines the trend direction.
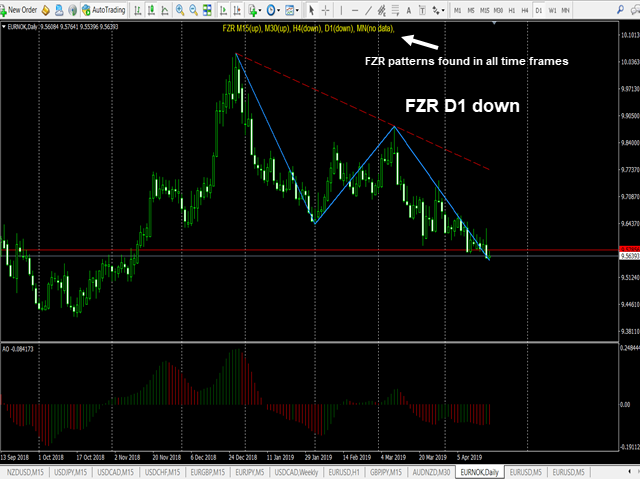
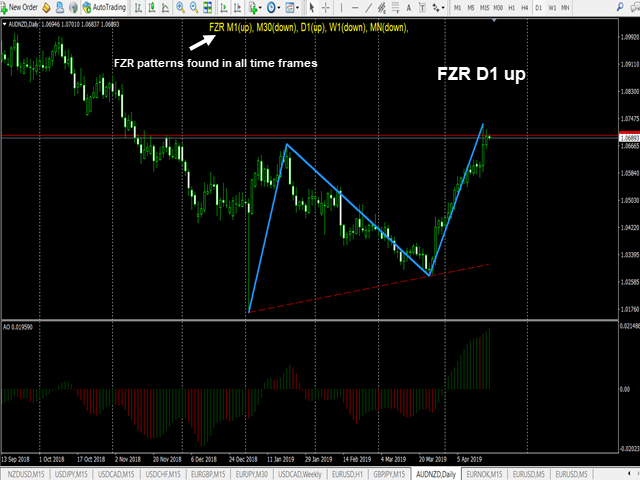
How to use FZR for trading? When FZR patern is detected and the trend line is drawn you can wait when the price approaches to the trend line and buy or sell in FZR direction. The first take profit level is the last peak of the FZR and the others can be retrieved by Fibonacci levels. Of course you must evaluate the space available for price to go.
You can choose different visualization properties of Info label and FZR or trend lines.
Parameters:
--------------Info label---------------
- Info label color
- font size for Info label
- Info label position Top or Bottom in the center of the chart
---------------FZR line---------------
- FZR line color
- FZR line width
- FZR line style
--------------Trend line---------------
- Show trendline? Yes or No to show the trend line
- Trendline color
- Trendline width
- Trendline style
Very useful indicator.