Candle Pattern Alert
- 지표
- 버전: 1.12
- 업데이트됨: 22 4월 2025
- 활성화: 5

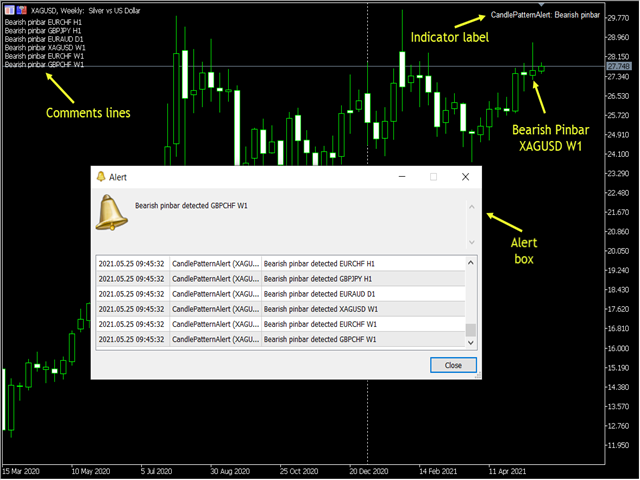
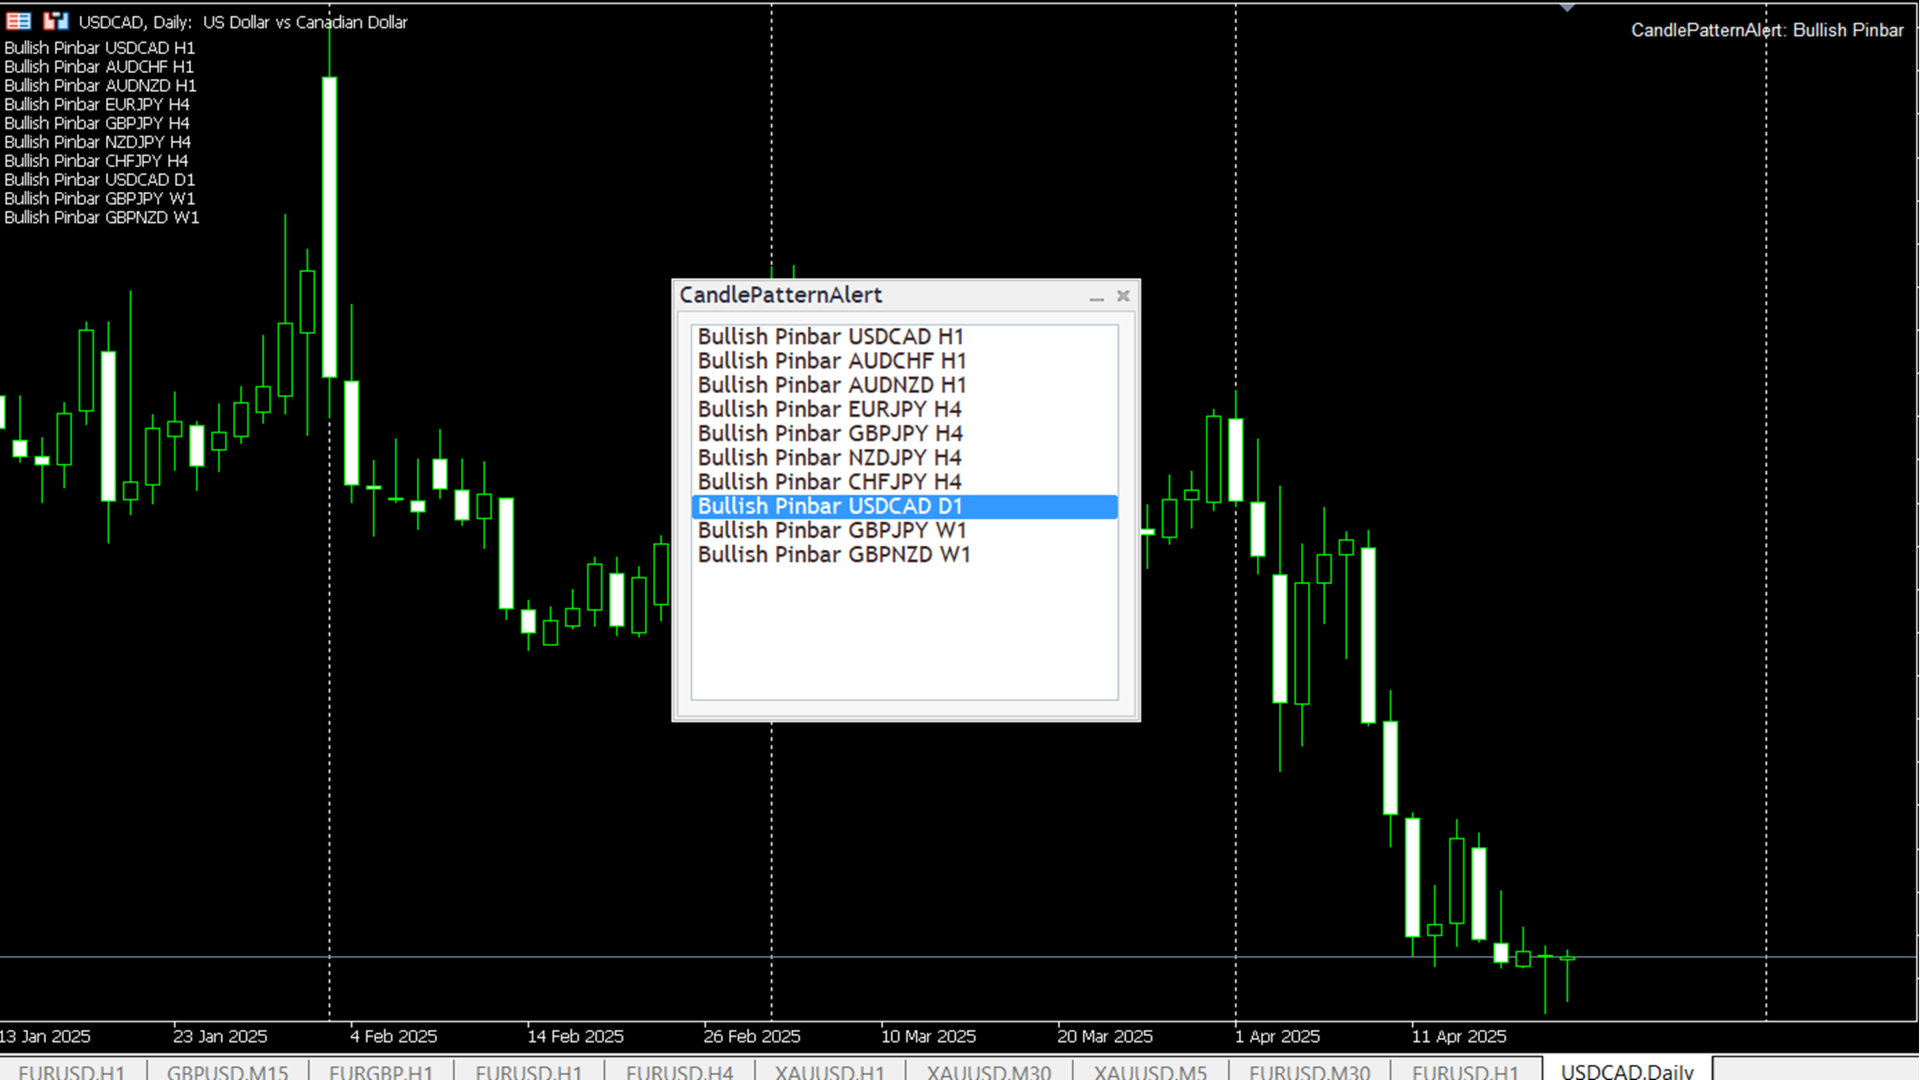
Candle Pattern Alert indicator alerts when the last price closed candle matches the set input parameters. You can choose to scan through all the symbols in Market Watch or enter your favorite symbols and also you can enter time frames you need to scan.
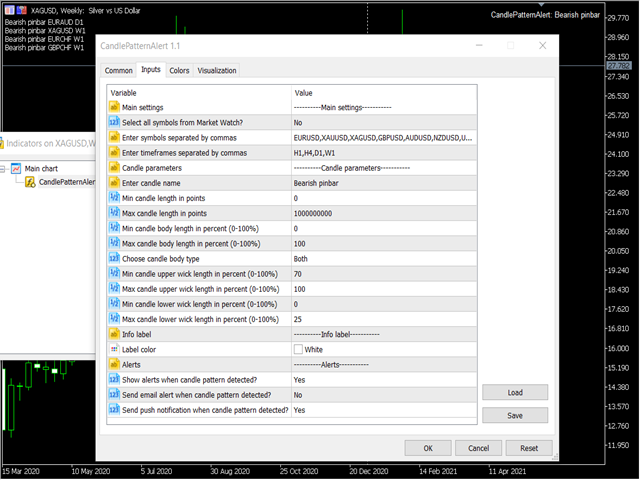
---------Main settings--------
- Select all symbols from Market Watch? - if Yes the program scans through all the symbols displayed in Market Watch, if No - only selected in next input symbols are scanned
- Enter symbols separated by commas - enter symbols separated by commas (they must be selected in Market Watch)
- Enter timeframes separated by commas - enter time frames separated by commas, e.g. M1,M2...M30,H1,H2...H12, D1,W1,MN1.
--------Candle parameters--------
- Enter candle name - enter name for candle pattern
- Min candle length in points - enter min candle length in points
- Max candle length in points - enter max candle length in points
- Min candle body length in percent (0-100%) - enter min candle body length in percent (0-100%)
- Max candle body length in percent (0-100%) - enter max candle body length in percent (0-100%)
- Choose candle body type - choose from drop down menu: bullish, bearish, both
- Min candle upper wick length in percent (0-100%) - enter min candle upper wick length in percent (0-100%)
- Max candle upper wick length in percent (0-100%) - enter max candle upper wick length in percent (0-100%)
- Min candle lower wick length in percent (0-100%) - enter min candle lower wick length in percent (0-100%)
- Max candle lower wick length in percent (0-100%) - enter max candle lower wick length in percent (0-100%)
---------Info label---------
- Label color - select color for label text (it will be seen on the right upper corner. If you don't want to see label, select color the same as background)
---------Alerts---------
- Show alerts when candle pattern detected? - choose Yes or No from dropdown menu
- Send email alert when candle pattern detected? - choose Yes or No from dropdown menu. If Yes, you need to configure your email settings in Options/Email menu
- Send push notification when candle pattern detected? - choose Yes or No from dropdown menu. If Yes, you need to set your MetaQuotes ID in Options/Notifications menu
Notes:
- The candle body and wicks length in percent are measured from total candle length
- If you push more than one Candle Pattern Indicator on one screen, than alerts will work from all indicators but information on the screen will be shown only from last one
- In testing mode you can see alerts only in Journals tab