SFP pattern mql5
- 지표
- 버전: 1.26
- 업데이트됨: 27 2월 2023
- 활성화: 5

A Swing Failure Pattern (SFP) is a trade setup in which big traders hunt stop-losses above a key swing high or below a key swing low for the purpose of generating the liquidity needed to push price in the opposite direction.
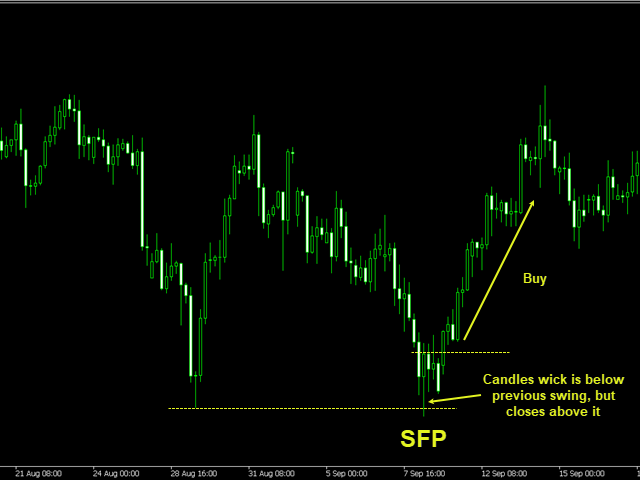
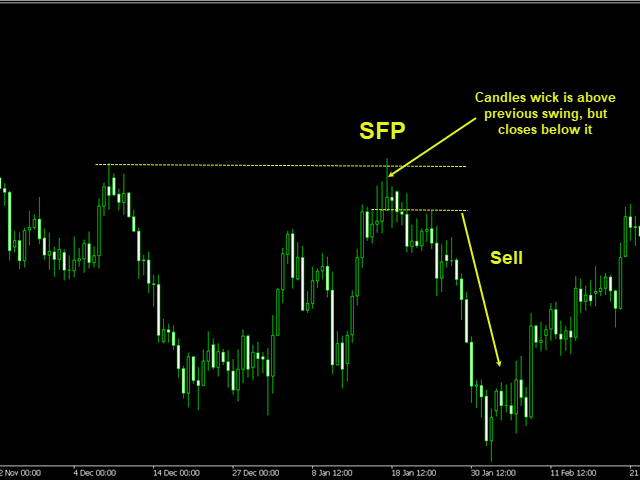
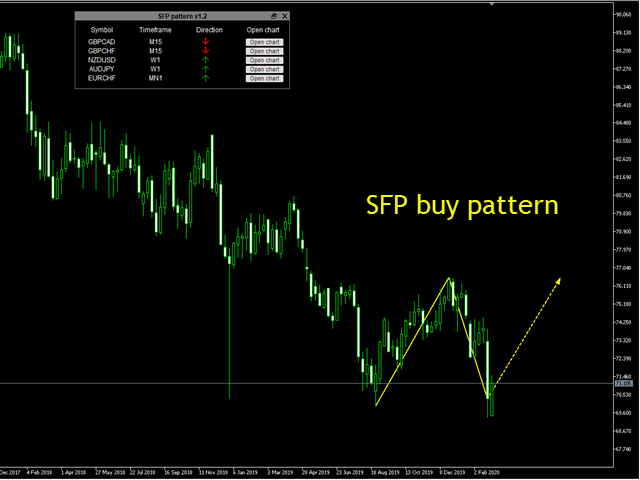
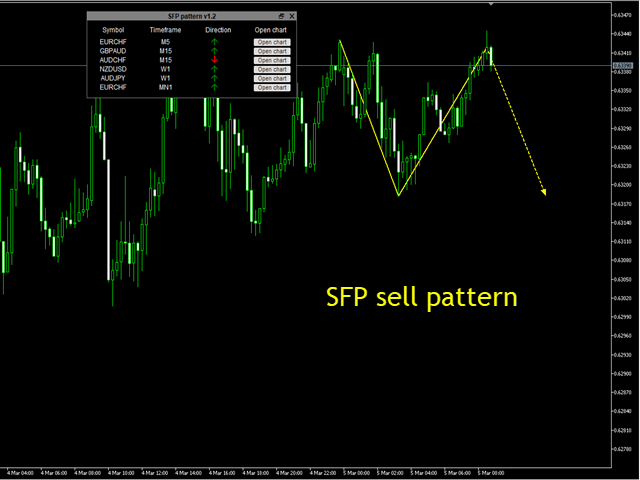
When price 1) pierces above a key swing high but then 2) closes back below that swing high, we have a potential bearish SFP. Bearish SFPs offer opportunities for short trades. When price 1) dumps below a key swing low but then 2) closes back above that swing low, we have a potential bullish SFP. Bullish SFPs offer opportunities for long trades.
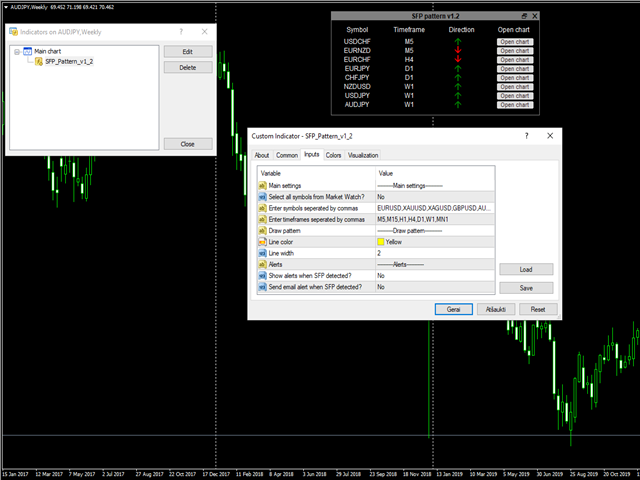
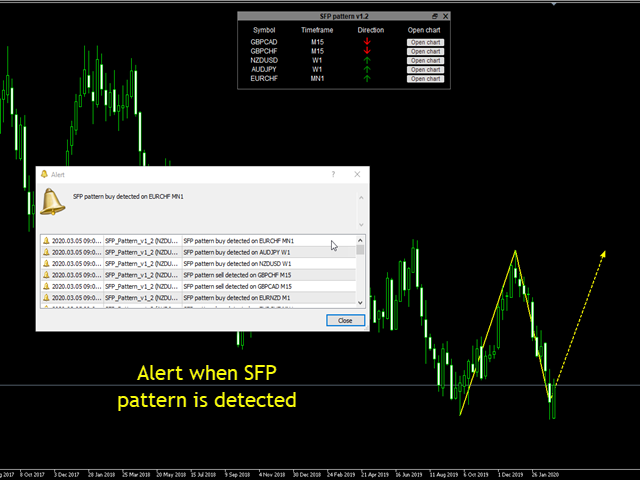
Indicator finds SFP patterns on selected symbols and time frames and depending on your choice alerts or sends an email. All information is shown in the dashboard. You can open selected chart from the table and see the drawn pattern.
---------Main settings--------
- Select all symbols from Market Watch? - if Yes the program scans through all the symbols displayed in Market Watch, if No - only selected in next input symbols are scanned
- Enter symbols separated by commas - enter symbols separated by commas (they must be selected in Market Watch)
- Enter time frames separated by commas - enter time frames separated by commas (M1,M2,..M30,H1,..H12,D1,W1,MN1)
---------Draw pattern--------
- Line color - choose the color for drawing
- Line width - enter number for line thickness
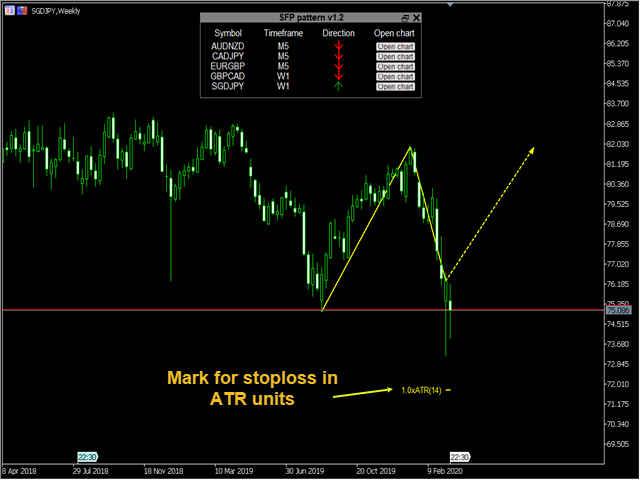
- Place mark for stop loss (in ATR units)? - choose Yes or No
- Multiplier for stop loss (in ATR units) - enter number what size for stop loss in ATR units you want
- ATR period - period for ATR indicator
-----------Alerts----------
- Show alerts when SFP detected? - choose Yes or No
- Send email alert when SFP detected? - choose Yes or No, also you have to configure your email settings in Tools/Options/Email.
Notes:
- In tester mode the patterns are drawn only for symbols and time frames of the current chart ant alerts are shown in menu's Journal tab. Also email will not be sent.