Ask Candles Indicator
- 지표
- 버전: 1.0
- 활성화: 5

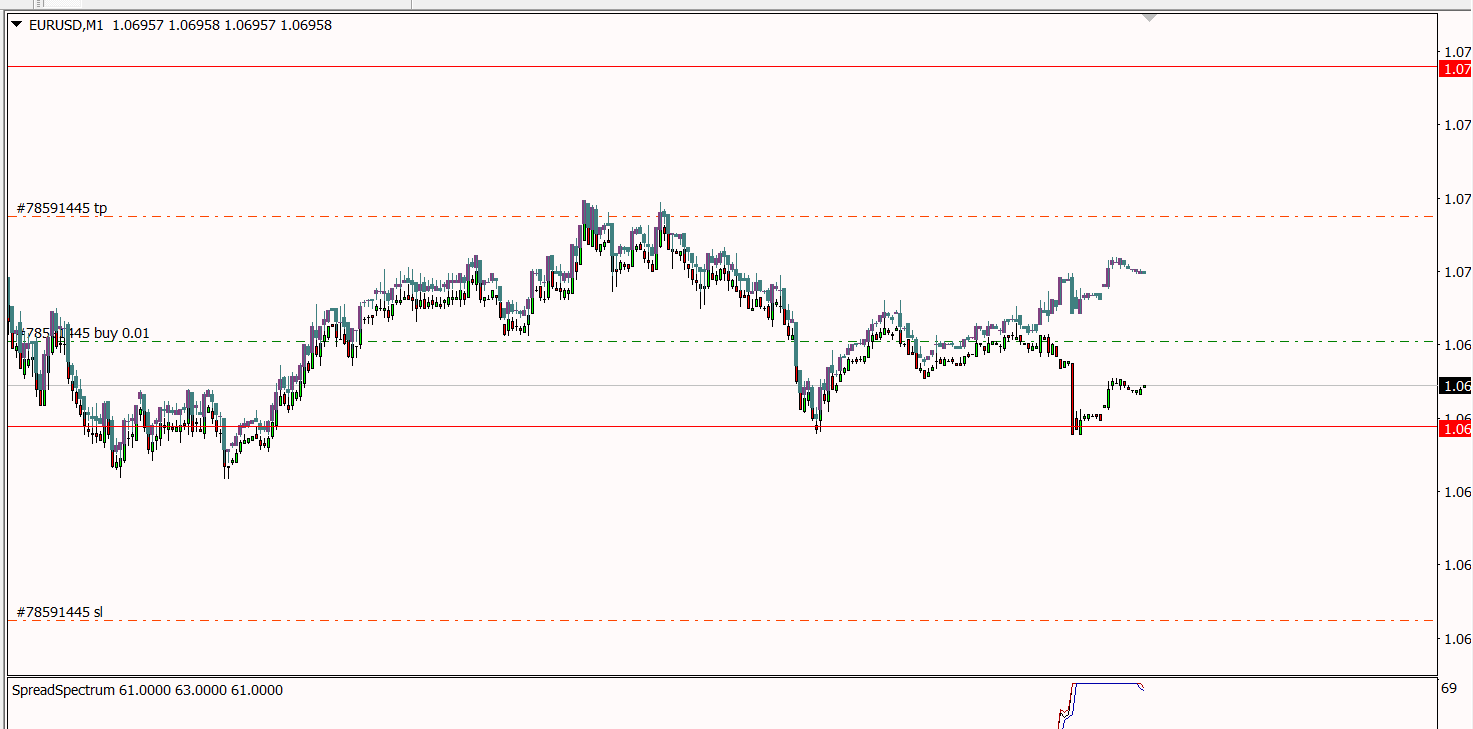
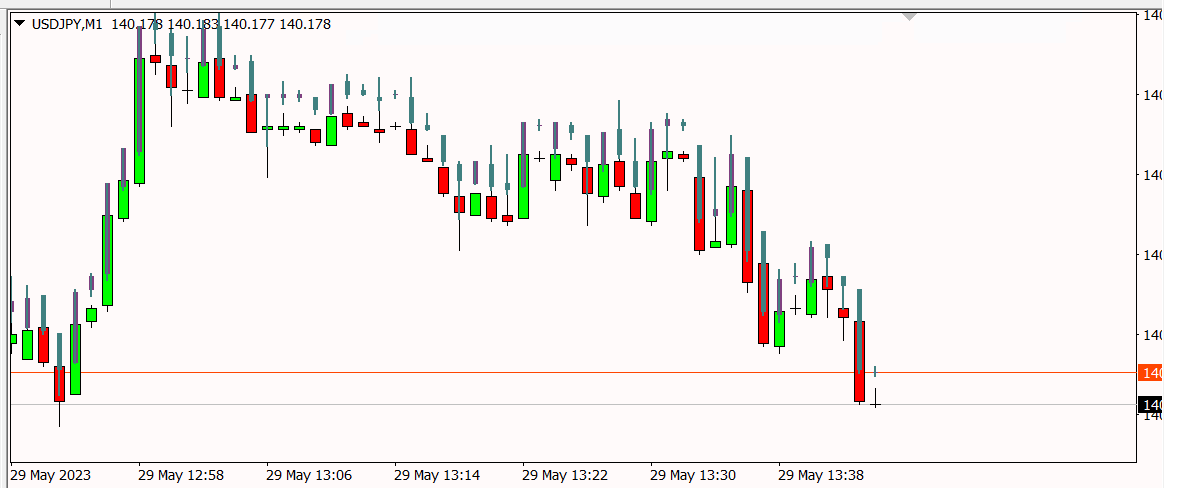
Are you tired of the uncertainty that arises when your orders fail to stop at a specific line due to the spread? Look no further! Introducing our indicator that plots candlesticks based on the Ask price instead of the traditional bid-based chart commonly used in MQL4.
With this indicator, you can say goodbye to the frustrations caused by the bid-based chart, as it provides you with a more accurate representation of market movements. By utilizing the Ask price, which represents the price at which sellers are willing to sell, you can make more informed trading decisions and avoid unexpected surprises.
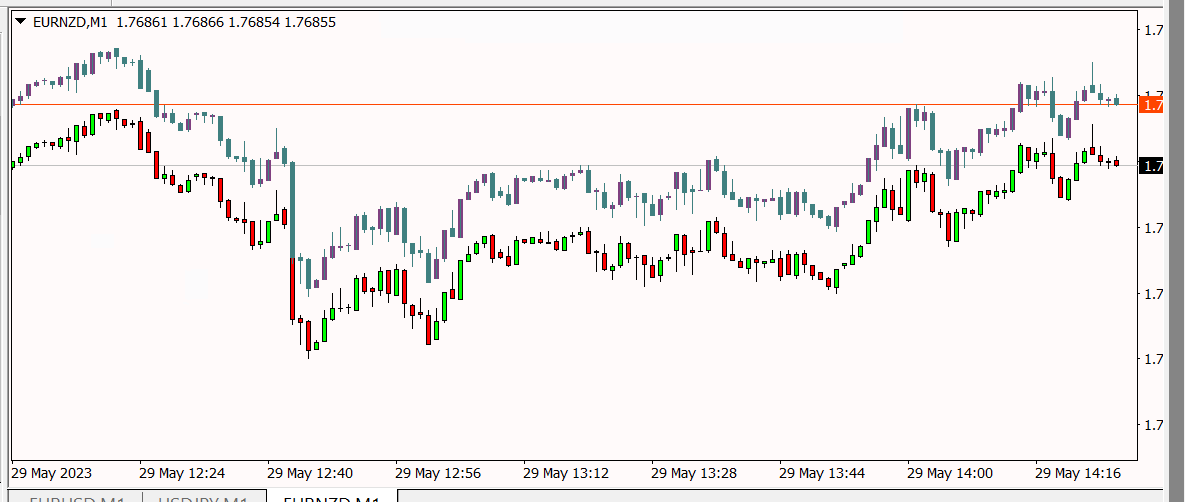
Our indicator takes into account the historical candles built using a fixed spread due to the lack of information. However, it goes a step further by constructing new candles based on the real-time live spread. This ensures that you have access to the most up-to-date and realistic view of the market, allowing you to trade with confidence.
No longer will you have to second-guess your entries and exits, wondering if the spread played a role in the outcome. Our Ask-based candlestick indicator provides you with the clarity and precision you need to navigate the markets effectively.
Don't let the spread hinder your trading success any longer. Embrace the power of our indicator and take your trading to new heights. Experience the difference firsthand and gain an edge in the markets with our Ask-based candlestick indicator.