Surge

The Surge indicator combines the features of trend indicators and oscillators.

The indicator measures the rate of price change and determines the overbought and oversold market levels.

The indicator can be used on all timeframes and is a convenient tool for detecting short-term market cycles.

The indicator uses price extremums for the previous periods and calculates the ratio between the current price and extremums.

Therefore, the only parameter is Period, which sets the number of bars to determine extremums.

The Inputs tab of the indicator allows selecting the indicator period.

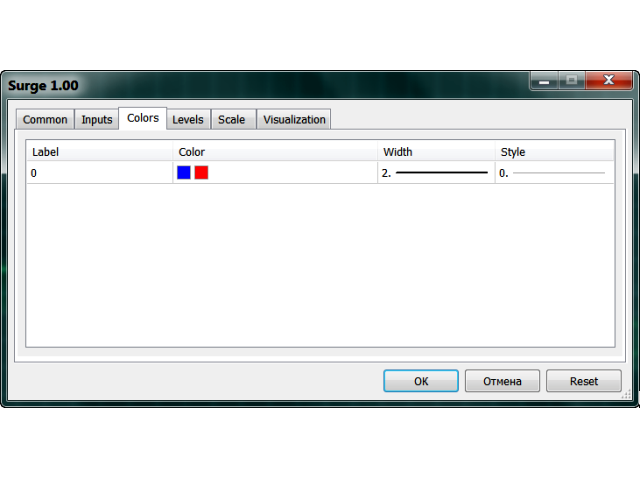
The Colors tab allows you to select the line color, width and style.


Parameters

  • period - the number of bars used for the indicator calculations.
추천 제품
Owl Smart Levels MT5
Sergey Ermolov
4.03 (32)
MT4 버전  |  FAQ Owl Smart Levels Indicator 는 Bill Williams 의 고급 프랙탈, 시장의 올바른 파동 구조를 구축하는 Valable ZigZag, 정확한 진입 수준을 표시하는 피보나치 수준과 같은 인기 있는 시장 분석 도구를 포함하는 하나의 지표 내에서 완전한 거래 시스템입니다. 시장과 이익을 취하는 장소로. 전략에 대한 자세한 설명 표시기 작업에 대한 지침 고문-거래 올빼미 도우미의 조수 개인 사용자 채팅 ->구입 후 나에게 쓰기,나는 개인 채팅에 당신을 추가하고 거기에 모든 보너스를 다운로드 할 수 있습니다 힘은 단순함에 있습니다! Owl Smart Levels 거래 시스템은 사용하기 매우 쉽기 때문에 전문가와 이제 막 시장을 연구하고 스스로 거래 전략을 선택하기 시작한 사람들 모두에게 적합합니다. 전략 및 지표에는 눈에 보이지 않는 비밀 공식 및 계산 방법이 없으며 모든 전략 지표는 공개되어 있습니다. Owl Smart Levels를 사
TRI Visualizer
Yoshimi Mon 三 Ura
TRI Visualizer MT5 – Thermodynamic Market Analysis Overview The TRI (Thermal Range Indicator) Visualizer Enhanced is a rare market analysis indicator that goes beyond conventional technical analysis, applying principles of thermodynamics from physics. It interprets market price fluctuations as “thermodynamic energy,” enabling the highly accurate detection of subtle market changes that are often overlooked. Innovative Mechanisms 1. Dual Calculation Engines Classic TRI Mode Formula: |Close
Maximum Trend Arrows OT MT5
Mulweli Valdaz Makulana
STRICTLY FOR BOOM INDEX ONLY!!!!! Here I bring the Maximum Trend Arrows OT1.0 MT5 indicator. This indicator is made up of a combination of different trend indicators for entries and exits, for entries an orange arrow will paint on the chart below the current market and a red flag for closing of trades and it produces buy arrows only. When the orange arrow appears, it will appear along with it's sound to notify you. The 1H timeframe is recommended, don't use it anywhere else than on the 1H timefr
This trading indicator is non-repainting, non-redrawing, and non-lagging, making it an ideal choice for both manual and automated trading. It is a Price Action–based system that leverages price strength and momentum to give traders a real edge in the market. With advanced filtering techniques to eliminate noise and false signals, it enhances trading accuracy and potential. By combining multiple layers of sophisticated algorithms, the indicator scans the chart in real-time and translates comple
TrendDetect
Pavel Gotkevitch
The Trend Detect indicator combines the features of both trend indicators and oscillators. This indicator is a convenient tool for detecting short-term market cycles and identifying overbought and oversold levels. A long position can be opened when the indicator starts leaving the oversold area and breaks the zero level from below. A short position can be opened when the indicator starts leaving the overbought area and breaks the zero level from above. An opposite signal of the indicator can b
PipFinite Trend PRO MT5
Karlo Wilson Vendiola
4.84 (558)
Breakthrough Solution For Trend Trading And Filtering With All Important Features Built Inside One Tool! Trend PRO's smart algorithm detects the trend, filters out market noise and gives entry signals with exit levels. The new features with enhanced rules for statistical calculation improved the overall performance of this indicator. Important Information Revealed Maximize the potential of Trend Pro, please visit www.mql5.com/en/blogs/post/713938 The Powerful Expert Advisor Version Automatin
# DRAWDOWN INDICATOR V4.0 - The Essential Tool to Master Your Trading ## Transform Your Trading with a Complete Real-Time Performance Overview In the demanding world of Forex and CFD trading, **knowing your real-time performance** isn't a luxury—it's an **absolute necessity**. The **Drawdown Indicator V4.0** is much more than a simple indicator: it's your **professional dashboard** that gives you a clear, precise, and instant view of your trading account status. --- ## Why This Indicator
우선적으로, 이 거래 도구는 전문적인 거래에 이상적인 비-다시 그리기 및 지연되지 않는 지표입니다.  온라인 강좌, 사용자 매뉴얼 및 데모. 스마트 가격 액션 컨셉트 인디케이터는 신규 및 경험 많은 트레이더 모두에게 매우 강력한 도구입니다. Inner Circle Trader Analysis 및 Smart Money Concepts Trading Strategies와 같은 고급 거래 아이디어를 결합하여 20가지 이상의 유용한 지표를 하나로 결합합니다. 이 인디케이터는 스마트 머니 컨셉트에 중점을 두어 대형 기관의 거래 방식을 제공하고 이동을 예측하는 데 도움을 줍니다.  특히 유동성 분석에 뛰어나 기관이 어떻게 거래하는지 이해하는 데 도움을 줍니다. 시장 트렌드를 예측하고 가격 변동을 신중하게 분석하는 데 탁월합니다. 귀하의 거래를 기관 전략에 맞추어 시장의 동향에 대해 더 정확한 예측을 할 수 있습니다. 이 인디케이터는 시장 구조를 분석하고 중요한 주문 블록을 식별하고 다양
GEN Fibo Nova
Gede Egi Narditya
https://www.mql5.com/en/users/gedeegi/seller FIBO NOVA is an indicator based on EMA + ATR/StdDev , forming Fibonacci volatility bands (0.618 – 2.618) to detect trend direction (uptrend/downtrend) , Entry signals , Take Profit (Rejection) , and Bounce (trend continuation) . It comes with pop-up alerts & push notifications , and a clean visual display with trend-colored zones. Quick Usage Guide Identify Trend Only Lower Bands active (green) → uptrend, focus on buy setups. Only Upper Bands active
Terra Infinity
Ivan Simonika
Terra Infinity is a flat indicator. This improved version of the CalcFlat indicator has three additional lines that significantly increase its effectiveness. Unlike its predecessor with two static levels, Terra Infinity adds three dynamic lines above the main histogram, which are interpreted as follows: base signal line, minimum signal line, maximum signal line. These lines are formed using the additional parameter Avg, which is the average value of the histogram. Averaging produces a line cl
Trend Monitor MT5
Pavel Zamoshnikov
4.5 (2)
The indicator generates early signals basing on ADX reading data combined with elements of price patterns. Works on all symbols and timeframes. The indicator does not redraw its signals. You see the same things on history and in real time. For better visual perception signals are displayed as arrows (in order not to overload the chart). Features The best results are obtained when the indicator works on two timeframes. For example: M30 – the indicator shows the main trend; M5 – the indicator gen
This indicator is used to compare the relative strength of the trade on the chart against the other several selected symbols. By comparing the price movement of each traded variety based on the same base day, several trend lines of different directions can be seen, reflecting the strong and weak relationship between the several different traded varieties, so that we can have a clearer understanding of the market trend. For example, you can apply this indicator on a EurUSD chart and compare it w
Your Trend Friend
Luigi Nunes Labigalini
5 (1)
The trend is your friend! Look at the color of the indicator and trade on that direction. It does not  repaint. After each candle is closed, that's the color of the trend. You can focus on shorter faster trends or major trends, just test what's most suitable for the symbol and timeframe you trade. Simply change the "Length" parameter and the indicator will automatically adapt. You can also change the color, thickness and style of the lines. Download and give it a try! There are big movements w
Naturu
Ivan Stefanov
5 (1)
“Naturu”는 자연의 대칭성을 알고리즘으로 활용하는 수동 인디케이터입니다. 간단한 전략과 숨겨진 지혜로 시장을 제패하세요! 인디케이터를 로드하면 위(Top)와 아래(Bottom) 두 개의 라인이 표시됩니다. 라인을 한 번 클릭해 활성화한 후, 이동하고 싶은 캔들 위를 클릭하면 그 위치로 이동합니다. 사용자가 고점과 저점을 지정하면, 인디케이터가 자동으로 계산합니다: 마젠타 색 영역: 상승(불) 세력과 하락(곰) 세력의 관심이 가장 가까워져서 지지/저항이 될 가능성이 큰 구간 회색 영역: 다음 관심 구간 아쿠아 색 실선: 상승 세력의 목표가 골드 색 실선: 하락 세력의 목표가 수동 인디케이터는 실시간 시장 상황과 개인의 직관에 따라 레벨을 자유롭게 조정할 수 있는 완전한 제어력과 유연성을 제공합니다. 직접 가격 움직임을 분석함으로써 지지·저항과 패턴 형성을 본질적으로 이해할 수 있습니다. 인간의 판단을 통해 자동 시스템이 놓치거나 오해하기 쉬운 ‘노이즈’를 걸러내어 잘못된 신호를
Stratos Pali mt5
Michela Russo
4.5 (8)
Stratos Pali Indicator is a revolutionary tool designed to enhance your trading strategy by accurately identifying market trends. This sophisticated indicator uses a unique algorithm to generate a complete histogram, which records when the trend is Long or Short. When a trend reversal occurs, an arrow appears, indicating the new direction of the trend. Important Information Revealed Leave a review and contact me via mql5 message to receive My Top 5 set files for Stratos Pali at no cost ! Down
US30NinjaMT5
Satyaseelan Shankarananda Moodley
US30 Ninja is a 5 minute scalping indicator that will let know you when there is a trade set up (buy or sell). Once the indicator gives the trade direction, you can open a trade and use a 30 pip stop loss and a 30 pip to 50 pip take profit. Please trade at own own risk. This indicator has been created solely for the US30 market and may not yield positive results on any other pair. 
ATrend
Zaha Feiz
4.82 (17)
ATREND: 작동 방식 및 사용 방법 ### 작동 방식 MT5 플랫폼을 위한 "ATREND" 지표는 기술 분석 방법론의 조합을 활용하여 트레이더에게 강력한 매수 및 매도 신호를 제공하도록 설계되었습니다. 이 지표는 주로 변동성 측정을 위해 평균 진폭 범위(ATR)를 활용하며, 잠재적인 시장 움직임을 식별하기 위한 트렌드 탐지 알고리즘과 함께 사용됩니다. 구매 후 메시지를 남기면 특별 보너스 선물을 받게 됩니다. ### 주요 특징: - 동적 트렌드 탐지: 이 지표는 시장 트렌드를 평가하고 신호를 조정하여 트레이더가 현재 시장 상황에 맞춰 전략을 조정할 수 있도록 돕습니다. - 변동성 측정: ATR을 사용하여 시장의 변동성을 측정하며, 이는 최적의 손절매(SL) 및 이익 실현(TP) 수준을 결정하는 데 중요합니다. - 신호 시각화: 이 지표는 차트에 매수 및 매도 신호를 시각적으로 표시하여 트레이더의 의사 결정을 향상시킵니다. ### 운영 단계 #### 입력 및 설정 - TimeFr
Are you tired of the uncertainty that arises when your orders fail to stop at a specific line due to the spread? Look no further! Introducing our  indicator that plots candlesticks based on the Ask price instead of the traditional bid-based chart commonly used in MQL4. With this indicator, you can say goodbye to the frustrations caused by the bid-based chart, as it provides you with a more accurate representation of market movements. By utilizing the Ask price, which represents the price at whic
VM Trend Candles
Van Minh Nguyen
VM Trend Candles Indicator - Complete Trend Trading Solution Trend Candles Indicator is a professional, intuitive, and easy-to-use Forex trading system designed to transform complex trend analysis into clear, high-probability trading signals. Based on proven trend-following principles and enhanced with intelligent market filtering, the indicator provides accurate BUY/SELL signals together with automatically calculated Stop Loss and Take Profit levels according to market volatility. The system su
Volality Index Scalper
Lesedi Oliver Seilane
5 (1)
Volality Index scalper indicator  Meant for Volality pairs such as Volality 10, 25, 50, 75 and 100 The indicator works on all timeframes from the 1 minute to the monthly timeframe the indicator is non repaint the indicator has 3 entry settings 1 color change on zero cross 2 color change on slope change 3 color change on signal line cross Orange line is your sell signal Blue line is your buy signal.
DAILY OH/OL SDEV QUANT MODEL - STATISTICAL TRADING WITH PRECISION RISK MANAGEMENT TRADE WITH MATHEMATICAL CERTAINTY - KNOW YOUR EXACT STOP-LOSS AND TAKE-PROFIT BEFORE YOU ENTER This indicator analyzes 5,000+ days of price history to give you: Exact entry levels (sigma bands locked at daily open) Exact stop-loss distance (from M
Magic Finger can help you identify trends and trading opportunities clearly. The finger points to the open position signal, and the discoloration line is confirmed by the trend. If you are a day trader, you can choose to trade during a period of active trading, referring to the discoloration line as the basis for the next order, finger signal as a filter. If you are a trend trader, you can choose a period above H1, wait for the appearance of the finger signal in the key price area, and enter th
HMA Trend Professional MT5
Pavel Zamoshnikov
4.25 (4)
Improved version of the free HMA Trend indicator (for MetaTrader 4) with statistical analysis. HMA Trend is a trend indicator based on the Hull Moving Average (HMA) with two periods. HMA with a slow period identifies the trend, while HMA with a fast period determines the short-term movements and signals in the trend direction. The main differences from the free version: Ability to predict the probability of a trend reversal using analysis of history data. Plotting statistical charts for analyzi
Oscillator trading signals - это динамический индикатор, определяющий состояние к продолжению тенденции роста или падению цены торгового инструмента и отсечению зон с нежелательной торговлей. Индикатор состоит из 2 линий осцилляторов. Медленная и быстрая сигнальная линия.  Шкала отображения перевернутая. Зоны вблизи 0 свидетельствуют о тенденции роста цены валютной пары. Зоны -100 свидетельствуют о падении цены валютной пары. На основном графике в виде стрелок отображается потенциально выгодные
Riko Trend mt5
Nadiya Mirosh
The Riko Trend indicator is a revolutionary trend trading and filtering solution with all the important features of a trend tool built into one tool! The Riko Trend indicator is good for any trader, suitable for any trader for both forex and binary options. You don’t need to configure anything, everything is perfected by time and experience, it works great during a flat and in a trend. The Riko Trend indicator is a technical analysis tool for financial markets that reflects the current price f
Alpha Trend MT5
Evgeny Belyaev
Alpha Trend MT5 is a trend indicator for the MetaTrader 5 platform; it has been developed by a group of professional traders. The Alpha Trend MT5 indicator finds the most probable tendency reversal points, which allows making trades at the very beginning of a trend. This indicator features notifications, which are generated whenever a new signal appears (alert, email, push-notification). This allows you to open a position in a timely manner. Alpha Trend does not redraw, which makes it possible t
Candle Fusion Pro
Martin Alejandro Bamonte
Candle Fusion Pro — 패턴 인식 + 추세 필터 + 모멘텀 필터 (재도색 없음) 강력한 캔들 패턴을 감지하고 실시간 추세 및 모멘텀 분석을 통해 그 신뢰도를 확인하세요. Candle Fusion Pro 는 정밀한 가격 행동 , 추세 구조 및 다중 확인 을 활용하는 트레이더들을 위한 최고의 시각적 도구입니다. 핵심 기능 패턴 기반 진입 : 10개 이상의 고급 일본식 캔들 패턴 을 감지합니다: 슈팅스타 (레벨 2, 3, 4) 강세/약세 엔골핑 모닝스타 / 이브닝스타 도지 및 도지 스타 해머 (레벨 2, 3, 4) 관통선 및 어두운 구름 덮기 재도색 없음, 지연 없음 : 화살표 및 라벨은 캔들이 닫힌 후에만 고정되어 표시됩니다. 보이는 그대로입니다 . 실시간 확인 : 추세 필터 (시간 프레임에 따라 자동 조정) RSI 강도 라벨 : 색상 표시 (초록 <30, 주황, 빨강 >70) ADX 필터 : 추세 지속 또는 횡보 상태 식별 (임계값 25): 강한 추세 = 지속 , 약
Trend Master Chart MT5
Frederic Jacques Collomb
Trend Master Chart는 귀하에게 필요한 추세 지표입니다. 차트를 오버레이하고 색상 코딩을 사용하여 다양한 시장 동향/움직임을 정의합니다. 두 개의 이동 평균과 서로 다른 오실레이터를 결합하는 알고리즘을 사용합니다. 이 세 가지 요소의 기간은 수정 가능합니다. 모든 시간대와 모든 쌍에서 작동합니다. 한 눈에 상승 또는 하락 추세와 이 추세의 다양한 진입점을 식별할 수 있습니다. 예를 들어 뚜렷한 상승 추세(밝은 녹색) 동안 이 추세 내의 다양한 시장 충동은 짙은 녹색 양초로 표시됩니다. 구성 가능한 경고를 사용하면 이러한 충동 중 하나를 놓치지 않을 수 있습니다. MT4 버전. 입력 매개변수: Period 1: 빠른 기간 이동 평균. Period 2: 느린 기간 이동 평균. Oscillator period: 오실레이터 기간. Sell/Buy alert: 시장 충동 경고, 추세 진입점. Bullish/Bearish alert: 추세 변화가 있을 경우
Universal Soul Reaper
Pieter Gerhardus Van Zyl
Universal Soul Reaper is an atmospheric market-flow oscillator designed to interpret price behavior as a cycle of spiritual energy. Instead of reacting to raw price alone, it visualizes the state of the market’s soul —revealing when momentum is awakening, stabilizing, or fading. The indicator operates in a separate window and presents three interwoven entities: the Ectoplasmic Veil , the Spirit Boundary , and the Soul Core . Together, they form a living framework that helps traders sense pressu
The RSI Divergence + FVG Signal indicator combines Relative Strength Index (RSI) Divergence with Fair Value Gap (FVG) detection to generate high-probability buy and sell signals based on both momentum shifts and institutional imbalance zones. Core Features: RSI Divergence Detection : Identifies both regular and hidden bullish/bearish divergences between price and RSI. Divergences indicate potential trend reversals or continuation. FVG Zone Recognition : Detects Fair Value Gaps (imbalances caused
이 제품의 구매자들이 또한 구매함
이 지표를 구매하면 제 프로페셔널 트레이드 매니저를 무료로 드립니다. 우선 이 거래 시스템이 리페인팅, 리드로잉 및 레이그 인디케이터가 아니라는 점을 강조하는 것이 중요합니다. 이는 수동 및 로봇 거래 모두에 이상적인 것으로 만듭니다. 온라인 강좌, 설명서 및 프리셋 다운로드. "스마트 트렌드 트레이딩 시스템 MT5"은 새로운 및 경험이 풍부한 트레이더를 위해 맞춤형으로 제작된 종합적인 거래 솔루션입니다. 10개 이상의 프리미엄 인디케이터를 결합하고 7개 이상의 견고한 거래 전략을 특징으로 하여 다양한 시장 조건에 대한 다목적 선택이 가능합니다. 트렌드 추종 전략: 효과적인 트렌드 추이를 타기 위한 정확한 진입 및 손절 관리를 제공합니다. 반전 전략: 잠재적인 트렌드 반전을 식별하여 트레이더가 범위 시장을 활용할 수 있게 합니다. 스캘핑 전략: 빠르고 정확한 데이 트레이딩 및 단기 거래를 위해 설계되었습니다. 안정성: 모든 인디케이터가 리페인팅, 리드로잉 및 레이그가 아니므로 신뢰
Divergence Bomber
Ihor Otkydach
4.9 (80)
이 지표를 구매하신 분께는 다음과 같은 혜택이 무료로 제공됩니다: 각 거래를 자동으로 관리하고, 손절/익절 수준을 설정하며, 전략 규칙에 따라 거래를 종료하는 전용 도우미 툴 "Bomber Utility" 다양한 자산에 맞게 지표를 설정할 수 있는 셋업 파일(Set Files) "최소 위험", "균형 잡힌 위험", "관망 전략" 모드로 설정 가능한 Bomber Utility의 셋업 파일 이 전략을 빠르게 설치, 설정, 시작할 수 있도록 돕는 단계별 영상 매뉴얼 주의: 위의 모든 보너스를 받기 위해서는 MQL5 개인 메시지 시스템을 통해 판매자에게 연락해 주세요. 독창적인 커스텀 지표인 “Divergence Bomber(다이버전스 봄버)”를 소개합니다. 이 지표는 MACD 다이버전스(괴리) 전략을 기반으로 한 올인원(All-in-One) 거래 시스템입니다. 이 기술 지표의 주요 목적은 가격과 MACD 지표 간의 다이버전스를 감지하고, **향후 가격이 어느 방향으로 움직일지를 알려주는
Power Candles MT5
Daniel Stein
5 (5)
Power Candles – 모든 시장을 위한 강도 기반 진입 신호 Power Candles 는 Stein Investments의 검증된 강도 분석을 가격 차트에 직접 제공합니다. 가격 움직임에만 반응하는 대신, 각 캔들은 실제 시장 강도를 기준으로 색상화되어 모멘텀 형성, 강도 가속, 명확한 추세 전환을 즉시 파악할 수 있습니다. 모든 시장을 위한 단일 로직 Power Candles는 모든 거래 심볼 에서 자동으로 작동합니다. 현재 심볼이 Forex인지 비-Forex 시장인지 자동으로 감지하여 내부적으로 적절한 강도 모델을 적용합니다. Forex 및 Gold 는 FX Power Delta 값을 사용합니다 (절대값 범위 최대 100) 지수, 크립토 및 CFD 는 IX Power Strength 값을 사용합니다 (절대값 범위 최대 50) 필요한 강도 계산은 Power Candles에 완전히 내장되어 있습니다. 캔들 색상이나 신호 로직을 위해 추가 인디케이터는 필요하지 않습니다. 가격
SuperScalp Pro
Van Minh Nguyen
5 (1)
SuperScalp Pro – 고급 다중 필터 스캘핑 인디케이터 시스템 SuperScalp Pro는 클래식 Supertrend와 여러 지능형 확인 필터를 결합한 고급 스캘핑 인디케이터 시스템입니다. 해당 인디케이터는 M1부터 H4까지 모든 타임프레임에서 효율적으로 작동하며, 특히 XAUUSD, BTCUSD 및 주요 외환 통화쌍에 적합합니다. 독립형 시스템으로 사용하거나 기존 거래 전략에 유연하게 통합할 수 있습니다. 이 인디케이터는 11개 이상의 필터를 통합하며, 빠른/느린 EMA, 추세 판별용 3개의 EMA, EMA 기울기(EMA slope), RSI, ADX, 거래량(Volume), VWAP, 볼린저 밴드 돌파(Bollinger Bands Breakout) 및 MACD 다이버전스 필터 등을 포함합니다. 스마트 캔들 필터는 캔들 종가를 확인하여 약한 신호를 제거하고, 3 EMA와 MACD 다이버전스 필터를 결합한 추세 인식 메커니즘은 더 높은 승률의 신호를 선별하는 데 도움을 줍니
Entry In The Zone and SMC Multi Timeframe 은 Smart Money Concepts(SMC)를 기반으로 개발된 실시간 시장 분석 도구입니다. 이 시스템은 트레이더가 시장 구조를 체계적으로 분석하고 전체적인 시장 방향을 더욱 명확하게 파악할 수 있도록 설계되었습니다. 시스템은 여러 시간대에서 반전 포인트(Reversal Points), 핵심 구역(Key Zones), 그리고 시장 구조(Market Structure)를 자동으로 분석하며, POI(Point of Interest), 노 리페인트(No Repaint) 신호, 자동 피보나치 레벨(Auto Fibonacci Levels)을 표시하여 되돌림(Pullback)과 반전 포인트를 정확하게 탐지할 수 있도록 돕습니다. 또한 실시간 신호와 알림을 통해 가격이 핵심 구역에 진입하거나 해당 구역에서 반전 신호가 발생하는 순간을 놓치지 않도록 보조합니다. 더불어 이 시스템은 인디케이터와 신호 시스템을 하나로
Atomic Analyst MT5
Issam Kassas
4.07 (28)
우선적으로 언급할 점은이 거래 지표가 다시 그리지 않고 지연되지 않으며 이를 통해 수동 및 로봇 거래 모두에 이상적이라는 점입니다. 사용자 매뉴얼: 설정, 입력 및 전략. Atomic Analyst는 가격의 강도와 모멘텀을 활용하여 시장에서 더 나은 이점을 찾는 PA Price Action Indicator입니다. 고급 필터를 장착하여 잡음과 거짓 신호를 제거하고 거래 잠재력을 높이는 데 도움이 됩니다. 복잡한 지표의 다중 레이어를 사용하여 Atomic Analyst는 차트를 스캔하고 복잡한 수학적 계산을 간단한 신호와 색상으로 변환하여 초보 트레이더가 이해하고 일관된 거래 결정을 내릴 수 있도록합니다. "Atomic Analyst"는 새로운 및 경험이 풍부한 트레이더를위한 종합적인 거래 솔루션입니다. 프리미엄 지표와 최고 수준의 기능을 하나의 거래 전략에 결합하여 모든 종류의 트레이더에 대한 다재다능한 선택지가되었습니다. 인트라데이 거래 및 스캘핑 전략 : 빠르고 정확한 일일
FX Power MT5 NG
Daniel Stein
5 (30)
FX Power: 통화 강세 분석으로 더 스마트한 거래 결정을 개요 FX Power 는 어떤 시장 상황에서도 주요 통화와 금의 실제 강세를 이해하기 위한 필수 도구입니다. 강한 통화를 매수하고 약한 통화를 매도함으로써 FX Power 는 거래 결정을 단순화하고 높은 확률의 기회를 발견합니다. 트렌드를 따르거나 극단적인 델타 값을 사용해 반전을 예측하고자 한다면, 이 도구는 귀하의 거래 스타일에 완벽히 적응합니다. 단순히 거래하지 말고, FX Power 로 더 스마트하게 거래하세요. 1. FX Power가 거래자에게 매우 유용한 이유 통화와 금의 실시간 강세 분석 • FX Power 는 주요 통화와 금의 상대적 강세를 계산하고 표시하여 시장 역학에 대한 명확한 통찰력을 제공합니다. • 어떤 자산이 앞서고 있고 어떤 자산이 뒤처지는지 모니터링하여 보다 현명한 거래 결정을 내릴 수 있습니다. 포괄적인 멀티 타임프레임 뷰 • 단기, 중기 및 장기 타임프레임에서 통화와 금의 강세를
Azimuth Pro
Ottaviano De Cicco
5 (1)
LAUNCH PROMO Azimuth Pro price is initially set at 299$ for the first 100 buyers. Final price will be 499$ . THE DIFFERENCE BETWEEN RETAIL AND INSTITUTIONAL ENTRIES ISN'T THE INDICATOR — IT'S THE LOCATION. Most traders enter at arbitrary price levels, chasing momentum or reacting to lagging signals. Institutions wait for price to reach structured levels where supply and demand actually shift. Azimuth Pro maps these levels automatically: swing-anchored VWAP, multi-timeframe structure lines, an
Game Changer Indicator mt5
Vasiliy Strukov
4.21 (14)
Game Changer는 모든 금융 상품에 사용하도록 설계된 혁신적인 추세 지표로, 메타트레이더를 강력한 추세 분석기로 탈바꿈시켜 줍니다. 이 지표는 재작성이나 지연 현상이 발생하지 않습니다. 모든 시간대에서 작동하며 추세 파악을 지원하고, 잠재적 반전 신호를 제공하며, 트레일링 스톱 메커니즘으로 활용되고, 신속한 시장 반응을 위한 실시간 알림을 제공합니다. 숙련된 투자자, 전문가, 또는 우위를 점하려는 초보자 등 누구나 이 도구를 통해 자신감과 원칙을 바탕으로, 그리고 근본적인 추세 역학에 대한 명확한 이해를 바탕으로 거래할 수 있습니다. 구매 후 바로 연락 주시면 개인 보너스를 드립니다! 강력한 지지선과 추세 스캐너 지표를 무료로 받으실 수 있습니다. 개인 메시지로 알려주세요 저는 텔레그램에서 EA나 특별 세트를 판매하지 않습니다. Mql5에서만 사용 가능하며, 세트 파일은 제 블로그에서만 볼 수 있습니다 . 사기꾼을 조심하시고 다른 사람에게서 세트를 구매하지 마세요 설정 추세
Smart Stop Indicator – 차트 위에서 직접 작동하는 지능형 스톱로스 시스템 개요 Smart Stop Indicator는 감이나 추측이 아닌 명확하고 체계적인 방식으로 스톱로스를 설정하고 싶은 트레이더를 위한 맞춤형 솔루션입니다. 이 도구는 클래식 프라이스 액션 논리(고점, 저점 구조)와 현대적인 브레이크아웃 인식을 결합하여 실제로 가장 논리적인 다음 스톱 레벨을 정확히 식별합니다. 추세, 박스권, 빠른 브레이크아웃 상황 등 어떤 시장에서도 인디케이터는 최적의 SL 구역과 상태(“new”, “broken”, “valid”)를 차트에 직접 표시합니다. 새로운 기능으로 SL 거리의 %ADR 표시가 추가되었습니다. 핵심 기능 자동 시장구조 기반 스톱 설정 • 시장 구조와 실시간 가격 움직임을 기반으로 의미 있는 스톱로스 레벨을 자동으로 탐지합니다. 스마트 브레이크아웃 감지 • 빠른 방향 변화나 돌파 상황에서도 불필요한 조기 스톱 조정을 강요하지 않으며 유연하게 반응합
Super Signal – Skyblade Edition 전문가용 노리페인트 / 노래그 트렌드 신호 시스템, 뛰어난 승률 제공 | MT4 / MT5용 1분, 5분, 15분과 같은 낮은 타임프레임에서 가장 좋은 성능을 보입니다. 핵심 기능: Super Signal – Skyblade Edition은 추세 매매를 위해 설계된 스마트 신호 시스템입니다. 이 시스템은 다중 필터 로직을 활용하여, 명확한 방향성과 실질적인 모멘텀이 수반된 고품질 추세만을 감지합니다. 이 시스템은   고점 또는 저점을 예측하지 않으며 , 다음 세 가지 조건이 모두 충족될 때만 신호를 발생시킵니다: 명확한 추세 방향 강화되는 모멘텀 건전한 변동성 구조 또한, 시장 세션 기반의 유동성 분석을 통해 신호의 신뢰성과 타이밍을 더욱 향상시킵니다. 신호 특성: 모든 화살표 신호는 100% 리페인트 없음 / 지연 없음 신호가 한 번 발생하면 고정되며, 깜빡이거나 사라지지 않음 차트 상의 시각적 화살표, 정보 패널, 팝업
Berma Bands
Muhammad Elbermawi
5 (7)
Berma Bands(BBs) 지표는 시장 동향을 파악하고 이를 활용하려는 트레이더에게 귀중한 도구입니다. 가격과 BBs 간의 관계를 분석함으로써 트레이더는 시장이 추세 단계인지 범위 단계인지를 분별할 수 있습니다. 자세한 내용을 알아보려면 [ Berma Home Blog ]를 방문하세요. 버마 밴드는 세 개의 뚜렷한 선으로 구성되어 있습니다. 어퍼 버마 밴드, 미들 버마 밴드, 로어 버마 밴드입니다. 이 선들은 가격 주위에 그려져 전체 추세에 대한 가격 움직임을 시각적으로 표현합니다. 이 밴드들 사이의 거리는 변동성과 잠재적인 추세 반전에 대한 통찰력을 제공할 수 있습니다. 버마 밴드 라인이 각각에서 분리될 때, 그것은 종종 시장이 횡보 또는 범위 이동 기간에 접어들고 있음을 시사합니다. 이는 명확한 방향 편향이 없음을 나타냅니다. 트레이더는 이러한 기간 동안 추세를 파악하기 어려울 수 있으며 더 명확한 추세가 나타날 때까지 기다릴 수 있습니다. 버마 밴드 라인이 단일 라인으로
Trend Screener Pro MT5
STE S.S.COMPANY
4.84 (100)
트렌드 표시기, 트렌드 트레이딩 및 필터링을 위한 획기적인 고유 솔루션, 하나의 도구 안에 내장된 모든 중요한 트렌드 기능! Forex, 상품, 암호 화폐, 지수 및 주식과 같은 모든 기호/도구에 사용할 수 있는 100% 다시 칠하지 않는 다중 시간 프레임 및 다중 통화 표시기입니다. Trend Screener는 차트에 점이 있는 화살표 추세 신호를 제공하는 효율적인 지표 추세 추종 지표입니다. 추세 분석기 표시기에서 사용할 수 있는 기능: 1. 트렌드 스캐너. 2. 최대 이익 분석이 있는 추세선. 3. 추세 통화 강도 측정기. 4. 경고가 있는 추세 반전 점. 5. 경고가 있는 강력한 추세 점. 6. 추세 화살표 Trend Screener Indicator가 있는 일일 분석 예, 일일 신호 성능...등은 여기에서 찾을 수 있습니다. 여기를 클릭하십시오. LIMITED TIME OFFER : Trend Screener Indicator는 50$ 및 평생 동안만 사용할 수 있습니다.
FX Levels MT5
Daniel Stein
5 (12)
FX Levels: 모든 시장을 위한 뛰어난 정확도의 지지와 저항 간단 요약 통화쌍, 지수, 주식, 원자재 등 어떤 시장이든 믿을 만한 지지·저항 레벨을 찾고 싶나요? FX Levels 는 전통적인 “Lighthouse” 기법과 첨단 동적 접근을 결합해, 거의 보편적인 정확성을 제공합니다. 실제 브로커 경험을 반영하고, 자동화된 일별 업데이트와 실시간 업데이트를 결합함으로써 FX Levels 는 가격 반전 포인트를 파악하고, 수익 목표를 설정하며, 자신 있게 트레이드를 관리할 수 있게 돕습니다. 지금 바로 시도해 보세요—정교한 지지/저항 분석이 어떻게 여러분의 트레이딩을 한 단계 끌어올릴 수 있는지 직접 확인하세요! 1. FX Levels가 트레이더에게 매우 유용한 이유 뛰어난 정확도의 지지·저항 존 • FX Levels 는 다양한 브로커 환경에서도 거의 동일한 존을 생성하도록 설계되어, 데이터 피드나 시간 설정 차이로 인한 불일치를 해소합니다. • 즉, 어떤 브로커를 사용하
Gold Sniper Scalper Pro
Ich Khiem Nguyen
3.5 (8)
Gold Sniper Scalper Pro는 MetaTrader 5용 전문 지표로, 트레이더가 진입 지점을 식별하고 리스크를 효과적으로 관리할 수 있도록 지원하기 위해 설계되었습니다. 이 지표는 시그널 감지 시스템, 자동 Entry/SL/TP 관리, 거래량 분석 및 실시간 성과 통계를 포함하는 포괄적인 분석 도구 세트를 제공합니다. 시스템 이해를 위한 사용자 가이드   |   기타 언어 사용자 가이드 주요 기능 시그널 감지 시스템 지표는 Price Action 분석 및 시장 구조를 기반으로 잠재적 진입 지점을 자동으로 감지합니다. 거래 기회 감지 시: - BUY 화살표(녹색) 또는 SELL 화살표(빨간색)가 차트에 표시됩니다 - 캔들이 색상으로 표시되어 시그널 영역을 식별합니다 - Entry/SL/TP 레벨이 자동으로 계산됩니다 시그널은 가격이 Entry 레벨에 도달할 때만 활성화되어, 시장에서 확인되지 않은 시그널을 필터링합니다. 지능형 Entry/SL/TP 관리 - Ent
AriX
Temirlan Kdyrkhan
1 (4)
AriX Indicator for MT5 A powerful trend-following and signal-evaluation tool AriX is a custom MT5 indicator that combines Moving Averages and ATR-based risk/reward logic to generate clear buy/sell signals. It visualizes dynamic SL/TP levels, evaluates past trade outcomes, and displays win/loss statistics in a clean on-chart panel. Key features include: Buy/Sell signals based on MA crossovers ATR-based SL/TP1/TP2/TP3 levels with visual lines and labels Signal outcome tracking with real-time stat
TPSproTREND PrO MT5
Roman Podpora
4.74 (19)
TPSproTrend PRO는 시장이 실제로 방향을 바꾸는 순간을 포착하여 움직임의 시작점에서 진입점을 형성합니다. 가격이 움직이기 시작할 때 시장에 진입해야 하며, 이미 가격 변동이 일어난 후에 진입해서는 안 됩니다.   (지표)       신호를 다시 그리지 않고 진입점, 손절매, 이익실현을 자동으로 표시하여 거래를 명확하고 시각적이며 체계적으로 만들어줍니다. 설명서 (러시아어)   -   MT4 버전 주요 장점 신호 재표시 없이 신호가 표시됩니다.   모든 신호는 고정되어 있습니다. 화살표가 나타나면 -       그것은 더 이상 변하거나 사라지지 않을 것입니다. 잘못된 신호의 위험 없이 안정적인 데이터를 기반으로 거래 결정을 내릴 수 있습니다. 바로 사용 가능한 매수/매도 진입점 이 지표는 거래 진입에 가장 적합한 시점을 자동으로 판단하여 차트에 화살표로 표시합니다. 추측이나 주관적인 분석이 아닌, 명확한 신호만 있습니다. 자동 손절매 및 이익실현 영역 신호 직후에 다음
PZ Swing Trading MT5
PZ TRADING SLU
5 (5)
Protect against whipsaws: revolutionize your swing trading approach Swing Trading is the first indicator designed to detect swings in the direction of the trend and possible reversal swings. It uses the baseline swing trading approach, widely described in trading literature. The indicator studies several price and time vectors to track the aggregate trend direction and detects situations in which the market is oversold or overbought and ready to correct. [ Installation Guide | Update Guide | Tro
FX Dynamic MT5
Daniel Stein
5 (5)
FX Dynamic: 맞춤형 ATR 분석으로 변동성과 트렌드를 파악하세요 개요 FX Dynamic 는 Average True Range(ATR) 계산을 활용하여 트레이더에게 일간 및 일중 변동성에 대한 뛰어난 인사이트를 제공하는 강력한 도구입니다. 80%, 100%, 130%와 같은 명확한 변동성 임계값을 설정함으로써 시장이 평소 범위를 초과할 때 빠르게 경고를 받고, 유망한 수익 기회를 재빨리 식별할 수 있습니다. FX Dynamic 는 브로커의 시간대를 인식하거나 수동으로 조정할 수 있으며, 변동성 측정 기준을 일관되게 유지하며, MetaTrader 플랫폼과 완벽하게 연동되어 실시간 분석을 지원합니다. 1. FX Dynamic이 트레이더에게 매우 유용한 이유 실시간 ATR 인사이트 • 하루 및 일중 변동성을 한눈에 모니터링하세요. ATR의 80%, 100%, 130% 임계값이 도달 또는 초과되면, 시장의 중요한 지점에 있음을 알 수 있습니다. • 변동성이 완전히 폭발하기
M1 Scalper Pro MT5
Elif Kaya
4.64 (11)
- Real price is 80$ - 45% Discount (It is 45$ now) Contact me for extra bonus   indicator, instruction or any questions! - Lifetime update free - Non-repaint - Related product: Gann Gold EA - I just sell my products in Elif Kaya Profile, any other websites are stolen old versions, So no any new updates or support. Advantages of  M1 Scalper Pro  Profitability: M1 Scalper Pro is highly profitable with a strict exit strategy. Frequent Opportunities: M1 Scalper Pro  takes advantage of numerous smal
Trend Forecaster
Alexey Minkov
5 (7)
The Trend Forecaster indicator utilizes a unique proprietary algorithm to determine entry points for a breakout trading strategy. The indicator identifies price clusters, analyzes price movement near levels, and provides a signal when the price breaks through a level. The Trend Forecaster indicator is suitable for all financial assets, including currencies (Forex), metals, stocks, indices, and cryptocurrencies. You can also adjust the indicator to work on any time frames, although it is recommen
무료 AUX 인디케이터와 EA 지원을 받으세요 직접 다운로드 — 여기를 클릭 [ D.I.C.E ] The DICE Indicator  Divergence in Chaos Environment는 엘리엇 파동 이론과 트레이딩 카오스 기법을 함께 사용하는 트레이더를 위해 설계된 MT5 전문 도구입니다. 가격 움직임의 숨겨진 및 일반 다이버전스를 감지하며, 빌 윌리엄스가 설명한 혼돈 시장 환경과 동기화됩니다. 주요 특징 엘리엇 파동 정렬 다이버전스: 파동 구조에 조화된 강세 및 약세 다이버전스를 탐지하여 파동 카운팅 정확도를 높입니다. 카오스 기법 통합: AO(오썸 오실레이터) 및 시장 구조 원칙과 일치하도록 설계되었습니다. 다중 타임프레임 스캐닝: 다양한 시간 프레임에서 다이버전스를 분석하여 모멘텀 변화와 추세 소진을 확인합니다. 시각적 알림 및 객체: 명확한 화살표, 선, 표시로 빠른 인식 가능. 적응형 시장 판독: 혼돈 시장 조건에 자동으로 조정되어 노이즈를 필터링하고 유효한 셋업만
Advanced Supply Demand MT5
Bernhard Schweigert
4.5 (14)
현재 33% 할인! 초보자나 전문 트레이더를 위한 최고의 솔루션! 이 보조지표는 우리가 다수의 독창적 기능과 새로운 공식을 통합한 독특하고 고품질이며 저렴한 거래 도구입니다. 이 업데이트를 통해 이중 시간대를 표시할 수 있습니다. 더 높은 TF를 표시할 수 있을 뿐만 아니라 차트 TF와 더 높은 TF 모두를 표시할 수 있습니다: 중첩 영역 표시. 모든 Supply Demand 트레이더들이 좋아할 것입니다. :) 중요한 정보 공개 Advanced Supply Demand의 잠재력을 극대화하려면 다음을 방문하십시오. https://www.mql5.com/ko/blogs/post/720245   진입 또는 목표의 명확한 트리거 포인트를 정확히 찾아냄으로 해서 거래가 어떻게 개선될지 상상해 보십시오. 새로운 알고리즘을 기반으로 매수자와 매도자 간의 잠재적인 불균형을 훨씬 더 쉽게 분간할 수 있습니다. 왜냐하면 가장 강한 공급영역과 가장 강한 수요 영역과 과거에 어떻게 진행 되었는지를(이전
Grabber System MT5
Ihor Otkydach
4.82 (22)
탁월한 기술적 지표인 Grabber를 소개합니다. 이 도구는 즉시 사용 가능한 “올인원(All-Inclusive)” 트레이딩 전략으로 작동합니다. 하나의 코드 안에 강력한 시장 기술 분석 도구, 매매 신호(화살표), 알림 기능, 푸시 알림이 통합되어 있습니다. 이 인디케이터를 구매하신 모든 분들께는 다음의 항목이 무료로 제공됩니다: Grabber 유틸리티: 오픈 포지션을 자동으로 관리하는 도구 단계별 영상 매뉴얼: 설치, 설정, 그리고 실제 거래 방법을 안내 맞춤형 세트 파일: 인디케이터를 빠르게 자동 설정하여 최고의 성과를 낼 수 있도록 도와줍니다 다른 전략은 이제 잊어버리세요! Grabber만이 여러분을 새로운 트레이딩의 정점으로 이끌어 줄 수 있습니다. Grabber 전략의 주요 특징: 거래 시간 프레임: M5부터 H4까지 거래 가능한 자산: 어떤 자산이든 사용 가능하지만, 제가 직접 테스트한 종목들을 추천드립니다 (GBPUSD, GBPCAD, GBPCHF, AUDCAD, AU
IX Power MT5
Daniel Stein
4.92 (12)
IX Power: 지수, 원자재, 암호화폐 및 외환 시장 통찰력을 발견하세요 개요 IX Power 는 지수, 원자재, 암호화폐 및 외환 시장의 강도를 분석할 수 있는 다목적 도구입니다. FX Power 는 모든 가용 통화 쌍 데이터를 사용하여 외환 쌍에 대해 가장 높은 정확도를 제공하는 반면, IX Power 는 기초 자산 시장 데이터에만 초점을 맞춥니다. 이로 인해 IX Power 는 비외환 시장에 이상적이며, 다중 쌍 분석이 필요하지 않은 간단한 외환 분석에도 신뢰할 수 있는 도구입니다. 모든 차트에서 매끄럽게 작동하며, 거래 결정을 향상시키기 위한 명확하고 실행 가능한 통찰력을 제공합니다. 1. IX Power가 트레이더에게 유용한 이유 다양한 시장 강도 분석 • IX Power 는 지수, 원자재, 암호화폐 및 외환 심볼의 강도를 계산하여 각 시장에 맞는 통찰력을 제공합니다. • US30, WTI, 금, 비트코인 또는 통화 쌍과 같은 자산을 모니터링하여 거래 기회를 발견
Trend indicator AI mt5
Ramil Minniakhmetov
5 (13)
트렌드 인공 지능 지표는 실행 가능한 진입 점 및 반전 경고와 추세 식별을 결합하여 상인의 시장 분석을 향상시킬 훌륭한 도구입니다. 이 표시기는 사용자가 자신감과 정밀도로 외환 시장의 복잡성을 탐색 할 수 있도록 지원합니다 기본 신호 외에도 트렌드 인공 지능 지표는 풀백 또는 되돌림 중에 발생하는 2 차 진입 점을 식별하여 거래자가 기존 트렌드 내에서 가격 수정을 활용할 수 있도록합니다. 중요한 장점: ·작동 4 및 5 *명확한 구매 또는 판매 신호 *다시 칠하지 않습니다 *모든 자산에서 작동 나는 전보 사기에 개 또는 세트를 판매하지 않도록주의. 모든 설정은 블로그에 여기에 무료.  중요! 지침 및 보너스를 얻기 위해 구입 후 즉시 저에게 연락! 진짜 가동 감시는 뿐 아니라 나의 다른 제품 여기에서 찾아낼 수 있습니다: https://www.mql5.com/en/users/mechanic/seller&nbsp ; 설정 및 입력: 모든 자산에 대해 기본 설정을 권
Market Structure Patterns
Samuel Manoel De Souza
4.47 (19)
Available for   MT4   and   MT5 . Join the Market Structure Patterns channel to download materials available for study and/or additional informations. Related posts: Market Structure Patterns - Introdução Market Structure Patterns   is an indicator based on   smart money concepts   that displays   SMC/ICT   elements that can take your trading decisions to the next level. Take advantage of the   alerts ,   push notifications   and   email messages   to keep informed from when an element is form
Spike Detector XTREEM
Nervada Emeule Adams
5 (1)
Spike Detector XTREEM – Boom, Crash 및 Pain/Gain 시장을 위한 정밀 스파이크 감지 Spike Detector XTREEM은 빠르게 변하는 합성 지수 시장에 전문 수준의 스파이크 분석을 제공합니다. 모든 가격 변동에 반응하는 대신, 이 지표는 지능형 필터링을 통해 실제 스파이크 형성을 식별하여, 모멘텀이 중요한 순간에 자신 있게 거래에 진입할 수 있도록 합니다. 이 지표를 구매하면 Histogram Trend 지표를 무료 로 드립니다! 합성 지수 전용 단일 로직 Spike Detector XTREEM은 다음 시장의 고유한 특성에 맞게 특별히 설계되었습니다: Boom 및 Crash 지수 (모든 변형) Weltrade Pain & Gain 시장 이 지표는 심볼의 행동 패턴에 자동으로 적응하며, 시장의 노이즈를 걸러내고 통계적으로 유의미한 스파이크 형성만을 집중적으로 표시합니다. 수동 조정이 필요하지 않습니다. 신호 과부하 대신 스마트 필터링 모든 잠재
AW Trend Predictor MT5
AW Trading Software Limited
4.76 (54)
하나의 시스템에서 추세와 고장 수준의 조합입니다. 고급 지표 알고리즘은 시장 노이즈를 필터링하고 추세, 진입점 및 가능한 출구 수준을 결정합니다. 표시기 신호는 통계 모듈에 기록되어 가장 적합한 도구를 선택하여 신호 기록의 효율성을 보여줍니다. 이 표시기는 이익 실현 및 손절매 표시를 계산합니다. 매뉴얼 및 지침 ->   HERE   / MT4 버전 ->   HERE 지표로 거래하는 방법: Trend Predictor로 거래하는 것은 3단계로 간단합니다. 1단계 - 포지션 열기 70% 이상의 성공률로 매수 신호를 받았습니다. 2단계 - StopLoss 결정 반대 신호로 트렁크 선택 3단계 - 이익 실현 전략 정의 전략 1: TP1 도달 시 전체 포지션 청산 전략 2: TP1 도달 시 포지션의 50% 청산 및 TP2 도달 시 나머지 50% 청산 전략 3: 추세 반전 시 전체 포지션 청산 이익: 결과를 다시 그리지 않음, 신호는 엄격하게 양초가 닫힐 때 어드바이저에서 사용할 수 있습니
The Super Arrow Indicator provides non-repainting buy and sell signals with exceptional accuracy. Key Features No repainting – confirmed signals remain fixed Clear visual arrows: green for buy, red for sell Real-time alerts via pop-up, sound, and optional email Clean chart view with no unnecessary clutter Works on all markets: Forex, gold, oil, indices, crypto Adjustable Parameters TimeFrame Default:   "current time frame" Function:   Sets the time frame for indicator calculation Options:   Can
제작자의 제품 더 보기
Bulls Power Mod
Pavel Gotkevitch
3 (1)
Only Exponential Moving Average at Close Price is used in standard Bulls Power limiting the possibilities of that indicator to some extent. Bulls Power Mod enables you to select from four Moving Averages and seven applied prices, thus greatly expanding the indicator's functionality.
FREE
DeMarker Mod
Pavel Gotkevitch
4 (2)
В стандартном индикаторе DeMarker используется простая скользящая средняя - Simple Moving Average, что несколько ограничивает возможности этого индикатора. В представленном индикаторе DeMarker Mod добавлен выбор из четырех скользящих средних - Simple, Exponential, Smoothed, Linear weighted, что позволяет существенно расширить возможности данного индикатора.   Параметры стандартного индикатора DeMarker: ·         period  - количество баров, используемых для расчета индикатора;   Параметры индикат
FREE
MAPC
Pavel Gotkevitch
3 (1)
MAPC (Moving Average Percent's Change) shows the Moving Average's percent change from one period to another selected period allowing you to track the smoothed price change rate. MAPC is calculated according to the following equation: MAPC[i] = 100 * (MA[i] - MA[i - n]) / MA[i],  where: MA[i] - current Moving Average value;   MA[i - n] - value of the Moving Average that is n periods away from the current Moving Average value. Input Parameters Period - Moving Average period; Method - smoothing me
FREE
Bears Power Mod
Pavel Gotkevitch
3 (1)
Only Exponential Moving Average at Close Price is used in standard Bears Power limiting the possibilities of that indicator to some extent. Bears Power Mod enables you to select from four Moving Averages and seven applied prices, thus greatly expanding the indicator's functionality.
FREE
Support & Resistance indicator is a modification of the standard Bill Williams' Fractals indicator. The indicator works on any timeframes. It displays support and resistance levels on the chart and allows setting stop loss and take profit levels (you can check the exact value by putting the mouse cursor over the level). Blue dashed lines are support level. Red dashed lines are resistance levels. If you want, you can change the style and color of these lines. If the price approaches a support lev
MA Crossing
Pavel Gotkevitch
MA Crossing displays two moving averages on the chart painting their crossing points in different colors - blue (buy) and red (sell). The indicator clearly defines the trend direction and power and simplifies the perception of market signals. The indicator may be useful in the strategies involving two moving averages' crossing method. The indicator's input parameters allow you to select the following settings for each moving average: period (Fast Period, Slow Period); smoothing period (Simple, E
Vates
Pavel Gotkevitch
4.2 (5)
Vates is a Latin word meaning a prophet. Vates is a multicurrency trend Expert Advisor that can run on any type real accounts, on any timeframe, with any initial deposit, with a fixed or varying lot size, with four and five-digit quotes, with brokers offering different order filling types. A distinctive feature of the EA is its stability and reliability. The results of Expert Advisor testing in the Strategy Tester in four modes (two main modes – normal and with a delay, and two additional modes
Grab
Pavel Gotkevitch
The Grab indicator combines the features of both trend indicators and oscillators. This indicator is a convenient tool for detecting short-term market cycles and identifying overbought and oversold levels. A long position can be opened when the indicator starts leaving the oversold area and breaks the zero level from below. A short position can be opened when the indicator starts leaving the overbought area and breaks the zero level from above. An opposite signal of the indicator can be used for
CCI Modified
Pavel Gotkevitch
The standard Commodity Channel Index (CCI) indicator uses a Simple Moving Average, which somewhat limits capabilities of this indicator. The presented CCI Modified indicator features a selection of four moving averages - Simple, Exponential, Smoothed, Linear weighted, which allows to significantly extend the capabilities of this indicator. Parameter of the standard Commodity Channel Index (CCI) indicator period - the number of bars used for the indicator calculations; apply to - selection from
Unda
Pavel Gotkevitch
The Unda indicator determines the trend direction and strength, as well as signals about trend changes. The indicator uses price extremums for the previous periods and calculates the ratio between the current price and extremums. Therefore, the only parameter is Period (default = 13), which sets the number of bars to determine extremums. The higher the Period, the less the number of signals about trend changes, but the greater the indicator delay. Uptrends are shown by blue color of the indicato
K Channel
Pavel Gotkevitch
K_Channel is a technical indicator defining the current Forex market status - trend or flat. The indicator works on any timeframe. H1 and higher timeframes are recommended though to minimize false signals. The indicator is displayed as lines above and below EMA. Average True Range (ATR) is used as bands' width. Therefore, the channel is based on volatility. This version allows you to change all the parameters of the main Moving Average. Unlike Bollinger Bands that applies the standard deviation
D Channel
Pavel Gotkevitch
D-Channel is a technical indicator defining the current Forex market status - trend or flat. The indicator is based on DEMA (Double Exponential Moving Average). The advantage of DEMA is that it eliminates false signals at the saw-toothed price movement and allows saving a position at a strong trend. The indicator can work on any timeframe, though H1 and higher timeframes are recommended to minimize false signals. The indicator displays a channel as lines located above and below the average line.
Stips
Pavel Gotkevitch
Stips is a histogram indicator that determines trend direction and strength, as well as trend changes. The indicator can be used as a normal oscillator, i.e. analyze its trend change signals (crossing the zero line), as well as divergence and exit from overbought and oversold zones. The indicator uses extreme prices of previous periods and calculates the ratio between the current price and extreme values. Therefore its only parameter is Period (default is 13), which sets the number of bars to de
F Channel
Pavel Gotkevitch
F-Channel is a technical indicator defining the current Forex market status - trend or flat. The indicator is based on FRAMA (Fractal Adaptive Moving Average). The FRAMA follows strong trend movements and slows down significantly during price consolidation. The indicator is able to work on any timeframes, but H1 and higher timeframes are recommended to minimize false signals. The indicator displays a channel as lines located above and below the middle line. The upper and lower lines can serve as
Labor
Pavel Gotkevitch
Labor is a technical analysis indicator defining trend direction and power, as well as signaling a trend change. The indicator is based on a modified EMA (Exponential Moving Average) with an additional smoothing filter. The indicator works on any timeframe. The uptrend is shown as a blue line, while a downtrend - as a red one. Close a short position and open a long one if the line color changes from red to blue. Close a long position and open a short one if the line color changes from blue to re
P Channel
Pavel Gotkevitch
P-Channel is a technical indicator determining the current Forex market status - trend or flat. The indicator is able to work on any timeframes, but H1 and higher timeframes are recommended to minimize false signals. The indicator displays a channel as lines located above and below the middle line. The upper and lower lines can serve as the resistance and support levels. Sell when the price reaches the upper line, and buy when the price reaches the lower line. It is recommended to use a small st
FRAMA Crossing
Pavel Gotkevitch
The FRAMA Crossing indicator displays on a chart two FRAMAs (Fractal Adaptive Moving Average) and paints their crossing areas in different colors – blue (buy) and red (sell). FRAMA follows strong trend movements and slows down significantly during price consolidation. The indicator clearly defines the trend direction and power and simplifies the perception of market signals. The indicator can work on any timeframes may be useful in the strategies involving two moving averages' crossing method. T
CCI Crossing
Pavel Gotkevitch
The CCI Crossing indicator displays the intersection of two CCI (Commodity Channel Index) indicators - fast and slow - in a separate window. The intersection area is filled in blue, when the fast CCI is above the slow CCI. The intersection area is filled in red, when the fast CCI is below the slow CCI. This indicator is a convenient tool for measuring the deviations of the current price from the statistically average price and identifying overbought and oversold levels. The indicator can work on
Dash
Pavel Gotkevitch
Dash is a histogram indicator, which measures the rate of price change and determines the overbought and oversold levels. The indicator uses price extremums for the previous periods and calculates the ratio between the current price and extremums. Therefore, the only parameter is Period , which sets the number of bars to determine extremums. A long position can be opened when the red lines of the indicator start leaving the oversold area and break the -1 level upwards. A short position can be op
DEMA Crossing
Pavel Gotkevitch
The DEMA Crossing indicator displays the intersection of two DEMA (Double Exponential Moving Average) - fast and slow. The intersection area is filled in blue, when the fast DEMA is above the slow DEMA. The intersection area is filled in red, when the fast DEMA is below the slow DEMA. The advantage of the DEMA moving average is that it eliminates false signals at the saw-toothed price movement and allows saving a position at a strong trend. The indicator clearly defines the trend direction and p
Trend Sight
Pavel Gotkevitch
The Trend Sight indicator shows the Moving Average's percent change from the current bar to the other selected bar allowing you to track the smoothed price change rate, as well as trend strength and change. The uptrend is shown as a blue indicator line, while a downtrend is displayed in red. Close a short position and open a long one if the line color changes from red to blue. Close a long position and open a short one if the line color changes from blue to red. You should use a tight stop loss,
Trend Sign
Pavel Gotkevitch
The Trend Sign indicator is a modification of the MACD indicator (Moving Average Convergence Divergence), which allows determining the direction and strength of the trend, as well as a trend change. The indicator is based on two moving averages - fast and slow, and it can work on any timeframe. Uptrends are shown by blue color of the indicator line, downtrends by the red color. Close a short position and open a long one if the line color changes from red to blue. Close a long position and open a
DEMA Trend
Pavel Gotkevitch
The DEMA Trend indicator is based on two DEMA (Double Exponential Moving Average) - fast and slow. The advantage of the DEMA moving average is that it eliminates false signals at the saw-toothed price movement and allows saving a position at a strong trend. The indicator allows determining the direction and strength of the trend, and it can work on any timeframe. Uptrends are shown by blue color of the indicator line, downtrends by the red color. Close a short position and open a long one if the
T Channel
Pavel Gotkevitch
T-Channel is a technical indicator defining the current Forex market status - trend or flat. The indicator is based on TEMA (Triple Exponential Moving Average). The advantage of the TEMA is that it provides a smaller delay than a moving average with a single or double smoothing. The indicator is able to work on any timeframes, but H1 and higher timeframes are recommended to minimize false signals. The indicator displays a channel as lines located above and below the middle line. The upper and lo
TEMA Trend
Pavel Gotkevitch
The TEMA Trend indicator is based on two TEMA (Triple Exponential Moving Average) - fast and slow. The advantage of the TEMA is that it provides a smaller delay than a moving average with a single or double smoothing. The indicator allows determining the direction and strength of the trend, and it can work on any timeframe. Uptrends are shown by blue color of the indicator line, downtrends by the red color. Close a short position and open a long one if the line color changes from red to blue. Cl
TrendDetect
Pavel Gotkevitch
The Trend Detect indicator combines the features of both trend indicators and oscillators. This indicator is a convenient tool for detecting short-term market cycles and identifying overbought and oversold levels. A long position can be opened when the indicator starts leaving the oversold area and breaks the zero level from below. A short position can be opened when the indicator starts leaving the overbought area and breaks the zero level from above. An opposite signal of the indicator can b
Trade Helper
Pavel Gotkevitch
The Trade Helper indicator is a modification of the Trade Assistant indicator (by Andriy Moraru). The Trade Helper multitimeframe indicator is a good assistant for traders, useful as a filter in most trading strategies. This indicator combines the tactics of Elder's Triple Screen in a single chart, which lies in entering a trade when the same trend is present on three adjacent timeframes. The indicator operation is based on the principle of determining the trend on the three selected timeframes
Lotus
Pavel Gotkevitch
Lotus indicator combines the features of both trend indicators and oscillators allowing you to track the smoothed price change rate, as well as trend strength and change. The uptrend is shown as a green indicator line, while a downtrend is displayed in red. A long position can be opened when the indicator breaks the zero level from below. A short position can be opened when the indicator breaks the zero level from above. An opposite signal of the indicator can be used for exiting positions. You
DEMA Cross
Pavel Gotkevitch
DEMA Cross DEMA Cross - это мультивалютный трендовый советник, работающий на реальных счетах любого типа, на любом временном интервале, с любым начальным депозитом, с постоянным или изменяющимся размером лота, с четырех- и с пятизначными котировками, а также с брокерами, использующими различный тип заливки ордеров. Отличительной особенностью советника является его стабильность и, что особенно важно, его достоверность. Результаты проверки советника в тестере стратегий в 4-х режимах (2 основных
필터:
gayan.lala
55
gayan.lala 2022.10.14 09:22 
 

사용자가 평가에 대한 코멘트를 남기지 않았습니다

[삭제] 2019.01.14 07:58 
 

사용자가 평가에 대한 코멘트를 남기지 않았습니다

Gennadiy Voltornist
11909
Gennadiy Voltornist 2018.01.13 20:26 
 

사용자가 평가에 대한 코멘트를 남기지 않았습니다

Daniel Andrejczuk
5597
Daniel Andrejczuk 2017.11.09 14:04 
 

사용자가 평가에 대한 코멘트를 남기지 않았습니다

Nork
6190
Nork 2017.06.28 05:38 
 

사용자가 평가에 대한 코멘트를 남기지 않았습니다

리뷰 답변