TEMA Trend
- 지표
- 버전: 1.1
- 업데이트됨: 25 3월 2022
- 활성화: 5

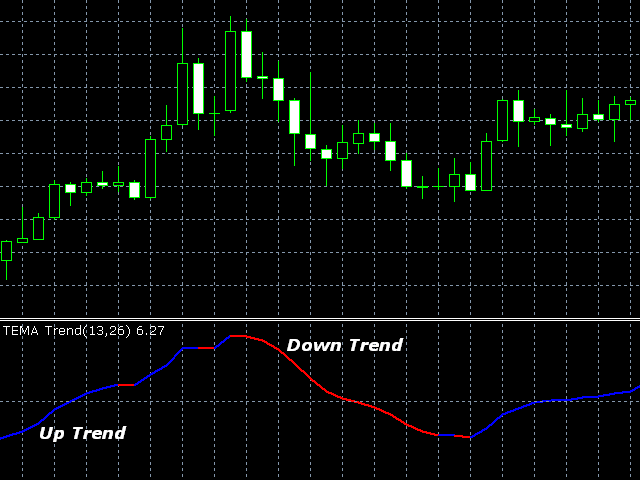
The TEMA Trend indicator is based on two TEMA (Triple Exponential Moving Average) - fast and slow.
The advantage of the TEMA is that it provides a smaller delay than a moving average with a single or double smoothing.
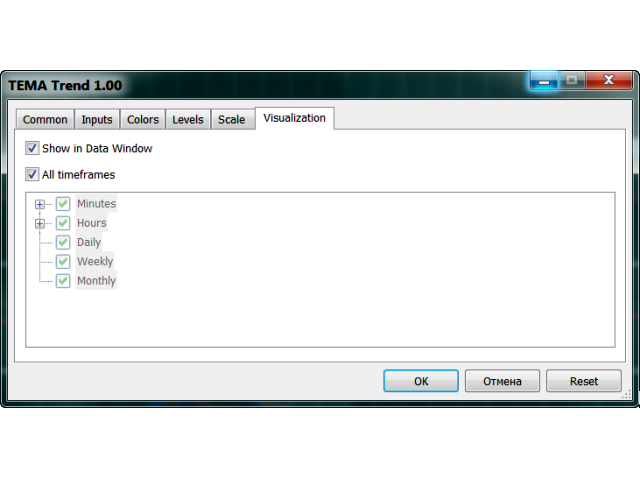
The indicator allows determining the direction and strength of the trend, and it can work on any timeframe.
Uptrends are shown by blue color of the indicator line, downtrends by the red color.
Close a short position and open a long one if the line color changes from red to blue.
Close a long position and open a short one if the line color changes from blue to red.
Use a small stop loss, as the line itself may suddenly change its color and direction.
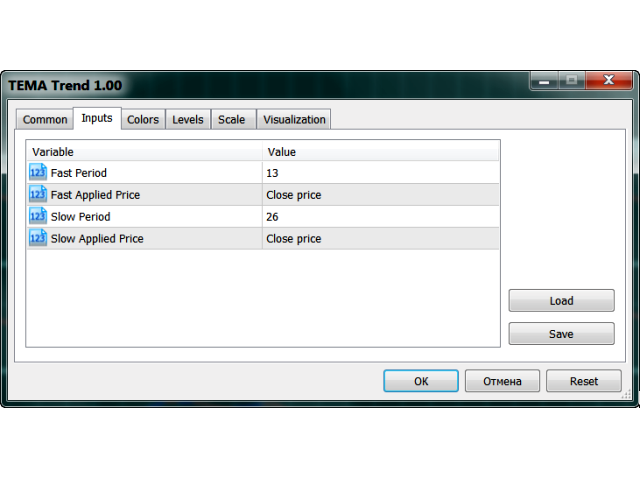
The following can be set in the TEMA indicator's Inputs tab:
- period (Fast Period, Slow Period);
- price used calculations (Close, Open, High, Low, Median, Typical, Weighted).
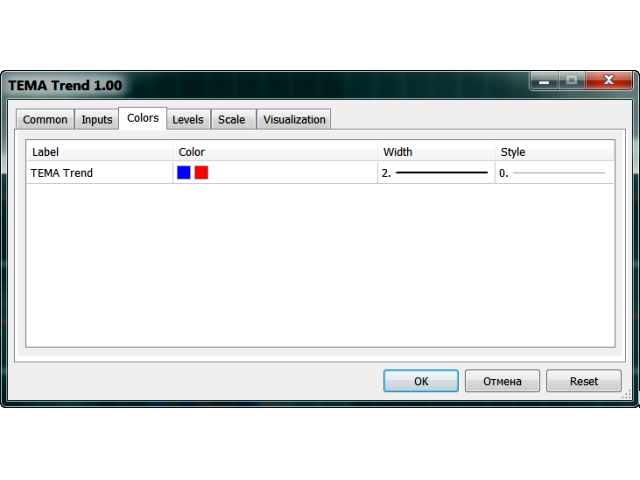
The Colors tab allows to choose the color, width and line style of the indicator.
Parameters
- fast period - the number of bars used for fast TEMA calculation;
- fast applied price - applied price type for the fast TEMA;
- slow period - the number of bars used for slow TEMA calculation;
- slow applied price - applied price type for the slow TEMA.


사용자가 평가에 대한 코멘트를 남기지 않았습니다