Ichimoku MTF

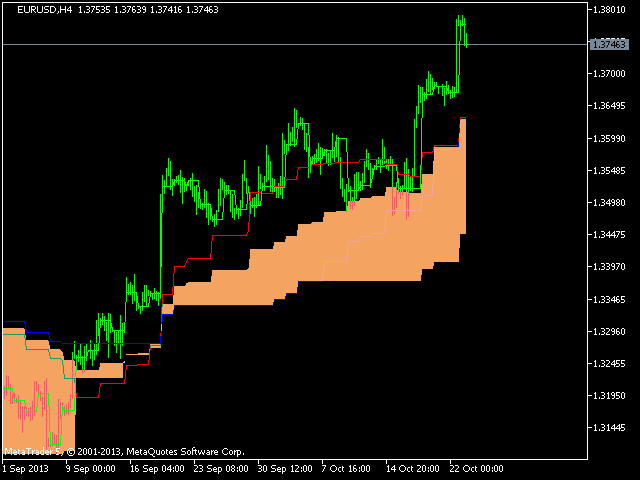
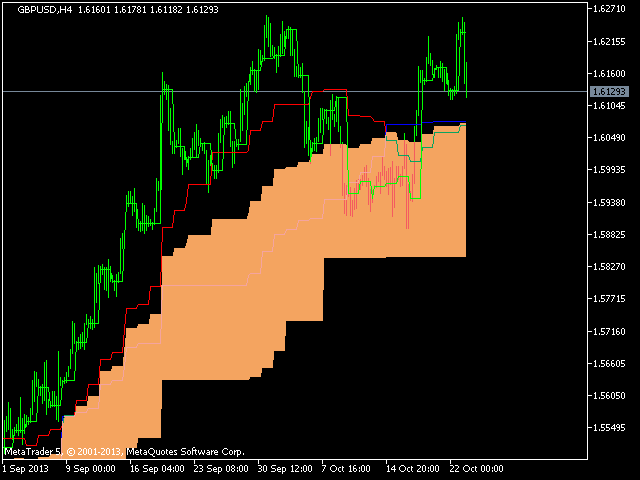
MTF Ichimoku is a MetaTrader 5 indicator based on well known Ichimoku.

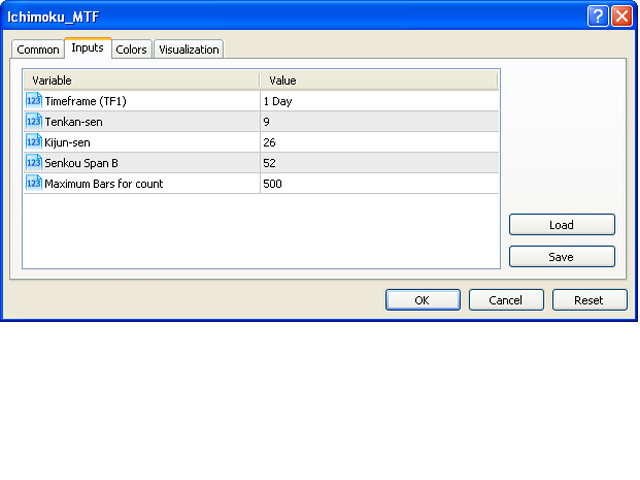
In MetaTrader 5 we have Ichimoku already included as a standard technical indicator. However it can be used only for the current timeframe. When we are looking for a trend, it is very desirable to have Ichimokuis showing higher timeframes. MTF Ichimoku presented here has additional parameter - TimeFrame. You can use it to set up higher timeframe from which Ichimokuis will calculate its values.

Other basic parameters are not changed.

On this version we can also set Maximum Count Bars.

추천 제품
Ichimoku Kinko Hyo is a purpose-built trend trading charting system that has been successfully used in nearly every tradable market. It is unique in many ways, but its primary strength is its use of multiple data points to give the trader a deeper, more comprehensive view into price action. This deeper view, and the fact that Ichimoku is a very visual system, enables the trader to quickly discern and filter "at a glance" the low-probability trading setups from those of higher probability. This i
SPIKE Radar Alet
Odete Argelio Simbine
SPIKE DETECTOR RADAR ALERT – Surgical Precision in Explosive Market Movements Master market spikes with early alerts and high probability accuracy. Spike Detector Radar Alert is an advanced indicator for MetaTrader 5, developed to identify sudden price movements (spikes) in advance with enhanced precision. By combining volatility analysis, momentum strength, and price acceleration, the algorithm delivers clear signals at key market moments. Why traders choose Spike Detector Radar Alert: Mul
VBOT CORE SIGNAL — Multi-Timeframe Trend + ADR Context for Forex, Gold, and Crypto CFDs Trade with clarity. Avoid low-quality trades. VBOT CORE SIGNAL identifies BUY, SELL, and NO TREND conditions. NO TREND — NO TRADE Launch Price: $39 (limited to the first 30 days) The price will increase to $59 after this period. Introduction VBOT CORE SIGNAL is not a simple indicator like RSI, ADX, or MA used in isolation. It is designed as a multi-layered system that combines market data, trend evaluation, a
Silver Zebra Trading System
AL MOOSAWI ABDULLAH JAFFER BAQER
Silver Zebra Trading System - Uncover Market Momentum Unlock a powerful new way to visualize market trends and momentum with the Silver Zebra Trading System. This unique MetaTrader 5 indicator is designed to give you a clear and immediate understanding of market dynamics, helping you make more informed trading decisions. For just $30, you can add this indispensable tool to your trading arsenal. What is the Silver Zebra Trading System? The Silver Zebra Trading System is a sophisticated indicator
Visual Dolphin Indicator
AL MOOSAWI ABDULLAH JAFFER BAQER
Visual Dolphin Indicator Unlock the rhythm of the market with the Visual Dolphin Indicator, your ultimate tool for identifying and capitalizing on market trends with clarity and confidence. Designed for both novice and experienced traders, this indicator eliminates the noise and guesswork, providing crystal-clear buy and sell signals directly on your chart. The Logic Behind the Waves The core of the Visual Dolphin Indicator is a sophisticated yet intuitive dual-wave system based on moving avera
Combined
Ahmed Alaaeldin Abdulrahman Ahmed Elherzawi
5 (1)
Welcome to Investment Castle products This product is exclusively available in the MQL5 market and is not available and will not be available anywehere else. The Combined indicator is a multi-time frame indicator and it is built using 3 indicators: Bands indicator which draws the support and resistance key levels using up to 5 different time frames Patterns indicator which draws the chart patterns using up to 6 different time frames Spots indicator which shows the common candlestick patterns Yo
The indicator detects and displays М. Gartley's Butterfly pattern. The pattern is plotted by the extreme values of the ZigZag indicator (included in the resources, no need to install). After detecting the pattern, the indicator notifies of that by the pop-up window, a mobile notification and an email. The pattern and wave parameters are displayed on the screenshots. The default parameters are used for demonstration purposes only in order to increase the amount of detected patterns. Parameters z
The   Trendlines Oscillator   helps traders identify trends and momentum based on the normalized distances between the current price and the most recently detected bullish and bearish trend lines. The indicator features bullish and bearish momentum, a signal line with crossings, and multiple smoothing options. USAGE The   Trendlines Oscillator   works by systematically: Identifying pivot highs and lows. Connecting pivots to form bullish (support) and bearish (resistance) trendlines. Measuring
Ichimoku Aiko MTF
Michael Jonah Randriamampionontsoa
Ichimoku Aiko MTF is a collection of technical indicators that show support and resistance levels, as well as momentum and trend direction. It is a multi-timeframe indicator so you don't need to change the chart timeframe when you want to see the ichimoku clouds on a higher timeframe.  eg. The chart timeframe is M15 and you want to see on the M15 timeframe chart the H1 ichimoku indicators (the ichimoku in Metatrader can't do that) that's why you need to use Ichimoku Aiko MTF.
SlopeChannelB MT5
MIKHAIL VINOGRADOV
SlopeChannelB – 경사진 가격 이동 채널을 구축하는 기술 분석 도구로, 시장 현황을 평가하고 거래 신호를 찾는 데 독특한 기회를 제공합니다. 지표의 주요 특징: 경사진 가격 이동 채널 : 이 지표는 지지와 저항 수준을 시각화하는 데 도움을 주며, 이는 추세의 반전 또는 지속 가능성을 나타낼 수 있습니다. 다양한 선 색상 및 배경 강조 : 경사진 지지 및 저항 수준은 다양한 색상으로 표시되며, 채널 자체는 배경이 추가로 강조되어 차트의 시각적 분석을 단순화합니다. 선 계산을 위한 세 가지 옵션 : 지표는 회귀 분석을 사용하여 채널 라인을 구성합니다. 세 가지 방법 중 하나를 선택할 수 있습니다: Robust (기본값) – 이상치에 강한 방법입니다. OLS (최소제곱법) . Median (중앙값 계산) . 최적의 모델 선택 : SlopeChannelB는 다섯 가지 품질 기준의 분석을 기반으로 가장 적합한 채널 라인 변형을 자동으로 선택합니다. 품질 매개변수는 차트에
Size Bars
Viktor Loginov
Size Bars – индикатор отображает на графике максимальный, минимальный, текущий и средний размер баров (свечей) за выбранный период. Отображаемые параметры индикатора Size Bars: 1)       Текущий размер бара в писах (по максимум/минимум, тело бара). 2)       Максимальный, минимальный и средний размер свечей BUY . 3)       Максимальный, минимальный, средний размер свечей SELL . 4)       Количество свечей BUY и количество свечей SELL . 5)       Среднее количество свечей подряд BUY и SELL . 6)     
TheRealPrice v3.0 | Ultimate Spread & Ask Visualizer TheRealPrice is a high-precision utility for MetaTrader 5 designed to expose the hidden cost of every trade: The Spread . While standard charts only display the Bid price, professional traders know that buy orders and short-exits happen at the Ask price. TheRealPrice bridges this gap by drawing a dynamic, real-time horizontal line that tracks the exact Ask level, providing a clear visual representation of the current market spread. Why do you
LT Rainbow Trend
Thiago Duarte
5 (1)
Do you, like me, like to trade with the trend? Then this indicator will help you! Rainbow Trend is a trend indicator, which uses several Moving Averages on the chart. It measures different trend strenght zones for different periods: very long term, long term, mid term, short term and very short term. Each zone has its color, and it is possible to have sound alert when the prices leaves a zone and enters another. Its configuration is very simple. If you find any bug or have any suggestions, conta
Complete SMC/ICT Indicator MT5 — Smart Money Concepts 도구   Complete SMC/ICT Indicator 는 차트 창에서 직접 실행되는 독립형 Smart Money Concepts 분석 도구입니다. 시장 구조, 불균형, 유동성 영역을 기관급 수준으로 탐지하며, 완전한 사용자 맞춤 설정과 알림 기능을 제공합니다.   기능   이 인디케이터는 10가지 핵심 SMC 요소를 탐지합니다: 스윙 고점과 저점, 공정 가치 갭(FVG), 오더 블록(OB), 구조 붕괴(BOS), 성격 변화(ChoCH), 시장 구조 전환(MSS), 동일 고점과 저점, 유동성 스윕, 디스플레이스먼트 캔들, 프리미엄/디스카운트 존. 각 기능은 드래그 가능한 패널에서 개별적으로 켜거나 끌 수 있으며, 영역은 설정에 따라 차트 앞으로 확장됩니다.   멀티 타임프레임 분석   최대 3개의 타임프레임에서 동시에 실행할 수 있으며, TF1, TF2, TF3 각각을 독립적으로 설
TANIN ICHIMOKU CLOUD (EA20): The Ultimate Trend Rider & Prop Firm Shield Trading the Ichimoku Kinko Hyo system manually can be complex and emotionally draining. Are you tired of getting shaken out of massive trends by market noise? Meet EA20 Tanin Ichimoku Cloud , a fully automated trend-following system. It takes the guesswork out of Ichimoku by executing sniper entries and riding the mega trends with zero emotions.   ENTER YOUR KEY HERE:   [  EA20_99999D_TANINCODER_598259741005 ] --
FREE
All about time and price by ICT. This indicator provides a comprehensive view of ICT killzones, Silver Bullet times, and ICT Macros, enhancing your trading experience.  In those time windows price either seeks liquidity or imbalances and you often find the most energetic price moves and turning points. Features: Automatic Adaptation: The ICT killzones intelligently adapt to the specific chart you are using. For Forex charts, it follows the ICT Forex times: In EST timezone: Session: Asia: 20h00-0
Divergence MACD
Alexey Topounov
Divergence MACD indicator shows price and MACD indicator divergence. The indicator is not redrawn! The algorithm for detection of price and MACD extremums has been balanced for the earliest entry allowing you to use the smallest SL order possible. The indicator displays all types of divergences including the hidden one, while having the minimum number of settings. Find out more about the divergence types in Comments tab. Launch settings: Max Bars - number of bars calculated on the chart. Indent
CosmiCLab FIBO
Kirils Subins
CosmiCLab SMC FIBO CosmiCLab SMC FIBO is a professional trading indicator designed for traders who use Smart Money Concepts (SMC), market structure analysis and Fibonacci retracement levels. The indicator automatically detects market swings and builds Fibonacci levels based on the latest impulse movement. It also identifies market structure changes such as BOS (Break of Structure) and CHOCH (Change of Character), helping traders understand the current market direction. CosmiCLab SMC FIBO also pr
HLC bar MT5 Wyckoff
Eduardo Da Costa Custodio Santos
MT5에 대한 표시기 "HLC_bar_MT5 Wyckoff"는 거래 시 분석을 용이하게 하기 위해 생성되었습니다. HLC Bar는 Richard Wyckoff가 사용했으며 현재 "VSA" 작업에서 널리 사용됩니다. Wyckoff는 High, Low 및 Close를 사용하면 그래프가 훨씬 더 명확하고 분석하기 쉽다는 것을 발견했습니다. 표시기 "HLC_bar_MT5 Wyckoff"는 다음을 허용합니다. # 막대 너비를 변경합니다. # 막대를 같은 색으로 둡니다. # 그리고 같은 가격으로 열리고 닫힌 바를 강조 표시합니다. 색상과 너비는 설정에서 쉽게 수정할 수 있습니다. 지표를 사용하려면 차트로 끌어다 놓기만 하면 됩니다. Wyckoff는 볼륨과 함께 사용할 때 HLC 차트를 막대 그래프라고 불렀습니다.
JAC Trend Color Candle
Eduardo Da Costa Custodio Santos
The indicator "JAC Trend Color Candle" for Meta Trader 5, was created to visually facilitate the trend for the trader. It is based on three parameters, which identifies the uptrend, downtrend and non-trending market. The colors are trader-configurable, and the average trader-configurable as well. trend parameters cannot be configured as they are the indicator's differential.
Impulse Trend
Alexandre Silva Diniz
Impulse Trend 는 트레이딩에서 가장 큰 과제 중 하나인 실제 추세와 단순한 시장 잡음을 구분하는 것 을 돕기 위해 설계된 지표입니다. 이 지표는 Hull Moving Average 의 알고리즘적 우아함과 Impulse Candles 의 통계적 강력함을 결합하여, 전문 트레이더를 위한 올인원(All-in-One) 도구 를 제공합니다. 차별화 포인트: 거래량의 힘 가격만을 분석하는 지표와 달리, Impulse Trend 는 각 캔들의 계산에 거래량 RSI 를 직접 통합합니다. 거래량은 결정적인 요소로서, 모든 신호를 검증하는 역할을 합니다. 매수 신호는 실제 자금 흐름이 움직임을 확인할 때만 발생합니다 (녹색 구름과 녹색 캔들은 상승 추세를 확인하고, 빨간 구름과 빨간 캔들은 하락 추세를 확인합니다). 가격이 거래량 없이 상승할 경우, 지표는 대기 모드를 유지하여 거짓 돌파와 조기 추세 소진으로부터 트레이더를 보호합니다. 지표 구성 요소: Hull Trend Cloud 전통
Antabod Multiplier
Rev Anthony Olusegun Aboderin
Antabod Multiplier , the ultimate trading indicator designed to simplify your decision-making process and maximize your trading potential. Built with a robust combination of moving averages and stochastic oscillators, this tool provides clear, actionable signals for both buy and sell opportunities. The Antabod Multiplier stands out with its dynamic trend detection and precision filtering, giving you real-time visual signals to catch trend reversals and optimal entry/exit points with ease. Whethe
Liquidity Touch Zones PRO X
Viacheslav Bashkirtsev
Liquidity Touch Zones PRO X - is   a support and resistance indicator that identifies   price areas of confirmed strength   formed by repeated price interactions and displayed taking into account the instrument's characteristic volatility. The calculation is based on fractal points, which serve as initial benchmarks. These points form price zones reflecting repeated price interactions and are represented as areas of varying heights depending on the level's significance. It is designed for trader
FOTSI Indicator
Leonardo Daniel Isaia
1 (1)
FOTSI – 외환 진정 강도 지수 개요 각 통화의 진정한 강도를 발견하고 우위를 가지고 거래하세요. FOTSI 지표 는 모든 주요 통화(USD, EUR, GBP, JPY, CHF, AUD, CAD, NZD)의 실제 모멘텀을 모든 통화쌍에서 측정하는 다중 통화 오실레이터 입니다. 단일 차트를 분석하는 대신, FOTSI는 여러 통화쌍의 데이터를 결합하고 움직임을 평활화하며, True Strength Index (TSI) 알고리즘을 적용하여 각 통화의 상대적 강도를 명확하고 안정적이며 지연 없이 제공합니다. 주요 특징 다중 통화 오실레이터: 각 통화의 강도를 독립적으로 측정합니다. 과매수 및 과매도 수준: +50 → 통화 과매수 (조정 확률 높음). –50 → 통화 과매도. ±25 → 중립 영역. 간단한 해석: 0 이상/이하 곡선 = 강도/약점. 리페인트 없음: 모든 계산은 실시간으로 수행되며 안정적입니다. 모든 통화쌍과 시간 프레임에서 호환: 신뢰성을 위해 H1, H4, D1 권장.
Pyjama Chart
Karim Abdelwahab
Pyjama Chart is a comprehensive technical analysis toolkit for MetaTrader 5, designed to automatically map key historical price structures and key zones on your chart. This professional utility automates the manual charting process for several advanced price-action concepts. It dynamically detects and renders structure points, trend continuation markers, supply/demand imbalances, volatility-based zones, and areas of potential liquidity, providing a complete structural blueprint of the market at
Elite Harmony Signals Pro Panoramica Elite Harmony Signals è un indicatore sofisticato di analisi tecnica che visualizza rettangoli dinamici che forniscono zone di trading chiare e segnali di conferma per decisioni migliorate. Caratteristiche Principali Zone Rettangolo Dinamiche Estensione in Tempo Reale : I rettangoli si estendono automaticamente all'azione corrente del prezzo Chiusura Intelligente : I rettangoli si chiudono solo quando appaiono segnali opposti Conferma Visiva : Zone di trading
Order Book, known also as Market Book, market depth, Level 2, - is a dynamically updated table with current volumes of orders to buy and to sell specific financial instument at price levels near Bid and Ask. MetaTrader 5 provides the means for receiving market book from your broker, but in real time only, without access to its history. The indicator OrderBook Cumulative Indicator accumulates market book data online and visualizes them on the chart. In addition, the indicator can show the market
Stocks Trade — 머신러닝 기반의 섹터 특화형 트레이딩 로봇 저희는 엄격히 제한된 트레이딩 상품 섹터와 결합된 가장 효율적인 포트폴리오 접근 방식을 선보입니다. 주요 목표는 사전 준비 없이도 누구나 미국 주식 거래를 시작할 수 있도록 하는 것입니다. 가능한 한 많은 안정적인 미국 주식을 동시에 거래하여 단기간 내에 유의미한 수익을 달성하면서도 예치금의 최대한의 안전성을 보장합니다. 제품에 대해 더 자세히 알아보고 기능을 확장할 수 있도록 도와주는 링크 다음과 같은 경우: MetaTrader 4 터미널용 이 로봇 버전을 원하시는 경우 동일한 로봇이지만 28개 통화쌍으로 거래하는 버전을 원하시는 경우 동일한 로봇이지만 암호화폐로 거래하는 버전을 원하시는 경우 Telegram 커뮤니티에 가입 — 소통, 지원, 업데이트 동일한 기술 기반의 보다 진보된 무료 솔루션 버전을 원하시는 경우 동일한 기술 기반의 초고급 유료 솔루션 버전을 원하시는 경우 이 로봇은 누구를 위한 것인가요?
Hi Low Last Day
Igor Vishnevskii
The Hi Low Last Day ( Hi Lo Last Day ) indicator shows the high and low of the last trading day and the second trading day, as well as the minimum and maximum of last week . There are many trading strategies on the daily levels. This indicator is indispensable when using such trading strategies. In fact, everything is simple in trading, you just need to understand and accept it for yourself. There is only price!!! What is price? This is the level on the chart. The level is the price that the buy
KDJ Index 4   交易实用必备工具指标 波浪自动计算指标,通道趋势交易 完美的趋势-波浪自动计算通道计算 , MT4版本 完美的趋势-波浪自动计算通道计算 , MT5版本 本地跟单复制交易 Easy And Fast Copy , MT4版本 Easy And Fast Copy , MT5版本 本地跟单复制交易 模拟试用 Easy And Fast Copy , MT4 模拟账号运行 Easy And Fast Copy , MT5 模拟账号运行 "Cooperative QQ:556024  "  "Cooperation wechat:556024"  "Cooperative email:556024@qq.com" 强烈推荐趋势指标, 波浪的标准自动计算   和   波浪的标准自动计算MT5版本     KDJ指标又叫 随机指标 ,是一种相当新颖、实用的技术分析指标,它起先用于期货市场的分析,后被广泛用于股市的中短期趋势分析,是期货和股票市场上最常用的技术分析工具。 随机指标KDJ一般是用于股票分析的统计体系,根据统计学原理,通过一个特定的周期(常为9日、9周等)
이 제품의 구매자들이 또한 구매함
SuperScalp Pro
Van Minh Nguyen
4.55 (20)
SuperScalp Pro – 고급 다중 필터 스캘핑 인디케이터 시스템 SuperScalp Pro는 클래식 Supertrend와 여러 지능형 확인 필터를 결합한 고급 스캘핑 인디케이터 시스템입니다. 해당 인디케이터는 M1부터 H4까지 모든 타임프레임에서 효율적으로 작동하며, 특히 XAUUSD, BTCUSD 및 주요 외환 통화쌍에 적합합니다. 독립형 시스템으로 사용하거나 기존 거래 전략에 유연하게 통합할 수 있습니다. 이 인디케이터는 11개 이상의 필터를 통합하며, 빠른/느린 EMA, 추세 판별용 3개의 EMA, EMA 기울기(EMA slope), RSI, ADX, 거래량(Volume), VWAP, 볼린저 밴드 돌파(Bollinger Bands Breakout) 및 MACD 다이버전스 필터 등을 포함합니다. 스마트 캔들 필터는 캔들 종가를 확인하여 약한 신호를 제거하고, 3 EMA와 MACD 다이버전스 필터를 결합한 추세 인식 메커니즘은 더 높은 승률의 신호를 선별하는 데 도움을 줍니
Azimuth Pro
Ottaviano De Cicco
5 (6)
Azimuth Pro V2: Synthetic Fractal Structure and Confirmed Entries for MT5 Overview Azimuth Pro is a multi-level swing structure indicator by Merkava Labs . Four nested swing layers, swing-anchored VWAP, ABC pattern detection, three-timeframe structural filtering, and closed-bar confirmed entries — one chart, one workflow from micro-swings to macro-cycles. This is not a blind signal product. It is a structure-first workflow for traders who care about location, context, and timing. V2 Launch Offe
Entry In The Zone and SMC Multi Timeframe is a real-time 2-in-1 market analysis tool that combines market structure analysis and a No Repaint BUY / SELL signal system into a single indicator, built on Smart Money Concepts (SMC) — a widely adopted framework used by professional traders to understand market structure. This indicator helps you see the market more clearly, make decisions based on structure rather than guesswork, and focus on high-probability zones where price is more likely to react
Power Candles MT5
Daniel Stein
4.75 (8)
Power Candles – 모든 시장을 위한 강도 기반 진입 신호 Power Candles 는 Stein Investments의 검증된 강도 분석을 가격 차트에 직접 제공합니다. 가격 움직임에만 반응하는 대신, 각 캔들은 실제 시장 강도를 기준으로 색상화되어 모멘텀 형성, 강도 가속, 명확한 추세 전환을 즉시 파악할 수 있습니다. 모든 시장을 위한 단일 로직 Power Candles는 모든 거래 심볼 에서 자동으로 작동합니다. 현재 심볼이 Forex인지 비-Forex 시장인지 자동으로 감지하여 내부적으로 적절한 강도 모델을 적용합니다. Forex 및 Gold 는 FX Power Delta 값을 사용합니다 (절대값 범위 최대 100) 지수, 크립토 및 CFD 는 IX Power Strength 값을 사용합니다 (절대값 범위 최대 50) 필요한 강도 계산은 Power Candles에 완전히 내장되어 있습니다. 캔들 색상이나 신호 로직을 위해 추가 인디케이터는 필요하지 않습니다. 가격
Divergence Bomber
Ihor Otkydach
4.9 (86)
이 지표를 구매하신 분께는 다음과 같은 혜택이 무료로 제공됩니다: 각 거래를 자동으로 관리하고, 손절/익절 수준을 설정하며, 전략 규칙에 따라 거래를 종료하는 전용 도우미 툴 "Bomber Utility" 다양한 자산에 맞게 지표를 설정할 수 있는 셋업 파일(Set Files) "최소 위험", "균형 잡힌 위험", "관망 전략" 모드로 설정 가능한 Bomber Utility의 셋업 파일 이 전략을 빠르게 설치, 설정, 시작할 수 있도록 돕는 단계별 영상 매뉴얼 주의: 위의 모든 보너스를 받기 위해서는 MQL5 개인 메시지 시스템을 통해 판매자에게 연락해 주세요. 독창적인 커스텀 지표인 “Divergence Bomber(다이버전스 봄버)”를 소개합니다. 이 지표는 MACD 다이버전스(괴리) 전략을 기반으로 한 올인원(All-in-One) 거래 시스템입니다. 이 기술 지표의 주요 목적은 가격과 MACD 지표 간의 다이버전스를 감지하고, **향후 가격이 어느 방향으로 움직일지를 알려주는
FX Trend MT5 NG
Daniel Stein
5 (4)
FX Trend NG: 차세대 멀티 마켓 트렌드 인텔리전스 개요 FX Trend NG 는 다중 시간 프레임 기반의 전문 트렌드 분석 및 시장 모니터링 도구입니다. 몇 초 만에 전체 시장 구조를 파악할 수 있도록 설계되었습니다. 여러 차트를 일일이 전환할 필요 없이, 어떤 종목이 추세에 있는지, 어디에서 모멘텀이 약화되고 있는지, 그리고 어떤 시간 프레임이 서로 정렬되어 있는지 즉시 확인할 수 있습니다. 출시 기념 특별 혜택 – FX Trend NG 를 $30 (6개월) 또는 $80 평생 라이선스 로 이용할 수 있습니다. 이미 Stein Investments 고객이신가요? -> 메시지를 보내 전용 고객 그룹에 참여하세요. 설정이나 사용 방법이 필요하신가요? -> Stein Investments 공식 페이지 를 방문하세요. 1. FX Trend NG가 특별한 이유 3단계 추세 로직 – 단순한 Buy / Sell이 아닙니다 • 대부분의 지표는 Buy 또는 Sell 두 가지 상태만 제
Quantum TrendPulse
Bogdan Ion Puscasu
5 (23)
SuperTrend   ,   RSI   ,   Stochastic   의 힘을 하나의 포괄적인 지표로 결합하여 트레이딩 잠재력을 극대화하는 궁극의 트레이딩 도구   인 Quantum TrendPulse를   소개합니다. 정밀성과 효율성을 추구하는 트레이더를 위해 설계된 이 지표는 시장 추세, 모멘텀 변화, 최적의 진입 및 종료 지점을 자신 있게 식별하는 데 도움이 됩니다. 주요 특징: SuperTrend 통합:   주요 시장 추세를 쉽게 따라가고 수익성의 물결을 타세요. RSI 정밀도:   매수 과다 및 매도 과다 수준을 감지하여 시장 반전 시점을 파악하는 데 적합하며 SuperTrend 필터로 사용 가능 확률적 정확도:   변동성이 큰 시장에서 숨겨진 기회를 찾기 위해 확률적 진동   을 활용하고 SuperTrend의 필터로 사용 다중 시간대 분석:   M5부터 H1 또는 H4까지 다양한 시간대에 걸쳐 시장을 최신 상태로 유지하세요. 맞춤형 알림:   맞춤형 거래 조건이 충족되면
이 지표를 구매하면 제 프로페셔널 트레이드 매니저를 무료로 드립니다. 우선 이 거래 시스템이 리페인팅, 리드로잉 및 레이그 인디케이터가 아니라는 점을 강조하는 것이 중요합니다. 이는 수동 및 로봇 거래 모두에 이상적인 것으로 만듭니다. 온라인 강좌, 설명서 및 프리셋 다운로드. "스마트 트렌드 트레이딩 시스템 MT5"은 새로운 및 경험이 풍부한 트레이더를 위해 맞춤형으로 제작된 종합적인 거래 솔루션입니다. 10개 이상의 프리미엄 인디케이터를 결합하고 7개 이상의 견고한 거래 전략을 특징으로 하여 다양한 시장 조건에 대한 다목적 선택이 가능합니다. 트렌드 추종 전략: 효과적인 트렌드 추이를 타기 위한 정확한 진입 및 손절 관리를 제공합니다. 반전 전략: 잠재적인 트렌드 반전을 식별하여 트레이더가 범위 시장을 활용할 수 있게 합니다. 스캘핑 전략: 빠르고 정확한 데이 트레이딩 및 단기 거래를 위해 설계되었습니다. 안정성: 모든 인디케이터가 리페인팅, 리드로잉 및 레이그가 아니므로 신뢰
Meridian Pro
Ottaviano De Cicco
5 (1)
Meridian Pro: Professional Multi-Timeframe Trend Matrix for MT5 Overview Meridian Pro is a multi-timeframe trend matrix by Merkava Labs that compresses directional state, strength, momentum condition and matrix agreement into one compact panel. One adaptive engine, applied consistently from M1 to W1. No per-symbol tuning. No indicator stacking. One structured readout across every asset and every timeframe. Launch Offer — Get Meridian Pro for USD 99 (introductory). Regular price: USD 149. 1. Why
Trend Screener Pro MT5
STE S.S.COMPANY
4.85 (104)
트렌드 표시기, 트렌드 트레이딩 및 필터링을 위한 획기적인 고유 솔루션, 하나의 도구 안에 내장된 모든 중요한 트렌드 기능! Forex, 상품, 암호 화폐, 지수 및 주식과 같은 모든 기호/도구에 사용할 수 있는 100% 다시 칠하지 않는 다중 시간 프레임 및 다중 통화 표시기입니다. Trend Screener는 차트에 점이 있는 화살표 추세 신호를 제공하는 효율적인 지표 추세 추종 지표입니다. 추세 분석기 표시기에서 사용할 수 있는 기능: 1. 트렌드 스캐너. 2. 최대 이익 분석이 있는 추세선. 3. 추세 통화 강도 측정기. 4. 경고가 있는 추세 반전 점. 5. 경고가 있는 강력한 추세 점. 6. 추세 화살표 Trend Screener Indicator가 있는 일일 분석 예, 일일 신호 성능...등은 여기에서 찾을 수 있습니다. 여기를 클릭하십시오. LIMITED TIME OFFER : Trend Screener Indicator는 50$ 및 평생 동안만 사용할 수 있습니다.
소개       Quantum Breakout PRO   , 브레이크아웃 존 거래 방식을 변화시키는 획기적인 MQL5 지표! 13년 이상의 거래 경험을 가진 숙련된 트레이더 팀이 개발한       퀀텀 브레이크아웃 PRO       혁신적이고 역동적인 브레이크아웃 존 전략으로 거래 여정을 새로운 차원으로 끌어올리도록 설계되었습니다. Quantum Breakout Indicator는 5개의 이익 목표 영역이 있는 브레이크아웃 영역의 신호 화살표와 브레이크아웃 상자를 기반으로 한 손절 제안을 제공합니다. 초보자 거래자와 전문 거래자 모두에게 적합합니다. Quantum EA 채널:       여기를 클릭하세요 중요한! 구매 후 설치 매뉴얼을 받으려면 개인 메시지를 보내주십시오. 추천: 기간: M15 통화쌍: GBPJPY, EURJPY, USDJPY,NZDUSD, XAUUSD 계정 유형: 스프레드가 매우 낮은 ECN, Raw 또는 Razor 브로커 시간: GMT +3 중개인 :
Gann Made Easy MT5
Oleg Rodin
5 (2)
Gann Made Easy 는 mr.의 이론을 사용하여 최고의 거래 원칙을 기반으로 하는 전문적이고 사용하기 쉬운 Forex 거래 시스템입니다. W.D. 간. 이 표시기는 Stop Loss 및 Take Profit Levels를 포함하여 정확한 BUY 및 SELL 신호를 제공합니다. PUSH 알림을 사용하여 이동 중에도 거래할 수 있습니다. 구매 후 거래 방법 안내 및 유용한 추가 지표를 무료로 받으시려면 저에게 연락주세요! 아마도 Gann 거래 방법에 대해 이미 여러 번 들었을 것입니다. 일반적으로 Gann의 이론은 초보자 거래자뿐만 아니라 이미 거래 경험이 있는 사람들에게도 매우 복잡한 것입니다. Gann의 거래 방식은 이론적으로 적용하기 쉽지 않기 때문입니다. 나는 그 지식을 연마하고 Forex 지표에 최고의 원칙을 적용하기 위해 몇 년을 보냈습니다. 표시기는 적용하기가 매우 쉽습니다. 차트에 첨부하고 간단한 거래 권장 사항을 따르기만 하면 됩니다. 지표는 지속적으로 시장 분석
Grabber System MT5
Ihor Otkydach
4.83 (23)
탁월한 기술적 지표인 Grabber를 소개합니다. 이 도구는 즉시 사용 가능한 “올인원(All-Inclusive)” 트레이딩 전략으로 작동합니다. 하나의 코드 안에 강력한 시장 기술 분석 도구, 매매 신호(화살표), 알림 기능, 푸시 알림이 통합되어 있습니다. 이 인디케이터를 구매하신 모든 분들께는 다음의 항목이 무료로 제공됩니다: Grabber 유틸리티: 오픈 포지션을 자동으로 관리하는 도구 단계별 영상 매뉴얼: 설치, 설정, 그리고 실제 거래 방법을 안내 맞춤형 세트 파일: 인디케이터를 빠르게 자동 설정하여 최고의 성과를 낼 수 있도록 도와줍니다 다른 전략은 이제 잊어버리세요! Grabber만이 여러분을 새로운 트레이딩의 정점으로 이끌어 줄 수 있습니다. Grabber 전략의 주요 특징: 거래 시간 프레임: M5부터 H4까지 거래 가능한 자산: 어떤 자산이든 사용 가능하지만, 제가 직접 테스트한 종목들을 추천드립니다 (GBPUSD, GBPCAD, GBPCHF, AUDCAD, AU
OmniSync Projection
Antonio-alin Teculescu
5 (1)
Chronos Fractal Engine is an innovative price projection indicator for MetaTrader 5, designed to transform your technical analysis by intelligently identifying and projecting historical price patterns. Built upon an advanced correlation algorithm and the fractal principles of the market, this powerful tool visualizes potential future price movements, giving you a unique edge in your trading decisions. What is Chronos Fractal Engine? At its core, the Chronos Fractal Engine employs a sophisticat
Crystal Heikin Ashi Signals
Muhammad Jawad Shabir
5 (2)
Crystal Heikin Ashi Signals - Professional Trend & Signal Detection Indicator Advanced Heikin Ashi Visualization with Intelligent Signal System for Manual & Automated Trading Final Price: $149 ---------> Price goes up $10 after every 10 sales . Limited slots available — act fast . Overview Crystal Heikin Ashi Signals is a professional-grade MetaTrader 5 indicator that combines pure Heikin Ashi candle visualization with an advanced momentum-shift detection system. Designed for both manual traders
Smart Stop Indicator – 차트 위에서 직접 작동하는 지능형 스톱로스 시스템 개요 Smart Stop Indicator는 감이나 추측이 아닌 명확하고 체계적인 방식으로 스톱로스를 설정하고 싶은 트레이더를 위한 맞춤형 솔루션입니다. 이 도구는 클래식 프라이스 액션 논리(고점, 저점 구조)와 현대적인 브레이크아웃 인식을 결합하여 실제로 가장 논리적인 다음 스톱 레벨을 정확히 식별합니다. 추세, 박스권, 빠른 브레이크아웃 상황 등 어떤 시장에서도 인디케이터는 최적의 SL 구역과 상태(“new”, “broken”, “valid”)를 차트에 직접 표시합니다. 새로운 기능으로 SL 거리의 %ADR 표시가 추가되었습니다. 핵심 기능 자동 시장구조 기반 스톱 설정 • 시장 구조와 실시간 가격 움직임을 기반으로 의미 있는 스톱로스 레벨을 자동으로 탐지합니다. 스마트 브레이크아웃 감지 • 빠른 방향 변화나 돌파 상황에서도 불필요한 조기 스톱 조정을 강요하지 않으며 유연하게 반응합
ARICoins
Temirlan Kdyrkhan
ARICoin is a powerful trading companion designed to generate high-probability entry signals with dynamic TP/SL/DP levels based on volatility. Built-in performance tracking shows win/loss stats, PP1/PP2 hits, and success rates all updated live. Key Features: Buy/Sell signals with adaptive volatility bands Real-time TP/SL/DP levels based on ATR Built-in MA Filter with optional ATR/StdDev volatility Performance stats panel (Success, Profit/Loss, PP1/PP2) Alerts via popup, sound, push, or email Cust
Power Bar MT5
Daniel Stein
실제 자금을 투입하기 전에 어떤 전략이 내 심볼에서 효과적인지 확인하세요. Power Bar는 모든 심볼과 모든 타임프레임에서 극단적인 가격 바 를 감지한 다음, 3가지 다른 트레이딩 전략을 즉시 백테스트하여 승률, 수익 팩터, 손익을 나란히 비교할 수 있습니다. 모든 것이 하나의 인터랙티브 패널에 담겨 있습니다. 추측 없음. 커브 피팅 없음. 오직 데이터뿐입니다. Power Bar가 특별한 이유 대부분의 인디케이터는 신호를 주고 그것이 효과가 있는지는 추측에 맡깁니다. Power Bar는 한 걸음 더 나아갑니다 - 모든 신호를 세 가지 전략 에 대해 테스트하고 통계를 보여줍니다. FlipFlop, Momentum, Reversal을 원클릭으로 전환하고 숫자가 즉시 변하는 것을 확인하세요. FlipFlop - 항상 포지션 유지. 신호에 진입하고, 반대 신호에 청산. 당사의 연구에 따르면 US30, US500, DAX와 같은 추세가 있는 지수에서 가장 효과적입니다. Momentum
Btmm state engine pro
Garry James Goodchild
5 (4)
BTMM State Engine Pro is a MetaTrader 5 indicator for traders who use the Beat The Market Maker approach: Asian session context, kill zone timing, level progression, peak formation detection, and a multi-pair scanner from a single chart. It combines cycle state logic with a built-in scanner dashboard so you do not need the same tool on many charts at once. What it does Draws the Asian session range; session times can follow broker server offset or be set in inputs. Tracks level progression (L
FX Power MT5 NG
Daniel Stein
5 (31)
FX Power: 통화 강세 분석으로 더 스마트한 거래 결정을 개요 FX Power 는 어떤 시장 상황에서도 주요 통화와 금의 실제 강세를 이해하기 위한 필수 도구입니다. 강한 통화를 매수하고 약한 통화를 매도함으로써 FX Power 는 거래 결정을 단순화하고 높은 확률의 기회를 발견합니다. 트렌드를 따르거나 극단적인 델타 값을 사용해 반전을 예측하고자 한다면, 이 도구는 귀하의 거래 스타일에 완벽히 적응합니다. 단순히 거래하지 말고, FX Power 로 더 스마트하게 거래하세요. 1. FX Power가 거래자에게 매우 유용한 이유 통화와 금의 실시간 강세 분석 • FX Power 는 주요 통화와 금의 상대적 강세를 계산하고 표시하여 시장 역학에 대한 명확한 통찰력을 제공합니다. • 어떤 자산이 앞서고 있고 어떤 자산이 뒤처지는지 모니터링하여 보다 현명한 거래 결정을 내릴 수 있습니다. 포괄적인 멀티 타임프레임 뷰 • 단기, 중기 및 장기 타임프레임에서 통화와 금의 강세를
우선적으로, 이 거래 도구는 전문적인 거래에 이상적인 비-다시 그리기 및 지연되지 않는 지표입니다.  온라인 강좌, 사용자 매뉴얼 및 데모. 스마트 가격 액션 컨셉트 인디케이터는 신규 및 경험 많은 트레이더 모두에게 매우 강력한 도구입니다. Inner Circle Trader Analysis 및 Smart Money Concepts Trading Strategies와 같은 고급 거래 아이디어를 결합하여 20가지 이상의 유용한 지표를 하나로 결합합니다. 이 인디케이터는 스마트 머니 컨셉트에 중점을 두어 대형 기관의 거래 방식을 제공하고 이동을 예측하는 데 도움을 줍니다.  특히 유동성 분석에 뛰어나 기관이 어떻게 거래하는지 이해하는 데 도움을 줍니다. 시장 트렌드를 예측하고 가격 변동을 신중하게 분석하는 데 탁월합니다. 귀하의 거래를 기관 전략에 맞추어 시장의 동향에 대해 더 정확한 예측을 할 수 있습니다. 이 인디케이터는 시장 구조를 분석하고 중요한 주문 블록을 식별하고 다양
CGE Trading Suite
Carl Gustav Johan Ekstrom
5 (1)
Institutional-Grade Analytics for MT5 CGE Trading Suite delivers the analytical edge typically reserved for professional trading desks. The platform integrates a full suite of analytical tools into one seamless workflow: dynamic grid mapping, liquidity behavior analysis, ECM, trend lines, MIDAS, trade cycles, and directional channel projections. Together, these provide a unified view of market structure and momentum. Directional clarity is further enhanced by the capital flow index, which measu
Market Structure Order Block Dashboard MT5는 차트에서 직접 시장 구조와 주요 가격 반응 구간을 읽고자 하는 트레이더를 위해 설계된 MT5 인디케이터입니다. 이 도구는 BOS, ChoCH, Order Blocks, Fair Value Gaps (FVG), Liquidity, Kill Zones, Volume Profile, 그리고 빠른 분석을 위한 컴팩트한 dashboard를 결합합니다. 이 인디케이터는 시장 구조, ICT 개념, Smart Money 개념을 의사결정의 기준으로 사용하는 트레이더를 위한 도구입니다. 추세 지속, 가능한 반전, 가격 불균형, 유동성 목표, 그리고 주요 관심 구간을 보다 구조적으로 파악하는 데 도움을 줄 수 있습니다. Version 1.19에는 중요한 기능이 추가되었습니다. 바로 Pending BOS / Pending ChoCH 감지 입니다. 캔들이 이전 swing을 돌파한 상태로 마감하면, 인디케이터는 일반적인 swing
Atomic Analyst MT5
Issam Kassas
3.94 (31)
우선적으로 언급할 점은이 거래 지표가 다시 그리지 않고 지연되지 않으며 이를 통해 수동 및 로봇 거래 모두에 이상적이라는 점입니다. 사용자 매뉴얼: 설정, 입력 및 전략. Atomic Analyst는 가격의 강도와 모멘텀을 활용하여 시장에서 더 나은 이점을 찾는 PA Price Action Indicator입니다. 고급 필터를 장착하여 잡음과 거짓 신호를 제거하고 거래 잠재력을 높이는 데 도움이 됩니다. 복잡한 지표의 다중 레이어를 사용하여 Atomic Analyst는 차트를 스캔하고 복잡한 수학적 계산을 간단한 신호와 색상으로 변환하여 초보 트레이더가 이해하고 일관된 거래 결정을 내릴 수 있도록합니다. "Atomic Analyst"는 새로운 및 경험이 풍부한 트레이더를위한 종합적인 거래 솔루션입니다. 프리미엄 지표와 최고 수준의 기능을 하나의 거래 전략에 결합하여 모든 종류의 트레이더에 대한 다재다능한 선택지가되었습니다. 인트라데이 거래 및 스캘핑 전략 : 빠르고 정확한 일일
Auto Optimized Parabolic RSI: 고급 3D 모멘텀 엔진 대부분의 개인 투자자용 보조지표는 시장의 변동성이 변하는 순간 무용지물이 되는 정적인 입력값에 의존하기 때문에 실패합니다. Auto Optimized Parabolic RSI는 자체적인 수학적 우위를 지속적으로 재계산하여 "보조지표 노후화" 문제를 해결하며, 기관급 퀀트 트레이딩의 적응력을 귀하의 MT5 터미널에 직접 제공합니다. 핵심 이점: 맞춤형 인메모리 3D 최적화 표준 자동 최적화 도구들은 일반적인 보조지표 호출로 터미널에 과부하를 일으켜 MT5 플랫폼을 멈추게 하는 경우가 많습니다. 이 도구는 이러한 병목 현상을 완전히 우회합니다. 맞춤형 네이티브 RAM 기반 계산기로 구축된 내부 엔진은 차트를 로드하거나 타임프레임을 변경할 때마다 빛처럼 빠른 3D 그리드 검색을 실행합니다. RSI 기간(주기), SAR 스텝(가속도) 및 SAR 최대치(속도 제한)를 동시에 스캔하여 플랫폼 지연 없이 수만 개의 파라
RelicusRoad Pro MT5
Relicus LLC
5 (24)
RelicusRoad Pro: 퀀트 시장 운영 체제 70% 할인 평생 이용권 (한정 시간) - 2,000명 이상의 트레이더와 함께하세요 왜 대부분의 트레이더는 "완벽한" 지표를 가지고도 실패할까요? 진공 상태에서 단일 개념 만으로 거래하기 때문입니다. 문맥 없는 신호는 도박입니다. 지속적인 승리를 위해서는 컨플루언스(중첩) 가 필요합니다. RelicusRoad Pro는 단순한 화살표 지표가 아닙니다. 완전한 퀀트 시장 생태계 입니다. 독점적인 변동성 모델링을 사용하여 가격이 이동하는 "공정 가치 로드"를 매핑하고, 단순 노이즈와 실제 구조적 돌파를 구분합니다. 추측은 그만두세요. 기관급 로드 로직으로 거래를 시작하세요. 핵심 엔진: "Road" 알고리즘 시스템의 중심에는 시장 상황에 실시간으로 적응하는 동적 변동성 채널인 Road Algo 가 있습니다. 세이프 라인(평형) 과 가격이 수학적으로 반전될 가능성이 높은 확장 레벨 을 투영합니다. Simple Road: 일반적인 시장을 위
Berma Bands
Muhammad Elbermawi
5 (8)
Berma Bands(BBs) 지표는 시장 동향을 파악하고 이를 활용하려는 트레이더에게 귀중한 도구입니다. 가격과 BBs 간의 관계를 분석함으로써 트레이더는 시장이 추세 단계인지 범위 단계인지를 분별할 수 있습니다. 자세한 내용을 알아보려면 [ Berma Home Blog ]를 방문하세요. 버마 밴드는 세 개의 뚜렷한 선으로 구성되어 있습니다. 어퍼 버마 밴드, 미들 버마 밴드, 로어 버마 밴드입니다. 이 선들은 가격 주위에 그려져 전체 추세에 대한 가격 움직임을 시각적으로 표현합니다. 이 밴드들 사이의 거리는 변동성과 잠재적인 추세 반전에 대한 통찰력을 제공할 수 있습니다. 버마 밴드 라인이 각각에서 분리될 때, 그것은 종종 시장이 횡보 또는 범위 이동 기간에 접어들고 있음을 시사합니다. 이는 명확한 방향 편향이 없음을 나타냅니다. 트레이더는 이러한 기간 동안 추세를 파악하기 어려울 수 있으며 더 명확한 추세가 나타날 때까지 기다릴 수 있습니다. 버마 밴드 라인이 단일 라인으로
ARIPoint
Temirlan Kdyrkhan
ARIPoint is a powerful trading companion designed to generate high-probability entry signals with dynamic TP/SL/DP levels based on volatility. Built-in performance tracking shows win/loss stats, PP1/PP2 hits, and success rates all updated live. Key Features: Buy/Sell signals with adaptive volatility bands Real-time TP/SL/DP levels based on ATR Built-in MA Filter with optional ATR/StdDev volatility Performance stats panel (Success, Profit/Loss, PP1/PP2) Alerts via popup, sound, push, or email Cu
ICT PO3 (Power of 3) AMD Protocol Framework Indicator True Time & Structure Integration   |  Non-Repainting | Real-Time  | Multi-Asset  | MT4 Version Available Full Setup Guide & Strategy Playbook: https://www.mql5.com/en/blogs/post/768683 MT4 Version: https://www.mql5.com/en/market/product/171742 Indicator Overview The ICT PO3 AMD Protocol Framework is a complete structural overlay for MetaTrader 5 that maps the True Daily Cycle directly onto your lower-timeframe execution chart. It projects
HFT Spike Detector
OMG FZE LLC
5 (2)
[ My Products ] , [ My Channel ]   ,  [ LIVE SIGNAL ] HFT Spike Detector HFT Spike Detector는 HFT로 인해 발생하는 급격한 가격 변동을 실시간으로 분석하고 측정하기 위해 개발된 전문적인 틱 모니터링 도구입니다. 목적은 브로커로 인해 발생하는 비정상적인 슬리피지, 유동성 공백 및 밀리초 단위 가격 스파이크를 수치 데이터로 감지할 수 있도록 하는 것입니다. 실시간 틱 흐름과 체결 조건을 분석하기 때문에 백테스트로는 정확하게 평가할 수 없습니다. 이 EA는 자동화를 위해 준비된 세트 파일과 함께 사용할 수 있도록 구매할 수 있습니다:  VolumeHedger EA 작동 원리 이 Expert Advisor는 들어오는 모든 틱을 실시간으로 분석하고: 가격 변화 속도 초당 틱 밀도 슬리피지 크기 같은 방향의 마이크로 흐름 측정하여 차트의 패널에 표시합니다. 이를 통해 스프레드를 제외한 실제 실행 품질을 확인할 수
제작자의 제품 더 보기
Ichimoku Advanced Pro MTF
Hoang Ngoc Thach
4.67 (3)
Ichimoku Kinko Hyo is a purpose-built trend trading charting system that has been successfully used in nearly every tradable market. It is unique in many ways, but its primary strength is its use of multiple data points to give the trader a deeper, more comprehensive view into price action. This deeper view, and the fact that Ichimoku is a very visual system, enables the trader to quickly discern and filter "at a glance" the low-probability trading setups from those of higher probability. This i
FREE
Gann Fan Zigzag
Hoang Ngoc Thach
A form of technical analysis based on the ideas that the market is geometric and cyclical in nature. A Gann Fan consists of a series of diagonal lines called Gann angles, of which there are nine. These angles are superimposed over a price chart to show a security's support and resistance levels. The resulting image is supposed to help technical analysts predict price changes. Although once drawn by hand, today Gann Fans can be drawn with software programs. This indicator draws Gann Fan based on
Advanced MA Signal
Hoang Ngoc Thach
This indicator was built based on Moving Average, but it always reset counter at the first bar of day/week/month. Simple arrow signal to show buy/sell signal. 3 lines of moving average can be used as price channel, this is market trend also. time_zone option allows choosing time for trading and session movement analysis.
Manual Panel
Hoang Ngoc Thach
5 (2)
I like trading manually, so I created this tool to make my trade more easier and faster. Features Money management. Click for place order ( Buy/Sell/BuyStop/BuyLimit/SellStop/SellLimit). Many buttons for control your account (Close All, Remove Pendings, Breakeven, Hedging). Auto hide if not use for 2 minutes. See profit on current symbol. Free to move panel to where you want. Save your settings for using on next time. Special: It's work on backtest mode! You can use this for training yourself.
Extrem Fast Channel
Hoang Ngoc Thach
This indicator helps to find high/low points. This is not perfect trend indicator, because sometime it shows anti-market trend. But it never misses highest and lowest price in history. So that, the rules for entry are: Sell with downtrend (red line), Buy with uptrend (blue line). Yellow arrows for Sell, but it should be confirmed by downtrend. Aqua arrows for Buy, but it should be confirmed by uptrend.
NoFear
Hoang Ngoc Thach
NoFear indicator is based on Advanced Moving Average. It is used in technical chart analysis providing signals whenever a rate change appears that exceeds the upper or lower border. The indicator works very well on trend market. It is easy to find good entry points by blue/violet arrows. The upper and lower bands should be used like support/resistance levels and stop/exit points. All signals do not repaint, and can be used immediately when they are coming. This means we do not need to wait for a
SuperTrend 2015
Hoang Ngoc Thach
The idea for indicator is using multi-SuperTrend line to define market trend and Multi Moving Average line to find good entry point. The signal doesn't repaint, wait until the bar closed to make sure the signal is confirmed. Lowest RoyalBlue line is used for Buy stoploss. Highest Magenta line is used for Sell stoploss. Indicator supports alert when signal is coming (sends email, push notifications, sound alert). High Timeframe is better for using. Indicator parameters: CountBars = 500 — How man
CCI Exit
Hoang Ngoc Thach
5 (1)
This is a great indicator to find an exit point. We never know when the market is going to change its trend. Many indicators give you a good entry point, but not good to use opposite signal as an exit point, because the signal always comes too late. This indicator will protect your profit as soon as possible when a signal to exit is found! Don't use this signal to enter, it may not be good for making an entry. The signal doesn't repaint, wait until a bar closes to make sure it is confirmed. Indi
Trend Trade 2015
Hoang Ngoc Thach
Trend Trade indicator is based on ADX indicator to define long/medium/short trend and good entry signals. The product supports virtual trade on chart to show where/when should we make an entry/exit. It works very well on D1 or above. The indicator is efficient on GOLD and CFDs. Alert_Settings = "+++++++++++++++++++++++" SendMailMode = true - Send email SendNotificationMode = true - Send notification to your phone AlertMode = true - Sound alert Show_Virtual_Trades = true - Show virtual trades Sin
Trend Prediction
Hoang Ngoc Thach
5 (3)
i-Regression Channel generates regression channel: Linear regression channel consists of two parallel lines located at the equal distance from the linear regression trend line. The distance between the channel borders and the regression line is equal to the value of the highest close price deviation from the regression line. degree - degree of regression, changes from 1 to 61; kstd - regression channel width; bars - the number of bars for the channel calculation; shift - the channel horizontal s
YourBigPlan
Hoang Ngoc Thach
The indicator is based on Moving Average to define the trend, then it finds a good entry point and follows the trend. We will keep open on a new signal until the trend is changed, and all trades exit on an opposite signal. The exit point is a bit late relative to the highest profitable point (at top/bottom), but it is the best point to exit your trades. Keep the trades, which are moving the right direction to get a high profit, and stop wrong trades as soon as possible when the trend is changed
Suport Resistance
Hoang Ngoc Thach
The indicator compares Fractal and Zigzag indicators to define hard Support and Resistance. The arrow signal appears when a new support or resistance emerges or when the price breaks through Support and Resistance zone. This indicator is efficient in conjunction with a rebound and breakout strategy. It works well on H4 and D1 for all pairs. Settings BarCounts = 200; FastPeriod = 7 - fast period SlowPeriod = 14 - slow period Show_SR = true - show support/resistance Show_Arrows = true - show up/d
Using high-volatility channel breakout-style trading systems has historically worked well across major currency pairs, show promise in determining the opportune time to trade the channel breakout trading strategy. This Breakout Strategy may look simple, but it is good follow trade trader strategy. Setting: Channel Periods: default 20 BarsCount: bars count in history Alert_Settings = "+++++++++++++++++++++++" SendMailMode = true - Send email SendNotificationMode = true - Send notification to you
Reversal Breakout
Hoang Ngoc Thach
Reversal Breakout is a real breakout strategy. It is based on Moving Average indicator to define market trend and breakout points. Try to entry when price reverse is not good, because there are many false reversal signal, so that it is better to trade breakout at reverse point. This EA will work for all Timeframe, but I prefer to use it on H1 or above. Should use it on major pairs which are lowest Spread, and lowest Slippage: EURUSD,GBPUSD,USDJPY,GOLD,... No martingale No Grid Always use Stoplos
The indicator uses 2 Moving Average: 1 fast EMA and 1 slow EMA to define trend, reversal signal and breakout point. Reversal Signal comes on open time, it can be used as scalping signal for short time, but be careful with this signal because it may be an anti-trend signal, the indicator tries to catch reverse point. Breakout signal is where support or resistance was broken out, the reversal signal has failed. Breakout signal is stronger than the Reversal Signal. We can use support/resistance lev
ATeam Sonic Hope
Hoang Ngoc Thach
ATeam Sonic Hope ATeam Sonic Hope is a fully automated Expert Advisor with no use of martingale, sometime EA open more trade with new signal and exit all trade with overall profit. Some ocillators indicator were used to generate signal and use Higher Timeframe as maintrend to entry. Real operation monitoring as well as my other products can be found here: https://www.mql5.com/en/users/rockyhoangdn/seller General Recommendations The minimum deposit is 100 USD,  Recomend low spread pair like : EU
ATeam Divergence
Hoang Ngoc Thach
The CCI Divergence is a reasonably useful indicator in itself, but it is even more effective when used with divergence pattern trading. The CCI Divergence indicator signal is one of the most potent signals among the indicators that exist in the market. Here is new version for Divergence Indicator using CCI method, with more improvements. Divergences indicate a potential investment point because the directional moment does not confirm the price. A bullish divergence occurs when the underlying va
ATeam Impulse
Hoang Ngoc Thach
The Elder Impulse System was designed by Alexander Elder and featured in his book. According to Elder, “the system identifies inflection points where a trend speeds up or slows down”. The Impulse System is based on two indicators, a  exponential moving average and the MACD-Histogram. The moving average identifies the trend, while the MACD-Histogram measures momentum. As a result, the Impulse System combines trend following and momentum to identify tradable impulses. This unique indicator combina
ATeam Panel
Hoang Ngoc Thach
This is best control panel for trader who trade with Supply and Demand Zone. Easy to calculate entry lotsize by %risk/money risk/money target/fixed lot And support Half-Kelly feature: calculate the best Risk percentage for each trade follow Kelly criterion . Auto Change chart feature Exposure and Position manager Currencies Strength Meter And more features waiting you
New Volume Profile
Hoang Ngoc Thach
4 (1)
Volume Profile is an advanced charting study that displays trading activity over a specified time period at specified price levels. The study (accounting for user defined parameters such as number of rows and time period) plots a histogram on the chart meant to reveal dominant and/or significant price levels based on volume. Essentially, Volume Profile takes the total volume traded at a specific price level during the specified time period and divides the total volume into either buy volume or s
If you have been anywhere near Forex forums or social media lately, you have no doubt been hearing people talk about   Smart Money Concepts (SMC)   trading. You may be wondering what SMC is, and whether it deserves all the hype. In this post, we will introduce Smart Money Concepts trading to you so you can make an informed decision about whether or not to give this strategy a try in your own trading. What is SMC Forex trading? Smart Money Concepts (SMC) is one of many forex trading methods. SMC
Ichimoku Kinko Hyo is a purpose-built trend trading charting system that has been successfully used in nearly every tradable market. It is unique in many ways, but its primary strength is its use of multiple data points to give the trader a deeper, more comprehensive view into price action. This deeper view, and the fact that Ichimoku is a very visual system, enables the trader to quickly discern and filter "at a glance" the low-probability trading setups from those of higher probability. This i
We try to detect long/medium/short-term trends and combine all of them with some price action patterns to find a good entry point. The Indicator benefits are: Can detect long/medium/short-term trends. Can detect resistances/supports level (like pivot levels). Shows entry point/time using colored arrows Multitimeframe mode is available.
This indicator is the same as the popular Heiken Ashi Smoothed. The Heikin Ashi indicator for MetaTrader 5 already exists, but it has two disadvantages: It paints the candles not accurate. It's not possible to change the candle width. See also Heikin Ashi in MQL5 Code Base . In this version there are no such disadvantages.
Any financial instrument that is traded on the market is a position of some active towards some currency. Forex differs from other markets only in the fact, that another currency is used as an active. As a result in the Forex market we always deal with the correlation of two currencies, called currency pairs. The project that started more than a year ago, helped to develop a group of indicators under a joint name cluster indicators. Their task was to divide currency pairs into separate currencie
This indicator is a copy of the Gann Hi-Lo Activator SSL indicator which was rewritten in MQL5. The original indicator was one-colored, that is why for more visual definition of the trend direction it was necessary to make it colored. This version is Mutitimefame, now you can see multi-trends in a separate window and signals in the main chart. Alert mode and sending of emails has been also added.
Ichimoku Kinko Hyo is a purpose-built trend trading charting system that has been successfully used in nearly every tradable market. It is unique in many ways, but its primary strength is its use of multiple data points to give the trader a deeper, more comprehensive view into price action. This deeper view, and the fact that Ichimoku is a very visual system, enables the trader to quickly discern and filter "at a glance" the low-probability trading setups from those of higher probability. This i
The Forex trading market operates 24 hours a day but the best trading times are when the major trading sessions are in play. The Sessions Moving Average indicator helps identify Tokyo, London and New York, so you know when one session starts, ends or even overlaps. This indicator also shows how session affects the price movement. Now, you can see the market trend by comparing the price with 3 Average lines or comparing 3 Average lines together.
CCI Trend
Hoang Ngoc Thach
The commodity channel index (CCI) is an oscillator originally introduced by Donald Lambert in an article published in the October 1980 issue of Commodities magazine (now known as Futures magazine). Since its introduction, the indicator has grown in popularity and is now a very common tool for traders in identifying cyclical trends not only in commodities, but also equities and currencies. The CCI can be adjusted to the timeframe of the market traded on by changing the averaging period. This indi
This is HTF (or MTF) of original Kolier SuperTrend indicator. On this version, you can use 4 Lines of supertrend to define the trend, it will be more powerful. Remade signals on smalls timeframes, the indicator will not repaint if used on small timeframes.
필터:
Gennadiy Voltornist
11909
Gennadiy Voltornist 2017.12.23 18:00 
 

사용자가 평가에 대한 코멘트를 남기지 않았습니다

Daniel Andrejczuk
5597
Daniel Andrejczuk 2017.11.09 13:41 
 

사용자가 평가에 대한 코멘트를 남기지 않았습니다

Nork
6187
Nork 2016.12.21 07:23 
 

사용자가 평가에 대한 코멘트를 남기지 않았습니다

Rodrigo da Silva Boa
7137
Rodrigo da Silva Boa 2016.03.11 04:07 
 

사용자가 평가에 대한 코멘트를 남기지 않았습니다

[삭제] 2014.05.16 10:30 
 

사용자가 평가에 대한 코멘트를 남기지 않았습니다

Vadim Strelkov
7710
Vadim Strelkov 2014.04.03 13:59 
 

사용자가 평가에 대한 코멘트를 남기지 않았습니다

리뷰 답변