DinexSpace Market Sessions Clock

  • 지표
  • Huu Tho Tran
    Huu Tho Tran
    DinexSpace - MetaTrader 5용 트레이딩 자동화 스튜디오.
    코드를 작성하기 전에 실제 비용으로 두 단계에 걸쳐 트레이딩 아이디어를 검증합니다. 검증을 통과하지 못하면 중단하며, 로봇 비용은 받지 않습니다.
    실계좌 기록
    - 실계좌에서 운용 중인 금 (XAUUSD) EA 9개. Myfxbook 인증 실계좌 (프로필: DinexSpace):
    - 마틴게일 없음, 그리드 없음. 각 EA의 최대 손실폭, 월평균 거래 횟수, 손절 유형을 공개합니다.
  • 버전: 1.0

Market Sessions Clock is a small panel that shows, at a glance, which markets are open right now and when the next one opens or closes.


How it works

- Four sessions: Sydney, Tokyo, London and New York. Each has its own on/off switch and hours.

- Hours are entered in each market's local time (for example 08:00-17:00 London), and daylight saving is applied automatically for Sydney, London and New York.

- For every session the panel shows Open or Closed, the time left until it closes or until it next opens, and the current local time in that market.

- An optional row shows the trade server time and UTC, which helps when your broker's clock differs from your own.

- The panel updates every second from the computer's UTC clock, so it keeps counting even when no new ticks arrive.

- Sessions that run past midnight are supported. By default no sessions are counted on Saturday and Sunday, which suits forex and CFDs; turn this off for markets that trade every day.


Inputs

- Sessions: on/off and start/end (HHMM) for each market, and the weekend switch.

- Display: local time column, server/UTC row, font size, panel corner.


Limits

- The default hours are typical trading hours, not official exchange schedules, and public holidays are not included.

- The countdown relies on the computer's clock. If the system clock is wrong, the times will be wrong too.

- It only shows times. It does not draw on the chart or give trading signals.


The indicator does not trade.

추천 제품
RCH FX Spread + Bar Close Countdown Indicator What This Indicator Does A simple, professional tool that displays real-time spread information and bar closing countdown directly on your MT5 charts. Key Features • Real-time spread display - Shows current spread in pips or points • Bar close countdown timer - Exact seconds remaining until current bar closes • Customizable alerts - Audio notification before bar closes • Fully adjustable display - Position, colors, fonts, and sizing options • Works o
FREE
BTC Master Pro
Farzad Saadatinia
4.58 (12)
BTC Master Pro — 규율 있는 비트코인 트레이딩을 위한 신뢰할 수 있는 파트너. 최신 버전은 OpenAI 인공지능 기술 이 통합되어, 높은 변동성을 가진 암호화폐 시장 환경에서 더욱 정교한 실행과 향상된 거래 필터링을 제공합니다. 이 전문 Expert Advisor는 MetaTrader 5 플랫폼에서 Bitcoin (BTCUSD) 거래를 위해 특별히 설계되었으며, 구조화된 실행, 노출 관리, 그리고 지능적인 리스크 관리에 중점을 두고 있습니다. 가격: $699  →  다음 단계: $999  →  최종 가격: $999 LIVE SIGNAL HERE OpenAI 기반 실행 필터 최신 버전은 OpenAI 기술을 활용하여 실시간 시장 상황을 분석하고, 품질이 낮거나 신뢰도가 부족한 거래 설정을 필터링합니다. AI 안전 레이어: 인공지능 모듈은 거래 실행 전에 작동하는 2단계 승인 시스템으로 설계되었습니다. 이는 예측 도구가 아닌 실행 필터로만 사용됩니다. 모든 거래는 구조화
안녕하세요. 12point입니다. 인디케이터가 손쉽게 원하는 통화차트로 변경해줍니다.  굳이 듀얼모니터 사용하실 필요없습니다. 창 두개 띄어놓고도 변경가능합니다. 풀버전입니다. 통화는 무조건  Market Watch 목록에 활성화가 되어있어야합니다. 그래야 정상작동이 되요.  파라미터 값: SymbolList - 원하시는 통화 및 상품을 추가 할 수 있습니다 콤마(,)를 붙혀주세요. ratio - 사이즈 조절 LineNumber - 각 라인당 몇개의 통화버튼을 지정할것인가 입니다. button_width - 버튼 사이즈 조절 button_height - 버튼 사이즈 조절 손매매에 하는데있어서 나름 괜찮은 무기를 획득했으니... 우리 모두 성투해 봅시다.   감사합니다.
Shved TMA Channel Pro   is a highly accurate professional channel indicator for the MetaTrader 5 terminal, built on a time-tested combination of the Triangular Moving Average (TMA) and the mathematical Center of Gravity (CG) algorithm. KEY ADVANTAGE: NO REPAINT Most standard TMA indicators on the market repaint their historical values, erasing old false signals, which makes them completely useless for live trading on real accounts. Our indicator   Shved TMA Channel Pro   is fully optimized an
FREE
PositionMap Pro — Account Overview Panel for MT5 A real-time panel that groups all open positions by symbol and shows Buy lots, Sell lots and net profit/loss directly on your chart — the whole account at a glance. Instead of counting lots symbol by symbol in the Terminal tab, PositionMap Pro groups everything automatically. You instantly see how much exposure you have on each symbol, split by direction. Panel example Symbol Buy Lot Sell Lot Net P/L EURUSD 0.50 — +12.30 XAUUSD — 1.00 −45.00 GBPUS
FREE
️ Trade Manager oneclick  ( Reverse Trade,  Partial Close,  Breakeven, Close All Running Trade )   control – Smart Manual Trade Control for MT5 Trade Manager oneclick control is a powerful yet lightweight trade management utility built for manual traders who want precise control over their open positions — directly from the MT5 chart. This EA does not open or close trades automatically based on any strategy. It simply provides one-click management tools to handle your running trades efficient
FREE
EA Scalping Robot VantaPulse is a multi-market scalping Expert Advisor for MetaTrader 5 that combines market structure, price zones, multi-timeframe analysis and adaptive trade management. The Expert Advisor automatically scans supported instruments, evaluates trading conditions and manages every opened position according to its individual trading plan. Trading Approach VantaPulse combines several market components before creating a trading setup: Higher-timeframe trend and directional context M
Expert. Automatic and manual trading. Ready-made trading system based on Elliott waves and Fibonacci retracement levels . It is simple and affordable. Display of the marking of Elliott waves (main or alternative option) on the chart. Construction of horizontal levels, support and resistance lines, a channel. Superposition of Fibonacci levels on waves 1, 3, 5, A Alert system (on-screen, E-Mail, Push notifications).    visual panel for opening orders in manual trading. visual panel for setting up
ROMAN5 Time Breakout Indicator automatically draws the boxes for daily support and resistance breakouts. It helps the user identifying whether to buy or sell. It comes with an alert that will sound whenever a new signal appears. It also features an email facility. Your email address and SMTP Server settings should be specified in the settings window of the "Mailbox" tab in your MetaTrader 5. Blue arrow up = Buy. Red arrow down = Sell. You can use one of my Trailing Stop products that automatical
FREE
Ignition
Dansie Software Limited
Strategy Overview The Ignition EA tries to take advantage of sudden momentum when the Ignition pattern is detected. The final bar in the ignition pattern has a small opening wick, a very little or no closing wick, is large in comparison to recent bars and must start from the lower end of the current range (for a bullish ignition) Quick Testing Use Symbol EURUSD, Timeframe M2, and remove the GBPUSD symbol from the "Symbols" input (stratergy 1 and stratergy 2) Settings The below settings appe
SPECIAL LAUNCH OFFER: $30 (1-Month Rent) Limited time offer to build our community and gather feedback! AmbM GOLD Institutional Scalper A high-precision M5 algorithm for XAUUSD (Gold) , engineered to trade exclusively at Institutional Liquidity Levels ($5/$10 psychological marks). PERFORMANCE DATA (BUY ONLY) • Win Rate: 87.09%. • Safe Growth: +$4,113 profit on $10k (13.75% Max Drawdown). • Extreme Stress Test: Successfully generated +$22,997 in a 5-year stress test (2020-2026), proving
Fvg Edge
Ahmad Meftah Abdulsalam Alawwami
5 (3)
FVG Smart Zones – 무료 버전 MetaTrader 5 (MT5)용 공정 가치 갭(FVG) 탐지 지표 단순한 지표가 아닌 실제 트레이딩 도구 를 찾고 계신가요? FVG Smart Zones – 무료 버전 은 **공정 가치 갭(FVG)**을 자동으로 감지하고 차트에 고확률 거래 구역 을 표시하여 전문적인 시장 통찰력을 제공합니다. 다음을 따르는 트레이더를 위해 설계됨: 스마트 머니 컨셉(SMC) ICT 트레이딩 컨셉 가격 행동(Price Action) 수요와 공급 분석 기관 트레이딩 전략 이 지표는 가격이 반응할 가능성이 높은 구역 에 집중할 수 있도록 도와줍니다. 주요 기능: 스마트 존 감지 상승 및 하락 FVG 자동 감지 깔끔하고 전문적인 시각적 구역 약하거나 관련 없는 갭 제거를 위한 지능형 필터링 고급 확인 기능 상위 시간대(HTF) 컨플루언스 확인 가격이 채워지면 유효하지 않은 구역 자동 제거 활성 구역과 채워
FREE
Candle Perspective Structure Indicator MT5 is a simple indicator that defines and displays the candlestick structure of the market. This indicator will suit both experienced traders and beginners who find it difficult to follow the structure visually. If you want to see more high-quality products or order the development/conversion of your own products, visit my partners' website: 4xDev Get 10% OFF on manual strategies automation services or indicator development/conversion services at 4xDev
FREE
Ichimoku with alert
Tete Adate Adjete
ichimoku indicator with alert; audible alert, email alert, push alert you can enable or disable the settings as you wish When there is a crossing of tenkansen and kijun you will get an alert When there is a cross between Senkouspan A and Senkouspan B you will get an alert Affordable sound settings possibility to modify the parameters of the ichimoku indicator
Swing Points Pro v2 – Enhanced Highs and Lows Indicator with Push Notifications Overview : The Swing Points Pro v2 indicator is a powerful and reliable tool designed to help traders identify critical swing highs and lows on their charts. Whether you trade Forex, Stocks, or Crypto, this updated version provides advanced features to enhance your market analysis, with real-time push notifications for key market movements. Key Features : Accurate Swing Identification : Pinpoints major swing highs a
FREE
Bohemia Gold MT5
Vladislav Taska
4.8 (5)
Bohemia Gold MT5 is  Trend & Volatility EA trading system designed specifically for Gold (XAUUSD) . It combines higher-timeframe trend filtering , trend detection , volatility-based SL management , and advanced trade management to adapt market conditions. It uses style logic focused on trend strength, volatility, and capital protection. NOTE:   Based on backtests, I found better trading results with the following setup: D1/H4/H2 (Trend/ADX/ATR & trade). The SET file can be downloaded here … bohe
FREE
DC Indicator
Lamont Simone Reynecke
The donchian channel indicator might just be the best fit for you Trading in derivative products such as futures, options, CFD's, forex and certificates contains significant risk. These products are not suitable for every investor. Investors could potentially lose all or more than the original investment. If anything, only money equal to personal risk capital should be used and can be lost without jeopardizing financial security or lifestyle. Partially or fully automated trading programs can
FREE
Awesome Oscillator by Bill Williams with the ability to fine-tune and replace the averaging algorithms of the indicator, which significantly expands the possibilities of using this oscillator in algorithmic trading and brings it closer in its properties to such an indicator as the MACD. To reduce price noise, the final indicator is processed with an additional Smooth averaging. The indicator has the ability to give alerts, send mail messages and push signals when the direction of movement of th
Correlation Matrix Pro - 다중 통화 헤지 스캐너 실시간으로 통화쌍 간의 상관관계를 파악하세요! 최대 6개의 통화쌍 간 통계적 관계를 동시에 시각화하는 강력한 분석 도구입니다. 포트폴리오 관리, 리스크 분산 및 헤지 전략에 완벽합니다. 주요 기능 - 로그 수익률을 사용한 실시간 피어슨 상관관계 - 최대 6개 통화쌍 동시 모니터링 - 자동 타임프레임 감지 - 조정 가능한 룩백 기간 (5-200 봉) - 헤지 기회 자동 감지 - 미니멀하고 접을 수 있는 패널 디자인 - 즉각적인 해석을 위한 색상 코딩 매트릭스 색상 코드 녹색 (+0.70 ~ +1.00) = 강한 양의 상관관계 연녹색 (+0.50 ~ +0.69) = 중간 양의 상관관계 회색 (-0.49 ~ +0.49) = 약한/상관관계 없음 주황색 (-0.50 ~ -0.69) = 중간 음의 상관관계 빨간색 (-0.70 ~ -1.00) = 강한 음의 상관관계 (헤지) 왜 상관관계인가? 리스크 관리 높은 상관관계 포지션을
FREE
CF Assistant
Andrei Bogdanov
CashFlow Assistant is a reversal-trading suite for MetaTrader 5. It marks swing tops and bottoms, draws daily support/resistance zones from the average daily range, plans the stop and three targets for every signal, and shows the signal state of all timeframes in one panel. 1) PEAK REVERSAL SIGNALS The indicator tracks price swings. A swing top (Sell) or bottom (Buy) is confirmed when price retraces from the extreme by a threshold: ATR multiplier × average bar range. • Confirmed signal: an arr
ChangePeriod MT5
Kazuya Yamaoka
You can change the time period of the chart at the touch of a button. You can also change multiple charts at the touch of a button. You can also change multiple charts at the touch of a button,   saving you the trouble of changing time periods. We are live-streaming the actual operation of the system. Please check for yourself if it is usable. Please check it out for yourself. https://www.youtube.com/@ganesha_forex We do not guarantee your investment results. Investments should be made at you
우리의   Basic Support and Resistance   표시기는 기술 분석을 향상시키는 데 필요한 솔루션입니다.이 표시기는 차트/ MT4 버전 특징 피보나치 수준의 통합 : 지원 및 저항 수준과 함께 피보나치 수준을 표시하는 옵션과 함께, 우리의 지표는 시장 행동과 가능한 역전 영역에 대한 더 깊은 통찰력을 제공합니다. 성능 최적화 : 각 막대의 개구부에서만 확장 라인을 업데이트하는 옵션을 사용하여, 우리의 지표는 지원 및 저항 수준의 정확도를 희생하지 않고 최적의 성능을 보장합니다. 입력 주요 설정 Timeframe:  이 입력을 통해 차트에 더 높은 기간의 지지선과 저항선을 표시하도록 선택할 수 있습니다. Support/Resistance Strength [Number of Bars]:   이 입력을 사용하면 지지대와 저항의 강도를 결정할 수 있습니다.숫자가 높을수록지지/저항이 더 강해집니다. Price mode:  이 매개 변수를 사용하면 지원 및 저항 수준을
EasyTrading Panel by Vexo
Joseph Brian Ong Gustilo
EasyTrading Panel V3.0 by Vexo — User Guide EasyTrading Panel V3.0 by Vexo — Manual Trade Entry Panel for MetaTrader 5 Works on ANY symbol • Auto Risk Sizing • Volume Profile POC BUY / SELL Market orders with SL → Confirm flow B.LIMIT / S.LIMIT Limit orders with OK / CANCEL buttons Auto POC Volume Profile Point of Control (live) MTF Trend EMA 50/200 on M5 M15 H1 H4 Panel Layout EA: ACTIVE Bal: $37.23 POC: 1.17951 Lot: 0.01 Risk%: 1.0 % RR: 1:2.5 SL: 1.16663 (auto) BUY SELL B.LIMIT S.LIMIT Live a
Trade Planner Pro
Martin Alejandro Bamonte
Now free. Plan every trade before you click, see your real risk, reward and lot size right on the chart. Plan the trade. See the risk. Trade with confidence. Trade Planner Pro turns any chart into a visual trade-planning workspace. Drag three lines — Entry, Stop Loss and Take Profit — and instantly see your risk/reward ratio, the exact lot size for your chosen risk %, the real money you put on the line, the spread cost, and clear warnings before you commit. No more manual lot math, no more gu

FREE
Timezone display
Muhamad Syafiq Bin Khairuddin
English: Institutional Timezone Sync & Subwindow Timeline Overview The MT5 timezone mismatch is a classic data-alignment headache for algorithmic and manual traders alike. This professional-grade indicator bridges the gap between broker server time and your local system time. Engineered specifically to have a near-zero CPU footprint, it is the perfect visual companion for quantitative traders running external machine learning models or Python bridges who cannot afford UI lag or execution slippa
FREE
MetaTrader 5 용 무료 카운트다운입니다. 아무 차트에나 붙이면 현재 봉이 마감되기까지 남은 정확한 시간, 봉이 만들어지는 동안의 진행 막대, 그리고 여러 상위 시간대의 실시간 카운트다운을 한꺼번에 보여 줍니다. 초 단위로 정확하고, 거치적거리지 않습니다. 무엇을 보여 주는가 마감까지의 정확한 시간.   현재 차트 시간대에 대한 크고 실시간인 카운트다운이 1 초마다 줄어들고, 마지막 몇 초는 강조됩니다. 진행 막대.   현재 봉이 어디까지 만들어졌는지 한눈에 보입니다. 모든 시간대를 한 번에.   M5, M15, M30, H1, H4, D1 의 실시간 카운트다운을 나란히 보여 주므로 차트를 바꾸지 않고도 어느 시간대가 다음에 마감되는지 알 수 있습니다. 어떤 시간대를 나열할지는 직접 고릅니다. 왜 도움이 되는가 어림짐작 대신 봉 마감에 맞춰 진입과 청산 시점을 잡습니다. 하위 시간대에서 작업하는 동안 상위 시간대 봉이 곧 그려진다는 것을 압니다. 서버 시간 기준으로 정확하므로
FREE
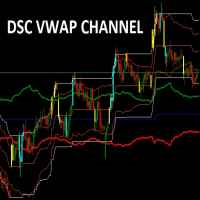
Dsc Vwap Channel
Diogo Sawitzki Cansi
4 (1)
Indicador usado para sabermos os pontos de suporte de resistência no gráfico. Funciona em todos ativos e timeframes. Acerte exatamente os pontos de entradas e saídas das suas operações.   SEE OUR RESULTS ON INSTAGRAM:  https://www.instagram.com/diogo.cansi/   TELEGRAM GROUP =  https://t.me/robosdsc More information by email dscinvestimentos@gmail.com or by Whatsapp 55-991372299
FREE
수다스럽지 않은 계단식 필터를 관심 목록 전체에서. Twin Range Filter Scanner는 이중 범위 선을 최대 스물여덟 종목과 네 시간대에서 따라가고, 가장 최근에 돌아선 것부터 보드를 정렬하며, 몇 개의 시간대가 일치하는지 한 열로 알려 줍니다. 그 아래 차트는 진입 준비가 되어 있습니다. 10개가 판매될 때마다 가격이 10달러씩 인상됩니다. Twin Range Filter Scanner는 한 파일에 두 제품이 들어 있습니다. 첫째는 눈앞의 차트에 그려지는 Twin Range Filter 자체로, 계단식 필터 선, 그 범위 띠, 그리고 신호 화살표입니다. 두 번째 제품은 같은 계산을 종목 목록에 대해 여러 시간대에서 동시에 돌리는 보드입니다. 보드는 어떤 종목이 신호를 냈고 얼마나 오래전인지 알려 줍니다. 그 아래 차트는 무엇이 그 신호를 만들었는지 보여 주므로, 표가 찾아낸 것에 따라 움직이려고 두 번째 지표를 붙일 필요가 없습니다. 보드 종목마다 한 줄, 스캔하는 시
Apex Point
Marco Engstermann
Apex Point is a trend-following indicator for MetaTrader 5, transforming complex market data into signals for traders. It displays blue dots for uptrends, red dots for downtrends, and yellow crosses at potential reversals, helping users identify momentum shifts quickly. Key features include a confirmation system requiring multiple bars (default: 3) to validate changes, reducing false signals; dynamic ATR-based offsets for adaptive trailing, with instant ratcheting in the trend direction and smo
FREE
Zapscalper
Richard Aninon
Zapscalper: Pullback and Spike Scalper with Reversal Protection. Please don't forget to rate and review us. Key features Spike detection.   Alligator pullback logic.   200 EMA trend filter.   Consolidation filter.   Oversized breakout filter.   Reversal stop order (optional).   Automatic trade management. Flexible lot size. Margin protection.   Smart pip detection.   Trade controls.   History replay and recovery. On-chart panel. Alerts and logs. When Zapscalper does not trade The panel and logs
이 제품의 구매자들이 또한 구매함
Trend Sniper X
Sarvarbek Abduvoxobov
4.86 (42)
Trend Sniper X 는 트레이더가 추세 방향과 잠재적 반전 지점을 명확하고 정확하게 포착할 수 있도록 도와주는 MetaTrader 5용 멀티 타임프레임 추세 추종 지표입니다. MT4용: https://www.mql5.com/en/market/product/193245 가격 정보: 현재 가격은 프로모션 할인가이며, 향후 업데이트 및 새로운 기능이 출시됨에 따라 변동될 수 있습니다. 보너스 혜택: 본 지표 전용 무료 자동매매 Assistant EA를 받으시려면 구매 후 작성자에게 메시지를 보내주시기 바랍니다. Code2Profit 채널 멀티 타임프레임 분석으로 시장을 마스터하세요! Trend Sniper X로 승률을 극대화하는 방법: 핵심 규칙 및 세션 팁 기술 사양 플랫폼 MetaTrader 5 지표 유형 멀티 타임프레임 추세 지표 운용 타임프레임 모든 차트 타임프레임 지원, 독립적으로 선택 가능한 상위 타임프레임(M1–MN1) 주요 상품 외환, 금(XAUUSD) 및 기타 C
Smart Trend Trading System — MetaTrader 5 구매 후 MQL5에서 저에게 메시지를 보내시면 Smart Universal Expert Advisor를 무료로 받으실 수 있으며, 온라인 강좌, PDF 매뉴얼 및 비공개 그룹 이용 권한도 함께 제공됩니다. STTS는 추세 방향, 진입·청산 신호, 반전 구간, 주요 가격 수준을 차트에 모아 보여줍니다. 시스템을 참고해 수동으로 거래하거나, 별도의 호환 EA를 연결하여 선택한 설정에 따라 자동으로 거래를 실행할 수 있습니다. 하나의 시스템, 네 가지 트레이딩 접근법 STTS의 트레이딩 접근법은 크게 네 가지로 나뉩니다. • 스캘핑 — 단기 신호와 시장 움직임을 살펴봅니다. • 추세 매매 — 방향을 평가하고 추세 안에서 기회를 찾습니다. • 반전 매매 — 잠재적인 전환 구간과 방향 변화를 파악합니다. • 거래량 매매 — 거래량 기반 정보로 시장 활동을 평가합니다. 진입·청산 화살표, 추세 정보, 지지·저항 수
Zoryk Gold
Reda El Koutbane
4.78 (18)
ZORYK — MetaTrader 5용 XAUUSD 전문 신호 및 트레이드 플래닝 시스템 이런 경험이 있을 것입니다. 골드를 분석하고 진입을 기다린 뒤 마침내 포지션을 열었지만 가격이 곧바로 반대 방향으로 움직입니다. 너무 일찍 청산하거나 Stop Loss를 옮기거나 몇 초 동안 망설입니다. 그 후 시장은 내가 없이도 처음 예상했던 목표까지 정확히 움직입니다. 문제는 항상 방향이 아니었습니다. 진짜 문제는 불확실성이었습니다. 정확한 진입 위치를 몰랐습니다. 어느 지점에서 원래의 트레이드 아이디어가 무효가 되는지 몰랐습니다. 가까운 수익을 확보해야 할지 더 큰 움직임을 기다려야 할지 판단하기 어려웠습니다. 현재 setup이 정말 강한지 아니면 단지 새로운 거래를 억지로 찾고 있는지도 확신하기 어려웠습니다. 골드는 매우 빠르게 움직입니다. 명확한 계획이 없다면 좋은 분석도 몇 초 만에 나쁜 결정으로 바뀔 수 있습니다. ZORYK는 이 문제를 해결하기 위해 개발되었습니다.
새로운 왕의 등장 - 인디케이터 + 주문 관리 표시(TP1 + TP2 + TP3) + 선택형 텔레그램 시그널 전송 기능 포함 (무료) (완전한 트레이딩 및 시그널 시스템) 골드를 위한 최고의 EA: Gold Slayer 이 인디케이터는 고급 전략, 사용자 지정 가능한 주문 관리 시스템, 그리고 엔벨로프 확장을 결합한 평균 회귀(mean reversion) 시스템을 포함하고 있습니다. 또한 RSI와 같은 여러 지능형 확인 필터를 통해 높은 확률의 반전 진입 구간을 포착하여 BUY 및 SELL 시그널을 제공합니다. 단순히 거래 방법만 배우는 것이 아니라, 여러 포지션을 효과적으로 관리하고 이전에 수익 중인 오픈 포지션으로 손실 거래를 커버하는 방법까지 익힐 수 있습니다. M5 전용으로 설계 및 최적화되었으며, 유동성이 풍부해 시그널이 더 깔끔하고 신뢰도 높은 BTCUSD와 XAUUSD에서 뛰어난 성능을 발휘합니다. 이 인디케이터는 ATR 기반으로 자동 계산된 진입가, 손절가, 익절가와
M5 Sniper
MeanFX
5 (3)
당신의 트레이딩 우위를 한눈에 확인하세요! M5 Sniper 는 MeanFX의 새로운 지표입니다. 정확한 트레이딩 신호 와 적응형 TP/SL 레벨 을 결합하여, 결과적으로 가능한 최고의 통계적 트레이딩을 만들어냅니다! 5회 구매마다 가격이 인상되며, 다음 가격은 69$입니다. 구매 후 저에게 메시지를 보내주시면 팁/가이드와 보너스 EA를 제공해 드립니다. 무엇이 이 지표를 특별하게 만들까요? Gold XAUUSD에서 검증된 통계적 성과 ( 거의 모든 자산에서 작동 하며, 일관된 결과 없이 모든 것을 다루려고 하기보다는 하나의 타임프레임을 완전히 익히는 데 집중합니다) 각 심볼당 하루 1~8회의 트레이드 와 높은 승률을 제공하며, 모든 통계적 우위를 우리의 편으로 가져갑니다. 차트에는 확인된 BUY 및 SELL 신호만 표시됩니다. 각 트레이드에 대해 지표가 생성하는 적응형 TP 및 SL 레벨 평균 승률 75%+ 평균 Signal Ratio 최소 1.1+ 알람 및 알림이 휴대폰 으로도
SMC Intraday Formula
VividMind Digital Solutions
5 (26)
먼저 솔직하게 말하겠습니다. 어떤 인디케이터도 단독으로 당신을 수익성 있게 만들어주지 않습니다. 누군가 그렇게 말한다면, 그는 당신에게 꿈을 파는 것입니다. 완벽한 매수/매도 화살표를 보여주는 모든 인디케이터는 완벽하게 보이도록 만들 수 있습니다 — 단지 올바른 과거 구간을 확대하고 승리한 거래만 캡처하면 됩니다. 우리는 그렇게 하지 않습니다.  SMC Intraday Formula는 도구입니다. 시장 구조를 읽고, 가장 높은 확률의 가격 구간을 표시하며, 현재 스마트 머니의 흐름이 어떻게 보이는지 아주 단순한 언어로 보여줍니다. 최종 결정은 여전히 당신이 합니다. 실행도 당신이 합니다. 하지만 이제는 희망이 아니라 정확성으로 거래하게 됩니다. 우리는 이 인디케이터를 지난 약 3년 동안 골드(XAUUSD) 및 주요 외환 통화쌍의 데이 트레이딩 스캘핑에 사용해 왔습니다. M1, M5, M15, M30에서 우리의 핵심 도구입니다. 이 도구는 미래를 예측하려 하지 않습니다 — 지금 형성
SuperScalp Pro
Van Minh Nguyen
4.54 (37)
SuperScalp Pro - Professional Multi-Layer Confluence Scalping System SuperScalp Pro는 기존 Supertrend에 여러 지능형 확인 필터를 추가하여 기능을 강화한 고급 스캘핑 지표입니다. 잘못된 신호를 크게 줄이면서 성공 가능성이 더 높은 Buy/Sell 거래 기회를 식별하는 데 도움을 줍니다. 명확한 Buy 및 Sell 화살표가 차트에 직접 표시되며, ATR 기반 Stop Loss 및 Take Profit 레벨도 실시간으로 자동 계산됩니다. 현재 가격은 프로모션 가격입니다. 예정된 업그레이드 이후 가격은 159 USD로 인상됩니다. 구매 후 설치 방법과 지표의 거래 신호를 자동화하는 방법에 대한 안내가 필요하시면 저에게 문의해 주세요. SuperScalp Pro Auto Trader로 신호를 간편하게 자동화하세요: [Auto Trader] 권장 설정 파일 다운로드: [Set File] 전체 문서는 제품 블로그에서
Auto Optimized SpeedAngle 은 지속적인 워크포워드 최적화(Walk-Forward Optimization, WFO)를 통해 곡선 적합(curve-fitting)을 제거한 기관 수준의 모멘텀 벡터화 시스템입니다. 시장 체제가 바뀔 때 성능이 떨어지는 정적 입력에 의존하는 대신, 이 지표는 표본 외(Out-of-Sample, OOS) 검증을 사용하여 매개변수를 동적으로 재보정하며, 표시되는 신호가 과거의 우연이 아닌 진정한 통계적 우위를 나타내도록 보장합니다. 핵심 기관용 프레임워크 워크포워드 최적화 엔진: 핵심 알고리즘은 수천 가지의 룩백(lookback) 및 임계값 조합을 지속적으로 스캔하며, 데이터를 인샘플(in-sample)과 표본 외(out-of-sample) 세트로 엄격하게 분리합니다. 미지의 데이터 환경에서 수학적 우수성이 증명된 경우에만 새로운 매개변수 구성을 채택합니다. 정량적 목적 함수: 순수한 총이익을 쫓는 대신, 최적화 엔진은 기관 수준의 안정성
Boba Analysis Suite
Trade Ready Solutions LLC
5 (1)
Boba Analysis Suite Boba Analysis Suite는 MetaTrader 5용 분석 지표입니다. 시장 구조, 주요 가격 영역, 전반적인 시장 상황을 하나의 차트 화면에 통합하여 표시합니다. 트레이더이자 트레이딩 코치로서의 실무 경험을 바탕으로 개발되었으며, 시장 방향 평가, 주요 가격 수준 식별, 여러 시간대의 종합적인 분석 등 체계적인 분석 과정을 지원합니다. 시장 맥락을 고려한 분석 개별 신호의 의미는 시장 상황에 따라 달라집니다. Boba Analysis Suite는 현재 차트 상황을 더 넓은 시장 구조와 연결하고, 사전에 정한 규칙에 따라 매매 아이디어를 검토할 수 있도록 돕습니다. 주요 분석 기능은 다음과 같습니다. 추세 및 시장 구조: 시장 방향과 관련 구조적 맥락을 평가합니다. 주요 가격 영역 및 수준: 추가 분석이 필요한 중요한 영역을 차트에 시각적으로 표시합니다. 여러 시간대: 서로 다른 시간대의 정보를 통합하여 전반적인 시장 상황을 평가합니다.
GoldenX Entry MT5
VividMind Digital Solutions
5 (17)
GoldenX Entry는 MT5용 인디케이터로, 적응형 Smart Entry Trend 알고리즘, 신호 스코어링 시스템, 시장 레짐 감지 기능, 그리고 변동성 필터를 포함합니다. 각 신호에는 계산된 진입 레벨, 3개의 익절(TP1, TP2, TP3) 레벨, 그리고 손절(Stop-Loss) 레벨이 포함됩니다. 이 인디케이터는 다양한 시장 환경에 적응하도록 설계된 다중 분석 레이어 구조 위에 구축되어 있으며, 내장 최적화기와 통계 추적 시스템을 결합합니다. 또한 Risk-to-Reward(RR) 지표와 과거 거래 행동 기반의 정량 분석을 제공합니다. 시작은 간단합니다 — 선택한 타임프레임에서 최적화기를 실행한 뒤 차트에서 바로 인디케이터를 사용하면 됩니다. 핵심 기능 GoldenX Entry는 하나의 차트에서 신호 엔진, 트레이드 관리 기능, 그리고 과거 통계 추적을 통합합니다: - 내장 최적화기: 최적화기는 차트에서 원클릭으로 실행됩니다. 200개의 파라미터 조합을 두 단계 탐색
Entry Points Pro for MT5
Yury Orlov
4.52 (152)
전설이 돌아왔습니다: Entry Points Pro 10. MQL5 마켓 Top-3 자리를 3년간 지켜온 전설적인 지표의 재출시입니다. 수백 개의 호평 리뷰(두 버전 합산 589개), 매일 이 지표로 거래하는 수천 명의 트레이더, 31,000회 이상의 데모 다운로드   MT4+MT5 . 지난 5년간 여러분이 남긴 리뷰를 하나도 빠짐없이 읽었고, 약속 대신 그 답을 버전 10에 담았습니다. 1999년부터 시장에서 활동하며 정직함과 자신의 평판, 그리고 고객을 소중히 여기는 개발자가 만들었습니다. Entry Points Pro의 진입 시그널은 절대 리페인팅되지 않습니다. 그리고 이번에는 개발자의 말뿐이 아니라 검증 가능한 사실입니다: 확정 시그널은 캔들 종가에서만 표시되며, 자동화 테스트에서 리페인팅 0건 이 확인되었습니다(EURUSD, XAUUSD, BTCUSD에서 2,486,568회의 불변조건 검사 — 위반 0건). 검증 방법은 공개되어 있으니 전략 테스터에서 직접 재현해 보실 수
Adaptive Price Action Engine 지표를 구매하면 EA(자동매매 프로그램)가 무료 멀티 타임프레임 기반 자기 최적화 추세 & 캔들 패턴 분석 시스템 시장은 끊임없이 변화하며, 모든 Price Action 패턴이 모든 시장 환경에서 동일한 가치를 가지는 것은 아닙니다. Adaptive Price Action Engine 은 변화하는 시장 환경에 적응할 수 있도록 설계되었으며, 추세 구조, 멀티 타임프레임 분석, 캔들 패턴 및 통계적 최적화 를 하나의 분석 프레임워크로 결합합니다. 두 가지 적응형 모드 Dual Alpha Trend Mode 낮은 타임프레임과 높은 타임프레임에서 적합한 Alpha Trend 파라미터를 자동으로 탐색하여, 최근 시장 움직임에 맞춰 추세 분석을 조정합니다. Candlestick + Alpha Mode Alpha Trend를 통한 시장 국면 분석과 22개의 상승 및 하락 캔들 패턴 을 결합합니다. 모든 패턴을 동일하게 취급하는 대신, 다양
ARIPoint
Temirlan Kdyrkhan
1 (4)
ARIPoint is a powerful trading companion designed to generate high-probability entry signals with dynamic TP/SL/DP levels based on volatility. Built-in performance tracking shows win/loss stats, PP1/PP2 hits, and success rates all updated live. Key Features: Buy/Sell signals with adaptive volatility bands Real-time TP/SL/DP levels based on ATR Built-in MA Filter with optional ATR/StdDev volatility Performance stats panel (Success, Profit/Loss, PP1/PP2) Alerts via popup, sound, push, or email Cu
Gann Made Easy MT5
Oleg Rodin
5 (12)
Gann Made Easy 는 mr.의 이론을 사용하여 최고의 거래 원칙을 기반으로 하는 전문적이고 사용하기 쉬운 Forex 거래 시스템입니다. W.D. 간. 이 표시기는 Stop Loss 및 Take Profit Levels를 포함하여 정확한 BUY 및 SELL 신호를 제공합니다. PUSH 알림을 사용하여 이동 중에도 거래할 수 있습니다. 구매 후 거래 방법 안내 및 유용한 추가 지표를 무료로 받으시려면 저에게 연락주세요! 아마도 Gann 거래 방법에 대해 이미 여러 번 들었을 것입니다. 일반적으로 Gann의 이론은 초보자 거래자뿐만 아니라 이미 거래 경험이 있는 사람들에게도 매우 복잡한 것입니다. Gann의 거래 방식은 이론적으로 적용하기 쉽지 않기 때문입니다. 나는 그 지식을 연마하고 Forex 지표에 최고의 원칙을 적용하기 위해 몇 년을 보냈습니다. 표시기는 적용하기가 매우 쉽습니다. 차트에 첨부하고 간단한 거래 권장 사항을 따르기만 하면 됩니다. 지표는 지속적으로 시장 분석
M1 Sniper MT5
Oleg Rodin
5 (7)
M1 SNIPER 는 사용하기 쉬운 거래 지표 시스템입니다. M1 시간대에 맞춰 설계된 화살표 지표입니다. 이 지표는 M1 시간대 스캘핑을 위한 단독 시스템으로 사용할 수 있으며, 기존 거래 시스템의 일부로도 사용할 수 있습니다. 이 거래 시스템은 M1 시간대 거래용으로 특별히 설계되었지만, 다른 시간대에도 사용할 수 있습니다. 원래는 XAUUSD와 BTCUSD 거래를 위해 이 방법을 설계했지만, 다른 시장 거래에도 유용하다는 것을 알게 되었습니다. 이 지표의 신호는 추세 방향과 반대로 거래될 수 있습니다. 저는 지표의 신호를 활용하여 양방향으로 거래할 수 있도록 돕는 특별한 거래 기법을 알려드립니다. 이 방법은 특별한 동적 지지선과 저항선 가격 영역을 활용하는 것을 기반으로 합니다. 구매하시면 M1 SNIPER 화살표 지표를 바로 다운로드하실 수 있습니다. 또한, 아래 스크린샷에 표시된 Apollo Dynamic SR 지표는 M1 SNIPER 도구를 사용하는 모든 사용자에게 무료로
FiboSniper Pro
Van Minh Nguyen
5 (4)
FiboSniper Pro – Multi-Filter Fibonacci System with Auto SL/TP and Control Panel FiboSniper Pro는 동적 Fibonacci Envelopes와 여러 확인 필터를 결합하여 선별된 Buy 및 Sell 신호를 생성하는 기술적 지표입니다. Fibonacci 레벨은 Moving Average와 ATR을 기반으로 계산된 후 ADX, EMA, RSI, ATR, Volume, Time 및 Candle 구조를 통해 필터링됩니다. 이 지표는 ATR 기반의 자동 Stop Loss 및 Take Profit 레벨을 차트에 직접 표시하며, 빠른 설정 조정을 위한 인터랙티브 Control Panel을 제공합니다. 구매 후 권장 설정 파일과 자세한 사용 방법을 받으려면 저에게 문의해 주세요. Auto Trader X를 사용하여 FiboSniper Pro 신호를 자동화할 수 있습니다: [Auto Trader X] User Guide 및 Se
Gold Entry Sniper
Tahir Mehmood
5 (21)
Gold Entry Sniper – 골드 스캘핑 & 스윙 트레이딩을 위한 전문 다중 시간 프레임 ATR 대시보드 Gold Entry Sniper 는 XAUUSD 및 기타 종목에 대해 정확한 매수/매도 신호 를 제공하는 고급 MetaTrader 5 지표입니다. ATR 트레일링 스톱 로직 과 다중 시간 프레임 분석 을 기반으로 설계되어 스캘핑과 스윙 트레이딩 모두에 적합합니다. 주요 기능 및 장점 다중 시간 프레임 분석 – M1, M5, M15 추세를 한눈에 확인. ATR 기반 트레일링 스톱 – 변동성에 따라 자동 조정. 전문 차트 대시보드 – 신호 상태, ATR 레벨, 회귀선, 매매 방향 표시. 명확한 매수/매도 마커 – 자동 화살표와 텍스트 라벨. 종료 알림 & 거래 관리 – 수익 보호를 위한 자동 종료 감지. 완전 사용자 설정 가능 – 대시보드 위치, 색상, ATR/회귀선 파라미터 조정. 골드(XAUUSD) 최적화 – M1~M15 스캘핑에 완벽, 외환/지수/암호화폐에도 적용 가능.
Tokyo mt5 Indicator
Vasiliy Strukov
5 (12)
Tokyo Indicator는 추세 방향, 잠재적 거래 신호 및 시장 상황을 명확하고 시각적으로 보여줍니다. 색상으로 구분된 계단식 추세선은 강세 구간(파란색)과 약세 구간(자홍색)을 명확히 구별해 줍니다. 추세가 전환될 때 나타나는 방향성 화살표는 잠재적인 매수 및 매도 기회를 강조하여 보여줍니다. 통합 대시보드는 현재 신호, 시장 성향(bias), 모멘텀, 변동성, 신호 품질 등의 정보를 한눈에 파악할 수 있도록 구성되어 있습니다. 이를 통해 트레이더는 별도의 패널을 오갈 필요 없이 가격 움직임(price action)과 지표의 데이터를 동시에 분석할 수 있습니다. 깔끔한 차트 화면과 간결한 시장 개요를 제공하는 Tokyo Indicator는 체계적인 추세 분석과 거래 결정을 지원합니다. 모든 시간대와 다양한 자산(특히 금)에서 활용할 수 있습니다. 추세 방향, 잠재적 거래 신호 및 시장 상황을 명확하고 시각적으로 보여줍니다. 색상으로 구분된 계단식 추세선은 강세 구간(파란색)
Get Ready for Major New Features in Our Next Update — Version 2.52 Coming Soon! [NEW]  We’re taking market analysis to the next level with 4   new features designed to meet your trading needs. Introducing: TRADE OVERVIEW DASHBOARD  CONFLUENCE AT ZONE  OTE   Strong & Weak High/Low  1. TRADE OVERVIEW DASHBOARD A dashboard that helps you see the overall market picture more easily, with key information from multiple timeframes and trading guidance to support your trading decisions, helping you an
Break and Retest Hunter
Mohamed Hassan
3.67 (3)
Break and Retest Hunter is a powerful MetaTrader 5 indicator designed to automatically identify support and resistance levels, breakout structures, and potential retest opportunities in real time. Bonus Indicator: After purchasing Break and Retest Hunter , contact me to receive Trade Indicator Assistant EA completely free as a bonus utility. $65 for the next 10 copies . Next price is $120.  Combining adaptive market analysis, clear BUY/SELL signals, Fibonacci-based profit targets, and a premiu
Apex Patterns PRO 인디케이터 구매 시 - 기반 Expert Advisor 무료 제공. 자체 최적화 차트 패턴 및 브레이크아웃 분석 시스템 기존의 패턴 스캐너는 고정된 파라미터에 의존하므로 시장 변동성과 구조가 변화할 때 성능이 저하되는 경우가 많습니다. Apex Patterns PRO는 구조적 차트 패턴 인식, 모멘텀 필터링, 통계적 자체 최적화를 하나의 분석 프레임워크로 결합하여 변화하는 시장 환경에 적응하도록 설계되었습니다. 적응형 스캐닝 엔진 자체 최적화 패턴 모드 최근 과거 데이터를 바탕으로 적절한 패턴 파라미터를 자동으로 탐색하여, 정적인 설정 대신 현재 시장 행보에 맞춰 인디케이터의 구조 감지 방식을 적응시킵니다. 스마트 브레이크아웃 필터링 클래식 패턴 인식과 모멘텀, 거래량, 프라이스 액션 지표를 결합합니다. 모든 브레이크아웃을 동일하게 다루는 대신, 시장의 기저 구조를 평가하여 현재 통계적 환경에 부합하는 셋업을 식별합니다. 주요 기능 리페인트 없는 고
Gold Trend Coach MT5
Cristhian Alexander Gaibor Cuasquer
5 (2)
Gold Trend Coach는 MetaTrader 5용 골드(XAUUSD) 추세 지표로, 매수 및 매도 신호, 손절과 세 개의 익절 목표를 봉 마감 시 확정하며, 멀티 타임프레임 코치 대시보드와 휴대폰 및 Telegram 알림을 제공합니다. 런던과 뉴욕 세션의 M5 스캘핑과 M15 데이트레이딩을 위해 만들어졌습니다. Gold Trend Coach: 진입, 손절, 세 개의 목표가 있는 XAUUSD 골드 추세 신호. 출시 가격 $39, 처음 20개 한정, 이후 $59. 구매 후 메시지를 주시면 구매자 키트를 바로 보내 드립니다. 최악의 연속 손실을 차트 위에 그대로 보여 주는 골드 지표. 이 마켓의 모든 XAUUSD 지표는 자신의 승리 신호를 보여 줍니다. Gold Trend Coach는 손실 신호도 보여 줍니다. 빨간색으로 세고, 최악의 연속 손실과 순결과를 보기 좋은 것만이 아니라 모든 것을 세는 패널에 표시합니다. 신호가 손절에 닿으면 보입니다. 세 번 연속 손절에 닿아도 보입
Neuro Poseidon MT5
Daria Rezueva
4.75 (52)
Neuro Poseidon is a new indicator by Daria Rezueva. It combines precise trading signals with adaptive TP/SL levels - creating best possible trades as a result! Message me and get  Neuro Poseidon Assistant  as a gift to automize your trading process! What makes it stand out? 1. Proven profitability on all assets and timeframes 2. Only confirmed BUY and SELL signals present on the chart 3. Adaptive TP & SL levels generated by the software for each trade 4. Easy to understand - suitable for al
Trend Catcher ind mt5
Ramil Minniakhmetov
5 (18)
트렌드 캐처 인디케이터 트렌드 캐처 인디케이터는 개발자가 자체 개발한 맞춤형 적응형 트렌드 분석 지표들을 조합하여 시장 가격 움직임을 분석합니다. 단기적인 노이즈를 제거하고 근본적인 모멘텀 강도, 변동성 확대, 가격 구조 움직임에 집중하여 진정한 시장 방향을 파악합니다. 또한 이동 평균, RSI, 변동성 필터와 같은 맞춤형 지표들을 활용하여 가격을 평활화하고 트렌드를 필터링합니다. 실제 운영 모니터링 및 기타 제품은 다음 링크에서 확인하실 수 있습니다:   https://www.mql5.com/en/users/mechanic/seller 텔레그램에서는 EA나 설정 파일을 판매하지 않습니다. 사기이니 주의하세요. 모든 설정 파일은 블로그에서 무료로 제공됩니다. 중요! 구매 후 즉시 연락 주시면 사용 방법 및 보너스를 드립니다!
Unix Scalper
Issam Kassas
4 (4)
Unix Scalper — MetaTrader 5 구매 후 MQL5에서 저에게 메시지를 보내시면 Smart Universal Expert Advisor를 무료로 받으실 수 있으며, 온라인 강좌, PDF 매뉴얼 및 비공개 그룹 이용 권한도 함께 제공됩니다. 매매 기회를 찾고, 거래 계획을 확인하고, 실행 방법을 선택하세요. UNIX Scalper는 시장 분석, BUY/SELL/WAIT 판단, Entry, Stop Loss, TP1 및 TP2 가격 수준을 하나의 정돈된 패널에 제공합니다. 신호와 거래 계획을 한눈에 • 명확한 판단: BUY, SELL 또는 WAIT. • 구체적인 가격 수준: Entry, Stop Loss, TP1 및 TP2. • 다중 시간대 개요: 패널의 여러 시간대 신호를 비교하세요. • 판단을 돕는 분석: 추세, 모멘텀, 거래량, 변동성, 지지와 저항, 시장 품질. • 다양한 레이아웃: Minimized, Compact, Standard 또는 Full. 신호와
Advanced Supply Demand MT5
Bernhard Schweigert
4.53 (15)
현재 33% 할인! 초보자나 전문 트레이더를 위한 최고의 솔루션! 이 보조지표는 우리가 다수의 독창적 기능과 새로운 공식을 통합한 독특하고 고품질이며 저렴한 거래 도구입니다. 이 업데이트를 통해 이중 시간대를 표시할 수 있습니다. 더 높은 TF를 표시할 수 있을 뿐만 아니라 차트 TF와 더 높은 TF 모두를 표시할 수 있습니다: 중첩 영역 표시. 모든 Supply Demand 트레이더들이 좋아할 것입니다. :) 중요한 정보 공개 Advanced Supply Demand의 잠재력을 극대화하려면 다음을 방문하십시오. https://www.mql5.com/ko/blogs/post/720245   진입 또는 목표의 명확한 트리거 포인트를 정확히 찾아냄으로 해서 거래가 어떻게 개선될지 상상해 보십시오. 새로운 알고리즘을 기반으로 매수자와 매도자 간의 잠재적인 불균형을 훨씬 더 쉽게 분간할 수 있습니다. 왜냐하면 가장 강한 공급영역과 가장 강한 수요 영역과 과거에 어떻게 진행 되었는지를(이전
FX Trend MT5 NG
Daniel Stein
5 (6)
FX Trend NG: 차세대 멀티 마켓 트렌드 인텔리전스 개요 FX Trend NG 는 다중 시간 프레임 기반의 전문 트렌드 분석 및 시장 모니터링 도구입니다. 몇 초 만에 전체 시장 구조를 파악할 수 있도록 설계되었습니다. 여러 차트를 일일이 전환할 필요 없이, 어떤 종목이 추세에 있는지, 어디에서 모멘텀이 약화되고 있는지, 그리고 어떤 시간 프레임이 서로 정렬되어 있는지 즉시 확인할 수 있습니다. 출시 기념 특별 혜택 – FX Trend NG 를 $30 (6개월) 또는 $80 평생 라이선스 로 이용할 수 있습니다. 이미 Stein Investments 고객이신가요? -> 메시지를 보내 전용 고객 그룹에 참여하세요. 설정이나 사용 방법이 필요하신가요? -> Stein Investments 공식 페이지 를 방문하세요. 1. FX Trend NG가 특별한 이유 3단계 추세 로직 – 단순한 Buy / Sell이 아닙니다 • 대부분의 지표는 Buy 또는 Sell 두 가지 상태만 제
소개       Quantum Breakout PRO   , 브레이크아웃 존 거래 방식을 변화시키는 획기적인 MQL5 지표! 13년 이상의 거래 경험을 가진 숙련된 트레이더 팀이 개발한       퀀텀 브레이크아웃 PRO       혁신적이고 역동적인 브레이크아웃 존 전략으로 거래 여정을 새로운 차원으로 끌어올리도록 설계되었습니다. Quantum Breakout Indicator는 5개의 이익 목표 영역이 있는 브레이크아웃 영역의 신호 화살표와 브레이크아웃 상자를 기반으로 한 손절 제안을 제공합니다. 초보자 거래자와 전문 거래자 모두에게 적합합니다. Quantum EA 채널:       여기를 클릭하세요 중요한! 구매 후 설치 매뉴얼을 받으려면 개인 메시지를 보내주십시오. 추천: 기간: M15 통화쌍: GBPJPY, EURJPY, USDJPY,NZDUSD, XAUUSD 계정 유형: 스프레드가 매우 낮은 ECN, Raw 또는 Razor 브로커 시간: GMT +3 중개인 :
Scalper Vault MT5
Oleg Rodin
5 (1)
Scalper Vault는 당일 매매(intraday trading)에서 일관된 성과를 내고자 하는 트레이더를 위해 설계된, 강력하고 모든 기능을 갖춘 트레이딩 시스템입니다. 이 고정밀 지표는 외환(Forex) 및 바이너리 옵션 트레이더 모두에게 기관급 분석을 제공하는 독립적인 종합 트레이딩 시스템 역할을 합니다. 구매 후 저에게 연락해 주시면, 트레이딩 팁과 함께 특별한 보너스를 제공해 드립니다! Scalper Vault는 추측에 의존하거나 복잡한 수동 분석을 할 필요를 없애주며, 사용하기 쉬운 트레이딩 기법을 통해 오직 매매 실행에만 집중할 수 있도록 돕습니다. 정확한 추세 추종 신호: 핵심 알고리즘이 시장 구조를 분석하여, 지배적인 시장 추세 방향과 일치하는 고확률 신호만을 제공함으로써 잘못된 진입을 획기적으로 줄여줍니다. 정밀한 고점 및 저점 탐지: 시장의 움직임이 소진되는 지점을 스캔하여 잠재적인 반전 구간을 식별합니다. 간(Gann) 이론 기반의 매수/매도 구간: 수학적
Volatility Master for MetaTrader is a real-time dashboard tool that scans up to  50 symbols  to identify high-volatility , trending markets instantly. With bullish/bearish signals, customizable alerts, and a user-friendly interface, it helps you avoid range-bound conditions and focus on high-probability trades. Clarity leads to confidence. Trade confidently and protect your capital effectively with this powerful dashboard. We don't offer free or bonus indicators in exchange of reviews from you.
제작자의 제품 더 보기
Daily and Previous Day Levels draws the reference levels intraday traders check every morning: the previous day's high, low and close, today's open, today's running high and low, and the previous week's high and low. How it works - Values come straight from the symbol's own D1 and W1 bars, so the day follows your broker's server day. - Each day gets its own line segment, from the day's first bar to its last. Past days stay readable and old lines never shift. You choose how many days to keep (5
FREE
Session Boxes draws the Asia (Tokyo), Europe (London) and US (New York) trading sessions as rectangles on an intraday chart. Each box spans the session's high and low, so you can see where each market traded, how wide the range was and where sessions overlap. How it works - Session hours are entered in each market's local time (Tokyo 09:00-18:00, London 08:00-17:00 and New York 08:00-17:00 by default). - UK and US daylight saving are applied automatically, so the boxes stay on the right bars al
FREE
ATR Stop Levels draws price levels a chosen number of ATRs below and above the current price. It shows at a glance where a volatility-based stop would sit for a long or a short position, without measuring by hand. How it works - ATR (Average True Range) measures the typical bar range. You can smooth it with RMA (Wilder's original method), SMA or EMA. - Up to three multipliers (1.5, 2 and 3 by default). Each draws a dashed level below price and one above, with a label showing the price and the d
FREE
Risk to Lot Calculator turns "how much am I willing to lose on this trade" into a lot size. It takes your contract data straight from the broker, so it works the same on forex, gold, indices and crypto CFDs. How it works - Risk per trade is a percent of your balance (or equity, or a manual amount) or a fixed amount in the account currency. - The stop loss can be a price, a distance in points or a multiple of ATR. - The loss for 1.00 lot at the stop is the stop distance divided by the tick size,
FREE
Average Daily Range (ADR) Panel shows how far a symbol usually travels in a day and how much of that typical range today has already covered. It is a quick way to judge whether today is quiet, normal or unusually active. How it works - The daily range is the D1 bar's high minus its low. ADR is the average of that range over the last 5, 10 and 20 completed days; today's unfinished day is not included. - Today's range is the current D1 bar's high minus its low so far. - "Used of ADR" is today's r
FREE
ATR Volatility Percentile answers a simple question: is the market quiet or busy compared with its own recent past? Raw ATR values are hard to compare across symbols and periods. A percentile puts them on one 0-100 scale. How it works - ATR (Average True Range, Wilder's smoothing, length 14 by default) measures the typical bar range. - The indicator compares the current ATR with the previous N values (250 bars by default). The percentile is the share of those values that were lower than or equa
FREE
ATR Trailing Stop Line draws where a volatility-based trailing stop would sit. For a long position the line stays a fixed number of ATRs below the highest point reached. For a short position it stays above the lowest point. The line only moves in the position's favour and never moves back. How it works - ATR (Average True Range, Wilder's smoothing) measures the typical bar range. The line sits a chosen multiple of it (3 by default) away from price. - On each bar the line is pulled up (long side
FREE
Account Info Panel puts the numbers you check most often into one small panel on the chart, so you do not have to switch to the Trade tab. What it shows - Balance and equity. - Floating P/L of open positions. - Closed today: profit, swap, commission and fees of deals closed since the start of the server day. Deposits and withdrawals are excluded. - Margin used and free margin. - Margin level, highlighted when it falls below 200%. - Today's drawdown: how far equity is below its level at the star
FREE
Correlation Matrix shows how closely up to six symbols have moved together. It helps to avoid holding several positions that are really the same bet, and to see when a usual relationship between markets breaks down. How it works - The reference bars are the last N closed bars (60 by default) of the chosen timeframe (D1 by default) on the chart symbol. - For each symbol the indicator finds the bar at the same time with iBarShift and takes its return, so symbols with different trading hours are c
FREE
Currency Strength Meter ranks the eight major currencies (USD, EUR, GBP, JPY, CHF, CAD, AUD, NZD) from strongest to weakest over a recent period. It uses all 28 pairs they form, so it shows whether a move belongs to one currency or to the other side of the pair. How it works - For each pair the indicator takes the percent change between the last closed bar and the bar N bars before it on the chosen timeframe (24 H1 bars by default). - A currency gains that change when it is the base of a pair a
FREE
Drawdown Monitor keeps an eye on your account and tells you how deep the current drawdown is. Its alerts fire before a bad day turns into a worse one. How it works - DD from peak: how far equity is below its highest value. The peak is stored in a terminal global variable per account, so it survives restarts. It can be reset with an input. - Floating DD: how far equity is below balance, which is the loss on open positions. - Today DD: how far equity is below the equity at the start of the server
FREE
Fibonacci Auto Levels draws Fibonacci retracement levels automatically, so you do not have to drag the Fibonacci tool by hand every time the chart moves. How it works - The indicator looks at the last N bars (100 by default) and finds the highest high and the lowest low. - The direction follows which extreme came last. - Low after the high: the last swing was down. Level 0 sits at the low and level 1 at the high, so the levels show how far price has bounced back up. - High after the low: the la
FREE
Heikin Ashi Smoothed draws a cleaner version of Heikin Ashi candles. Regular Heikin Ashi already averages prices to reduce noise; this version smooths twice, before and after the Heikin Ashi step, so small swings disappear and longer moves stand out. How it works 1. The bar's open, high, low and close are smoothed with an exponential moving average (length 10 by default). 2. Heikin Ashi candles are built from those smoothed prices: close = average of the four prices, open = midpoint of the prev
FREE
Inside/Outside Bar Highlighter colours two common candle patterns so they are easy to spot on any chart: - Inside bar: the bar's high is below the previous high and its low is above the previous low. The range has contracted inside the previous bar. - Outside bar: the bar's high is above the previous high and its low is below the previous low. The range has expanded beyond the previous bar on both sides. How it works - The indicator draws a coloured candle on top of each matching bar. Inside ba
FREE
Multi-Timeframe Trend Panel shows, in one small panel, what a moving average is doing on four timeframes at once (M15, H1, H4 and D1 by default). You can see whether the timeframes agree without switching charts. How it works - For each timeframe the indicator reads the moving average (EMA 50 by default) on the last closed bar and on the bar a few bars before it (5 by default). - The change between the two is compared with ATR(14) of the same timeframe: - rising when the average went up by more
FREE
Opening Range Levels marks the high, low and middle of the opening range, the first minutes of a session you choose, and carries those levels through the rest of the day. How it works - You set the window and its time zone: New York (default 09:30-10:00), London, Tokyo or your broker's server time. - US and UK daylight saving are applied automatically. Your broker's server offset is detected from the terminal; most brokers shift their clock with US daylight saving, which is the default, and a f
FREE
Day and Week Separators draws vertical lines at the start of each day, week and month on intraday charts, with an optional day-of-week label at each line. It is a small visual aid that makes it easier to see where one trading day ends and the next begins. How it works - Day, week and month separators each have their own switch, colour and line style. - When several periods start on the same bar, only the strongest line is drawn: month over week, week over day. - The trading day can start at the
FREE
Pivot Points draws the classic floor-trader levels from the previous day, week or month: a central pivot plus resistance (R) levels above and support (S) levels below. Three common formulas are included. Formulas (H, L, C = previous period's high, low, close; P = (H + L + C) / 3; range = H - L) - Classic: R1 = 2P - L, S1 = 2P - H, R2/S2 = P ± range, R3 = H + 2(P - L), S3 = L - 2(H - P). - Fibonacci: P ± 0.382, 0.618 and 1.000 × range. - Camarilla: C ± range × 1.1/12, 1.1/6, 1.1/4 and 1.1/2 (R1-
FREE
Previous Session High Low Alerts marks the high and low of the last completed trading session and alerts you when price comes back to them. Many traders watch where the previous Asian, London or New York session topped and bottomed. This indicator draws those levels and notifies you when they are touched. How it works - You set one session by its start and end in server time (default 10:00-19:00, which matches London hours on many brokers whose servers run at GMT+2/+3). Sessions may run past mi
FREE
Round Number Levels draws horizontal lines at round prices around the current price, for example every 50 dollars on gold, every 100 pips on EURUSD or every 1,000 on Bitcoin. Many traders watch these "psychological" prices, so it is useful to have them on the chart without drawing them by hand. How it works - With the automatic step, the minor step is about one hundredth of the price, rounded to 1, 2 or 5 times a power of ten. Gold near 4,000 gives 50, EURUSD near 1.10 gives 0.01, and Bitcoin n
FREE
Spread Monitor and Logger keeps a record of your broker's spread on the current symbol. It shows when spreads widen (rollover, news, quiet hours) and keeps a simple log you can open in a spreadsheet. How it works - Every second the indicator reads the current spread in points. A sample is only counted while the symbol is quoting (a new tick in the last minute), so closed hours do not pull the statistics down. - The panel shows the current spread, the average, minimum and maximum of the current
FREE
Spread and Swap Info shows the trading costs and timing details of the current symbol in a small panel, so beginners can check them without opening the symbol specification. What it shows - Spread in points, with "(fixed)" when the broker quotes a fixed spread. - Swap long / short with the right unit for the symbol's swap mode: points, a currency (base, margin or account currency), percent per year, or "reopen". When swaps are disabled or both are zero it shows "Swap: none". - Triple swap day,
FREE
Swing High Low Levels marks confirmed swing highs and lows and extends each one to the right as a horizontal level until price breaks it. At a glance you can see which recent swings are still intact and which have already been taken out. How it works - A swing high is a bar whose high is above the highs of the bars on its left and not exceeded by the bars on its right (10 left and 5 right by default). A swing low works the same way with lows. - A swing is confirmed only after the bars on its ri
FREE
Volume Profile shows where volume has built up by price over the last N bars. It draws a horizontal histogram to the right of the last bar and marks three reference levels: the Point of Control, and the high and low of the Value Area. How it works - The price range of the last N bars (200 by default) is split into rows (40 by default). - Each bar's volume is spread evenly over its high-low range and added to the rows it touches. You can use tick volume (always available in MT5) or real volume w
FREE
Session and Anchored VWAP plots the volume-weighted average price (VWAP), the average price paid in a period weighted by volume. Two versions are included: one that resets every day, week or month, and one anchored at a moment you choose. How it works - Periodic VWAP: starts fresh at the beginning of each day (broker server time), each week (Monday) or each month, and accumulates price × volume from there. - Up to two bands at a chosen number of standard deviations show how far price has moved
FREE
Watchlist Scanner puts the key numbers of up to 20 symbols in one panel on any chart, so you can compare markets without opening a chart for each. Columns - Last: current bid. - Chg %: change since the previous daily close, green when up and aqua when down. - Spread: current spread in points. - ATR D1 (%): the daily Average True Range over the last 14 completed days, in price and as a percent of price. It shows how much each symbol typically moves in a day, on a comparable scale. - Range/ATR: t
FREE
필터:
리뷰 없음
리뷰 답변