Chaikin Oscillator Scanner Dashboard All Pair TF
- 지표
- 버전: 1.0
- 활성화: 5

Chaikin Oscillator Scanner Dashboard All Pair and TimeFrame
Product Overview
Chaikin Oscillator Scanner Dashboard is an analytical multi-currency and multi-timeframe utility developed for MetaTrader 5. The tool performs automated scanning across user-defined symbol baskets or the active Market Watch window to detect momentum shifts driven by volume accumulation and distribution. Operating directly from a single host chart, it evaluates Chaikin Oscillator (CHO) dynamics across multiple timeframes simultaneously, eliminating the need to maintain dozens of separate terminal charts. The dashboard calculates dynamic entry prices, volatility-based Stop Loss thresholds, and dual Take Profit milestones (1:1 and 2:1 Risk-to-Reward ratios) based on Average True Range (ATR) metrics. Built-in interactive controls allow traders to sort opportunities, inspect signal age, switch target charts instantly, and filter raw market triggers through a modular technical filter architecture.
Technical Operating Principle
The primary signal generation mechanism relies on Marc Chaikin's oscillator algorithm, measuring Accumulation/Distribution Line (ADL) momentum via exponential moving average differentials.
- Accumulation/Distribution Foundation: The algorithm evaluates price closes relative to candle high-low ranges weighted by tick volume. When closes cluster near candle highs during rising volume, accumulation is detected. When closes cluster near lows, distribution is detected.
- Exponential Difference Calculation: The Chaikin Oscillator applies a fast Exponential Moving Average (default: 3 periods) and a slow Exponential Moving Average (default: 10 periods) to continuous Accumulation/Distribution values: CHO = EMA(FastPeriod, ADL) - EMA(SlowPeriod, ADL).
- Baseline Zero-Crossover Detection: A bullish momentum shift is registered when the oscillator line transitions from below the zero line to above zero. A bearish momentum shift is registered when the oscillator transitions from above zero to below zero.
- Confirmed Bar Execution (Non-Repainting): Calculations are performed strictly on completed candles (Bar 1 to Lookback limit). Signals and numerical values do not recalculate, shift, or disappear once the bar has closed, providing reliable historical references.
- Secondary Multi-Filter Confluence: Before any signal is validated and displayed on the dashboard, the candidate bar is routed through a secondary filter verification engine. This architecture evaluates trend alignment, relative momentum boundaries, and structural support/resistance zones to filter low-probability setups in unfavorable market regimes.
- Volatility-Adjusted Level Computation: Upon validation of a zero-crossover, the dashboard measures market volatility using the Average True Range (ATR). Stop Loss is projected from the confirmed candle close using an ATR multiplier. Take Profit 1 is established at a 1:1 risk-to-reward ratio, while Take Profit 2 is established at a 2:1 risk-to-reward ratio.
Core System Features
- Multi-Asset Real-Time Scanner: Continuously scans up to user-defined symbol limits or all instruments in Market Watch across selected timeframes.
- Multi-Timeframe Matrix: Concurrently evaluates timeframes ranging from M1 through Monthly within a single execution cycle.
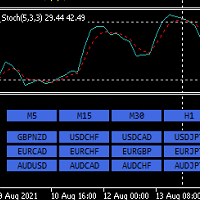
- Interactive Dashboard Interface: Provides live visual tracking of asset symbol, timeframe, direction, timestamp, entry price, Stop Loss, Take Profit 1, Take Profit 2, Chaikin value, and signal age.
- Direct Chart Navigation (One-Click Switch): Clicking the OPEN button next to any alert instantly redirects the active chart to that specific pair and timeframe, automatically plotting visual entry levels.
- Non-Repainting Execution Model: Evaluates completed closed bars to maintain visual consistency between scanner records and chart inspection.
- Dynamic ATR Risk Engine: Automatically calculates protective stops and target projections tailored to the instantaneous volatility profile of each asset.
- Interactive Sorting System: Supports instant sorting by signal recency, alphabetical pair name, operational timeframe hierarchy, or directional bias.
- Fully Modular Multi-Filter Architecture: Supports up to 17 switchable technical filters to confirm volume breakouts with trend, momentum, and structural criteria.
- Persistent Window State: Retains panel coordinates and minimized/expanded display states across terminal restarts via global terminal variables.
- Multi-Channel Notification Dispatcher: Transmits instantaneous alerts via terminal popups, audible sound alerts, mobile push notifications, and email reports.
- Optimized Memory & CPU Footprint: Utilizes pre-cached indicator handles and a controlled timer loop to prevent terminal lag or thread blocking.
Operational Recommendations
- Recommended Asset Classes: Highly liquid instruments with consistent volume flow, including major and minor Forex pairs (e.g., EURUSD, GBPUSD, USDJPY, AUDUSD, USDCAD), precious metals (XAUUSD, XAGUSD), equity indices, and liquid synthetic symbols.
- Operational Timeframes: Suitable for multi-style implementations. For day trading and intra-day momentum, M15, M30, and H1 timeframes provide balanced signal frequency. For swing trading, H4 and D1 timeframes capture larger directional cycle shifts. Lower timeframes (M1-M5) require tighter spread conditions.
- Broker Account Specifications: Compatible with all MetaTrader 5 account types, including Hedging and Netting models, ECN, Raw Spread, and standard accounts. Low-spread environments are recommended to maximize ATR risk-to-reward efficiency.
- Terminal Configuration: Enable 'Allow WebRequest' if external integrations are applied, ensure 'Market Watch' contains the required symbols, and verify mobile MetaQuotes ID setup within terminal options if push alerts are desired.
Comprehensive Input Parameters Documentation
1. Scanner Settings
- InpSymbols (Default: "EURUSD,GBPUSD,USDJPY,AUDUSD,USDCAD,USDCHF,NZDUSD,EURJPY,GBPJPY,XAUUSD"): Comma-separated list of symbols to scan when InpUseWatch is disabled.
- InpTimeframes (Default: "M5,M15,M30,H1,H4"): Comma-separated list of operational timeframes to monitor simultaneously. Supported: M1 to MN1.
- InpUseWatch (Default: true): Enables scanning of all symbols visible in Market Watch, overriding InpSymbols when set to true.
- InpMaxSymbols (Default: 10): Maximum number of symbols scanned concurrently to prevent hardware overloading.
- InpScanSec (Default: 7): Execution timer interval in seconds between comprehensive multi-pair and multi-timeframe scan passes.
- InpBarsCopy (Default: 100): Candlestick history depth copied into internal arrays for indicator and filter calculations.
- InpLookback (Default: 100): Maximum historical bar search limit to locate the most recent confirmed Chaikin Oscillator zero-cross.
- InpDirection (Default: 0): Directional signal filter. 0 = Both directions, 1 = Buy signals only, 2 = Sell signals only.
2. Chaikin Oscillator (Entry Trigger) Parameters
- FastPeriod (Default: 3): Averaging period for the fast Exponential Moving Average applied to the Accumulation/Distribution Line.
- SlowPeriod (Default: 10): Averaging period for the slow Exponential Moving Average applied to the Accumulation/Distribution Line.
- MaMethod (Default: MODE_EMA): Smoothing calculation method applied to the Accumulation/Distribution moving average curves.
- AppliedVolume (Default: VOLUME_TICK): Volume metric utilized for calculations (VOLUME_TICK for Forex/CFD, VOLUME_REAL for exchange assets).
3. ATR Stop Loss & Take Profit Parameters
- InpATRPeriod (Default: 14): Averaging period for Average True Range indicator quantifying instantaneous asset volatility.
- InpATRMultSL (Default: 1.5): Multiplier applied to ATR to determine Stop Loss distance from entry price.
- InpTP1_RR (Default: 1.0): Risk-to-reward ratio multiplier defining Take Profit 1 level relative to Stop Loss distance (1.0 = 1:1 RR).
- InpTP2_RR (Default: 2.0): Risk-to-reward ratio multiplier defining Take Profit 2 level relative to Stop Loss distance (2.0 = 2:1 RR).
4. Alerts & Notifications Settings
- InpAlertPopup (Default: false): Enables native MetaTrader modal popup dialog alerts upon verified signal confirmation.
- InpAlertSound (Default: false): Triggers an acoustic sound alert upon signal registration.
- InpSoundFile (Default: "alert.wav"): Audio file located in the terminal Sounds directory triggered during sound alerts.
- InpAlertPush (Default: false): Sends mobile push notifications to smartphone terminals linked via MetaQuotes ID.
- InpAlertEmail (Default: false): Dispatches formatted email notifications containing signal parameters via terminal SMTP.
- InpEmailSubject (Default: "CHO Scanner Signal"): Subject header prefix appended to outgoing email alert messages.
- InpAlertOnlyNew (Default: false): Restricts alerts exclusively to newly formed signals on closed Bar 1, avoiding repeated historical alerts.
5. Dashboard Display & Layout Settings
- InpX (Default: 12): Horizontal pixel coordinate of dashboard upper-left corner relative to chart origin.
- InpY (Default: 28): Vertical pixel coordinate of dashboard upper-left corner relative to chart origin.
- InpScale (Default: 100): Graphical scaling percentage (70% to 180%) accommodating various monitor resolutions and High-DPI displays.
- InpRowH (Default: 18): Base vertical row height in pixels for table records prior to scaling adjustments.
- InpFont (Default: 8): Base font size in points applied across dashboard tabular text and labels.
- InpPadX (Default: 8): Horizontal padding in pixels applied to panel margins and column contents.
- InpWPair (Default: 68): Width in pixels allocated for the asset symbol column.
- InpWTF (Default: 34): Width in pixels allocated for the timeframe identification column.
- InpWArah (Default: 44): Width in pixels allocated for the directional indicator column (BUY / SELL).
- InpWTime (Default: 96): Width in pixels allocated for signal timestamp strings.
- InpWEntry (Default: 64): Width in pixels allocated for confirmed entry prices.
- InpWSL (Default: 64): Width in pixels allocated for calculated Stop Loss prices.
- InpWTP1 (Default: 64): Width in pixels allocated for Take Profit 1 prices.
- InpWTP2 (Default: 64): Width in pixels allocated for Take Profit 2 prices.
- InpWCHO (Default: 52): Width in pixels allocated for numerical Chaikin Oscillator values.
- InpWUmur (Default: 42): Width in pixels allocated for elapsed signal age displays.
- InpWOpen (Default: 44): Width in pixels allocated for interactive chart navigation buttons.
- InpShowEmpty (Default: false): Displays rows for pairs/timeframes without active signals when enabled.
- InpMaxRows (Default: 18): Maximum number of visible data rows rendered simultaneously to manage screen space.
6. Sorting Settings
- InpSortBy (Default: SORT_TIME): Column criteria used for ordering table records (SORT_TIME, SORT_PAIR, SORT_TF, SORT_DIR).
- InpSortNewest (Default: true): Orders table rows in descending order (newest signals or descending values prioritized first).
7. Chart Visualization (Active Signal Overlay)
- InpDrawOnChart (Default: true): Renders technical trade levels directly on the active chart for the selected symbol/timeframe.
- InpShowArrow (Default: true): Plots directional Wingdings arrows at the confirmed signal bar and execution price.
- InpShowLevels (Default: true): Plots visual horizontal trendlines for Entry, Stop Loss, Take Profit 1, and Take Profit 2 levels.
- InpExtendBars (Default: 25): Number of candlesticks to the right across which trade level lines are projected.
- InpArrowCodeBuy (Default: 233): Wingdings character code for bullish Buy entry arrows.
- InpArrowCodeSell (Default: 234): Wingdings character code for bearish Sell entry arrows.
- InpArrowSize (Default: 2): Visual thickness and size of plotted signal arrows.
- InpArrowDistance (Default: 15): Point offset distance separating the arrow marker from candlestick highs or lows.
8. Color Scheme Parameters
- InpColBg (Default: C'18,22,28'): Background fill color for the primary dashboard window.
- InpColHead (Default: C'32,38,48'): Background fill color for table header and operational buttons.
- InpColRow (Default: C'24,28,36'): Primary background shade applied to alternating table data rows.
- InpColRow2 (Default: C'28,33,42'): Secondary contrasting background shade applied to alternating table data rows.
- InpColText (Default: C'220,225,230'): Text foreground color for symbol names, timeframes, and general text.
- InpColBull (Default: C'0,200,83'): Emerald green accent color signifying bullish directional bias.
- InpColBear (Default: C'255,82,82'): Coral red accent color signifying bearish directional bias.
- InpColMute (Default: C'120,128,140'): Muted slate color for secondary status text, borders, and inactive fields.
- InpColAccent (Default: C'41,98,255'): Royal blue accent color for title headers, sort indicators, and navigation buttons.
- InpColArrowBuy (Default: C'0,230,118'): Color tone applied to on-chart bullish Buy arrows.
- InpColArrowSell (Default: C'255,82,82'): Color tone applied to on-chart bearish Sell arrows.
- InpColEntry (Default: C'41,98,255'): Color tone applied to on-chart Entry level lines and labels.
- InpColSL (Default: C'255,82,82'): Color tone applied to on-chart Stop Loss level lines and labels.
- InpColTP1 (Default: C'0,200,83'): Color tone applied to on-chart Take Profit 1 level lines and labels.
- InpColTP2 (Default: C'0,230,118'): Color tone applied to on-chart Take Profit 2 level lines and labels.
Modular Multi-Filter Suite Architecture
The dashboard connects with an internal modular filtering suite (MultiFilterSuite) designed to validate volume momentum against structural technical criteria without disclosing private internal proprietary parameters:
- Relative Strength Index Cross Filter (RSI-X): Validates momentum progression by verifying relative strength direction and baseline boundary interactions.
- Average Directional Index Filter (ADX): Measures directional conviction, requiring trend intensity readings to satisfy structural activity thresholds.
- Moving Average Baseline Filter (MA): Confirms broader directional alignment by evaluating price closes relative to a dynamic Moving Average baseline.
- Ichimoku Kinko Hyo Filter (ICHI): Verifies price relationship relative to equilibrium Kumo Cloud boundaries and Tenkan/Kijun orientation.
- RSI Overbought/Oversold Filter (RSI75): Mitigates counter-trend vulnerability by screening out entries occurring within extreme momentum saturation bands.
- Dual Moving Average Filter (2MA): Assesses medium-term market trajectory through fast and slow moving average alignment states.
- Awesome Oscillator Filter (AO): Analyzes momentum distribution using Bill Williams Awesome Oscillator histogram coloration and baseline polarity.
- Parabolic SAR Dynamic Filter (SAR): Evaluates trailing acceleration to confirm stop-and-reverse dot placement relative to the active price wave.
- Heiken Ashi Smoothing Filter (HA): Analyzes synthetic price coloration to filter erratic market noise during low-liquidity consolidations.
- Commodity Channel Index Zero Filter (CCI): Confirms cyclical momentum displacement relative to statistical equilibrium zero levels.
- CCI Extreme Boundary Filter (CCI-OS): Restricts late trade entries when cyclical price oscillations reach overextended boundary zones.
- Relative Vigor Index Filter (RVI): Evaluates closing price tendencies relative to daily ranges using normalized oscillator calculations.
- RVI Signal Line Cross Filter (RVI-S): Requires affirmative signal line crossovers within the RVI matrix to validate momentum expansion.
- MACD Histogram Baseline Filter (MACD): Ensures MACD histogram bars align favorably with the primary trade direction.
- MACD Zero-Cross Filter (MACD0): Validates that underlying MACD momentum has crossed into the positive or negative semi-plane.
- Support and Resistance Structure Filter (SR): Evaluates price clearance relative to recent swing boundaries, ensuring sufficient runway to targets.
- Fibonacci Retracement Filter (FIB): Validates entry location within structural ratio retracement zones across recent price swings.
Interactive GUI Controls & Navigation Guide
- Drag-and-Drop Repositioning: Click and drag anywhere along the dashboard header bar to reposition the panel across the terminal canvas. Precise pixel coordinates are stored in terminal global variables and persist automatically across restarts.
- Window State Minimization (MIN / MAX): Click the MIN button to collapse the table into a compact status bar, preserving chart space for discretionary charting. Click MAX to restore the complete multi-column monitoring overview.
- Interactive Sorting Buttons: Click directly on PAIR, TF, DIR, or TIME column headers to reorder rows instantly. Clicking the same header twice toggles between ascending and descending order, displaying visual caret markers (^ / v).
- One-Click Symbol & Timeframe Switching (OPEN Button): Each active signal row features an interactive OPEN button. Clicking this button immediately redirects the chart to the designated symbol and timeframe, setting chart mode to candlesticks and plotting exact Entry, SL, and TP levels.
- Instant Refresh Command (REFRESH Button): Forces an immediate re-initialization of symbol lists, timeframe arrays, indicator handles, and memory buffers, executing a clean algorithmic scan pass.
- Panel Cleanup Utility (CLEAR Button): Removes all dashboard graphical objects from the chart window in a single click.
Performance Optimization & Resource Management
Multi-symbol and multi-timeframe scanning across historical bars requires efficient technical architecture. Chaikin Oscillator Scanner Dashboard employs several algorithmic safeguards:
- Pre-Cached Indicator Handle Architecture: All technical indicator handles (Chaikin Oscillator, ATR, and Filter Suite components) are allocated and initialized once inside an indexed array structure. Handles are reused continuously during timer events rather than recreated on every tick, eliminating memory fragmentation.
- Controlled Timer Execution: Scanning operates on an asynchronous timer loop (governed by InpScanSec) rather than calculating on every incoming market tick. This decouples CPU consumption from high-frequency tick streams.
- Configurable Historical Lookback Cap: InpBarsCopy and InpLookback allow traders to restrict historical processing depth to the necessary operational window (e.g., 50 to 100 bars), drastically reducing buffer memory footprint.
- Symbol Throttling: The InpMaxSymbols parameter enables users on laptops or lower-specification Virtual Private Servers (VPS) to cap concurrent processing.
- Clean Handle Deallocation: The OnDeinit handler systematically releases all indicator handles and deletes graphical objects, preventing resource leaks upon chart removal or profile switching.
Risk Disclaimer
Trading foreign exchange, precious metals, commodities, indices, and financial derivatives involves substantial risk of capital loss and may not be suitable for all investors. The high degree of leverage associated with financial instruments can work against you as well as for you. Past performance, backtesting observations, or historical indicator signals do not ensure or predict future outcomes.
This software is an analytical scanner utility developed strictly for informational and technical assistance purposes. It does not provide financial advice, automated trade execution, or prospective return claims. Users are strongly advised to thoroughly test the software on a MetaTrader 5 demo account under various market conditions before deploying it in live trading environments. Always exercise disciplined risk management, position sizing, and independent market judgment.