Bollinger Band Breakout MultiFilter PRO Signal MT5

Bollinger Band Breakout MultiFilter PRO Signal MT5


1. Overview and Operational Purpose

Bollinger Band Signal MultiFilter MT5 is an analytical technical indicator developed for the MetaTrader 5 terminal, designed to detect volatility expansion breakouts while filtering market noise through an extensive modular array of quantitative secondary filters. In dynamic market environments, classic envelope breakouts frequently encounter false continuations during low-momentum ranges or trend exhaustion phases. This indicator resolves that operational challenge by enforcing a strict candle-piercing breakout requirement and subjecting each prospective signal to user-selected technical filters before plotting chart markers and transmitting execution alerts.


The primary objective of the software is to provide systematic traders with an objective, rule-based execution and scanning tool. Rather than locking users into a rigid black-box strategy, the system provides sixteen independent confirmation modules, covering momentum oscillators, directional baseline moving averages, dynamic support and resistance channels, and algorithmic Fibonacci swing projections. The program executes natively within MetaTrader 5 using optimized indicator handles, ensuring swift calculation times, low memory overhead, and straightforward compatibility with automated Expert Advisors via custom indicator buffers.


2. Operating Principle and Signal Generation Logic

The calculation engine operates via a two-tier verification structure: primary Bollinger Band boundary piercing followed by multi-filter confirmation logic.


Primary Bollinger Bands Breakout Logic:

The base engine calculates standard Bollinger Bands envelopes based on user-defined period, deviation multiplier, and applied price parameters:

- Middle Band: Simple Moving Average (SMA) of the designated price source across the calculation period.

- Upper Band: Middle Band + (Standard Deviation * Deviation Multiplier).

- Lower Band: Middle Band - (Standard Deviation * Deviation Multiplier).


A primary trigger requires specific candle geometry relative to the volatility bands:

- Bullish Signal Condition: The current candle must be a bullish bar where the closing price exceeds the opening price (Close[i] > Open[i]), the closing price closes strictly above the Upper Band (Close[i] > UpperBuffer[i]), and the candle low price remains at or below the Upper Band (Low[i] <= UpperBuffer[i]). This ensures the candle body actively penetrated and closed beyond the upper envelope during the formation period.

- Bearish Signal Condition: The current candle must be a bearish bar where the closing price is below the opening price (Close[i] < Open[i]), the closing price closes strictly below the Lower Band (Close[i] < LowerBuffer[i]), and the candle high price remains at or above the Lower Band (High[i] >= LowerBuffer[i]). This ensures the candle body actively penetrated and closed beyond the lower envelope during the formation period.


Repaint Behavior and Calculation Characteristics:

- Historical Calculation: On closed historical bars (bar index 1 and older), all calculations, buffer arrays, and signal arrows are locked and non-repainting. Once a candle completes its duration and closes, signal arrows remain fixed in their respective buffers and will not shift, disappear, or recalculate.

- Real-Time Processing: On the live active bar (bar index 0 / rates_total - 1), calculations refresh on incoming price ticks to reflect real-time price evolution. To prevent multiple alerts during active bar formation, the internal notification system logs candle open timestamps (last_buy_alert and last_sell_alert) and broadcasts notifications once per qualifying candle horizon.


3. Detailed Technical Specification of the 16 Filter Engines

Each filter module operates independently and can be toggled via input parameters. When enabled, a filter applies a mandatory boolean validation check that must evaluate to true concurrently with the primary breakout:


- RSI Cross Filter: Evaluates momentum boundary re-entry using the Relative Strength Index. For a BUY signal, current RSI must cross above the oversold boundary while having traded below or equal to it on the previous bar (RSI[i] > Oversold and RSI[i-1] <= Oversold). For a SELL signal, current RSI must cross below the overbought threshold from above (RSI[i] < Overbought and RSI[i-1] >= Overbought). This identifies directional impulse emerging directly from boundary zones.

- ADX Trend Strength Filter: Employs the Average Directional Index to quantify directional momentum. Both BUY and SELL signals require the ADX line to equal or exceed the minimum threshold (ADX[i] >= ADX_Min_Level). When the market enters low-volatility consolidation below this threshold, all breakout triggers are suppressed.

- Single Moving Average Filter: Enforces baseline trend direction. Bullish breakouts are validated only when the closing price trades above the moving average line (Close[i] > MA[i]). Bearish breakdowns require the closing price to trade below the moving average line (Close[i] < MA[i]).

- Ichimoku Senkou Span B Filter: Utilizes the equilibrium boundary of the Ichimoku Kinko Hyo system. The algorithm extracts the historical Senkou Span B buffer with a defined forward projection shift (default 26 bars), evaluating the active cloud boundary at the current bar index (SenkouB[i - Shift]). A BUY signal requires price to trade strictly above the active Span B level, while a SELL signal requires price to trade strictly below it.

- RSI 75 Filter: Employs an extended period (default 75) Relative Strength Index as a macro trend regime discriminator. BUY signals are confirmed only when the macro RSI maintains a position above the 50.0 equilibrium level (RSI75[i] > 50.0). SELL signals require the macro RSI to trade below the 50.0 level (RSI75[i] < 50.0).

- Double Moving Average Filter: Uses a dual moving average arrangement (Fast MA and Slow MA) to confirm established trend alignment. A BUY trigger requires the faster moving average to trade above the slower moving average (MA_A[i] > MA_B[i]). Conversely, a SELL trigger requires the faster moving average to trade below the slower moving average (MA_A[i] < MA_B[i]).

- Awesome Oscillator (AO) Filter: Features three distinct, selectable momentum validation modes calculated from the median price difference:

  1. AO Volume Threshold: Enforces minimum momentum magnitude. BUY requires AO[i] >= AO_Buy_Min; SELL requires AO[i] <= AO_Sell_Max.

  2. AO Color Slope: Enforces directional acceleration. BUY requires current AO to exceed previous AO (AO[i] > AO[i-1]); SELL requires current AO to be below previous AO (AO[i] < AO[i-1]).

  3. AO Zero-Line Confirmation: Enforces directional alignment with positive or negative momentum. BUY requires AO to be rising above zero (AO[i] > AO[i-1] and AO[i] > 0); SELL requires AO to be falling below zero (AO[i] < AO[i-1] and AO[i] < 0).

- Parabolic SAR Filter: Integrates the trailing directional parabolic stop-and-reverse system. Bullish breakouts require the closing price to be located above the current Parabolic SAR point (Close[i] > SAR[i]). Bearish breakdowns require the closing price to be located below the SAR point (Close[i] < SAR[i]).

- Heiken Ashi Trend Filter: Calculates synthetic Heiken Ashi candles internally to smooth out intra-bar noise. A BUY signal requires a bullish Heiken Ashi candle body (HA_Close[i] > HA_Open[i]). A SELL signal requires a bearish Heiken Ashi candle body (HA_Close[i] < HA_Open[i]).

- CCI Trend Filter: Uses the Commodity Channel Index as a zero-line directional baseline. A BUY signal is valid only when the CCI trades above zero (CCI[i] > 0.0), indicating positive price distribution relative to statistical mean. A SELL signal requires CCI to trade below zero (CCI[i] < 0.0).

- CCI Overbought & Oversold Filter: Leverages extreme statistical deviations to confirm breakout velocity. A BUY signal requires CCI to actively penetrate into or above the overbought boundary (CCI_OBOS[i] > CCI_Overbought, default +100). A SELL signal requires CCI to penetrate into or below the oversold boundary (CCI_OBOS[i] < CCI_Oversold, default -100).

- RVI Trend Filter: Utilizes the Relative Vigor Index to assess whether prices close higher or lower relative to their intra-bar ranges. A BUY trigger requires RVI to maintain a reading above zero (RVI[i] > 0.0). A SELL trigger requires RVI to maintain a reading below zero (RVI[i] < 0.0).

- RVI Signal Line Filter: Compares the main RVI calculation with its smoothed 4-period symmetric weighted signal line. A BUY signal requires the main RVI line to trade above the signal line (RVI_Main[i] > RVI_Sig[i]). A SELL signal requires the main RVI line to trade below the signal line (RVI_Main[i] < RVI_Sig[i]).

- MACD Signal Filter: Evaluates the relationship between the MACD main line and the MACD signal line (histogram differential). A BUY signal requires the histogram to be positive (MACD_Main[i] - MACD_Signal[i] > 0.0). A SELL signal requires the histogram to be negative (MACD_Main[i] - MACD_Signal[i] < 0.0).

- MACD Level 0 Filter: Employs the MACD main line relative to the absolute zero center line. A BUY signal requires the MACD main line to trade above zero (MACD_Main[i] > 0.0). A SELL signal requires the MACD main line to trade below zero (MACD_Main[i] < 0.0).

- Support & Resistance Filter: Scans past price bars over a user-defined lookback period (SR_Period) to determine the absolute high resistance and absolute low support boundaries. The engine establishes a dynamic price buffer around each level (SR_Zone_Points * Point). A BUY signal requires price action to interact with or bounce from the designated support zone. A SELL signal requires price action to interact with or test the designated resistance zone.

- Fibonacci Retracement Filter: Integrates an algorithmic swing recognition function (GetLastSwingPoints) that scans historical bars using ZigZag depth, deviation, and backstep rules. Upon identifying the most recent swing high and swing low, the algorithm calculates key Fibonacci retracement levels (default 38.2% and 61.8%). A signal is validated only if the candle range intersects the calculated Fibonacci confluence zone.


4. Complete Input Parameters Documentation

Every parameter declared within the indicator script is documented below with its default value, data type, and functional definition:


Bollinger Bands Settings:

- InpPeriod (Default: 20, Type: int): Lookback period used to calculate the Bollinger Bands moving average baseline.

- InpDeviation (Default: 0.5, Type: double): Standard deviation multiplier determining the width of the upper and lower bands.

- InpPrice (Default: PRICE_CLOSE, Type: ENUM_APPLIED_PRICE): Applied price data used in Bollinger Band calculations.

- InpBandColor (Default: clrRed, Type: color): Chart display color for the Upper, Middle, and Lower band lines.


Signal & Arrow Display Settings:

- InpBuyColor (Default: clrAqua, Type: color): Color of bullish BUY signal arrow markers drawn on the chart.

- InpSellColor (Default: clrRed, Type: color): Color of bearish SELL signal arrow markers drawn on the chart.

- InpArrowShift (Default: 30, Type: int): Vertical distance in points between arrow markers and candle High/Low prices.


Alerts & Notification Settings:

- InpAlert (Default: true, Type: bool): Enables on-screen pop-up alert dialog boxes inside MetaTrader 5.

- InpSound (Default: true, Type: bool): Enables audible sound playback upon confirmed signal generation.

- InpPush (Default: false, Type: bool): Enables push notifications sent to mobile terminals via MetaQuotes ID.

- InpPrintLog (Default: true, Type: bool): Writes detailed signal information into the terminal Experts log tab.

- InpBuySound (Default: "ok.wav", Type: string): Filename of the audio file played for BUY signals (located in terminal Sounds folder).

- InpSellSound (Default: "timeout.wav", Type: string): Filename of the audio file played for SELL signals (located in terminal Sounds folder).


RSI Cross Filter Settings:

- Use_RSI_Cross_Filter (Default: false, Type: bool): Toggles the RSI boundary crossover confirmation filter.

- RSI_Length (Default: 14, Type: int): Averaging period for the Relative Strength Index.

- RSI_Price_Source (Default: PRICE_CLOSE, Type: ENUM_APPLIED_PRICE): Applied price source for RSI computation.

- Oversold (Default: 30.0, Type: double): Lower boundary threshold required for bullish crossover validation.

- Overbought (Default: 70.0, Type: double): Upper boundary threshold required for bearish crossover validation.


ADX Filter Settings:

- Use_ADX_Filter (Default: false, Type: bool): Toggles the Average Directional Index trend strength filter.

- ADX_Period (Default: 10, Type: int): Calculation period for the ADX indicator engine.

- ADX_Min_Level (Default: 20.0, Type: double): Minimum directional index value required to validate any breakout signal.


Single Moving Average Filter Settings:

- Use_MA_Filter (Default: false, Type: bool): Toggles the baseline moving average trend direction filter.

- MA_Period (Default: 50, Type: int): Averaging lookback period for the moving average.

- MA_Method (Default: MODE_SMA, Type: ENUM_MA_METHOD): Moving average smoothing method (SMA, EMA, SMMA, LWMA).

- MA_Shift (Default: 0, Type: int): Horizontal bar shift applied to the moving average series.


Ichimoku Senkou Span B Filter Settings:

- Use_Ichimoku_Filter (Default: false, Type: bool): Toggles the Ichimoku Senkou Span B cloud boundary filter.

- Ichimoku_SenkouB (Default: 52, Type: int): Lookback period used to calculate the Senkou Span B baseline.

- Ichimoku_Shift (Default: 26, Type: int): Horizontal shift parameter aligning Span B with the active bar.


RSI 75 Filter Settings:

- Use_RSI75_Filter (Default: false, Type: bool): Toggles the long-period macro cycle RSI filter.

- RSI_Filter_Period (Default: 75, Type: int): Calculation lookback period for macro RSI evaluation.


Double Moving Average Filter Settings:

- Use_DoubleMA_Filter (Default: false, Type: bool): Toggles dual moving average trend alignment filtering.

- MA_A_Period (Default: 30, Type: int): Calculation period for faster moving average line A.

- MA_A_Method (Default: MODE_EMA, Type: ENUM_MA_METHOD): Smoothing calculation method for moving average A.

- MA_A_Applied (Default: PRICE_CLOSE, Type: ENUM_APPLIED_PRICE): Applied price source for moving average A.

- MA_A_Shift (Default: 0, Type: int): Horizontal bar offset for moving average A.

- MA_B_Period (Default: 140, Type: int): Calculation period for slower moving average line B.

- MA_B_Method (Default: MODE_EMA, Type: ENUM_MA_METHOD): Smoothing calculation method for moving average B.

- MA_B_Applied (Default: PRICE_CLOSE, Type: ENUM_APPLIED_PRICE): Applied price source for moving average B.

- MA_B_Shift (Default: 0, Type: int): Horizontal bar offset for moving average B.


Awesome Oscillator (AO) Settings:

- Use_AO_Filter (Default: false, Type: bool): Master toggle for Awesome Oscillator momentum validation.

- Use_AO_Volume_Filter (Default: false, Type: bool): Activates minimum momentum magnitude threshold validation.

- AO_Buy_Min (Default: 4.0, Type: double): Minimum oscillator value required to confirm a BUY signal.

- AO_Sell_Max (Default: -4.0, Type: double): Maximum negative oscillator value required to confirm a SELL signal.

- Use_AO_Color_Filter (Default: false, Type: bool): Enforces momentum bar slope direction (rising for BUY, falling for SELL).

- Use_AO_Zero_Filter (Default: false, Type: bool): Enforces oscillator positioning relative to zero combined with bar slope.


Parabolic SAR Settings:

- Use_SAR_Filter (Default: false, Type: bool): Toggles the Parabolic SAR trailing trend filter.

- SAR_Step (Default: 0.02, Type: double): Acceleration factor step increment.

- SAR_Maximum (Default: 0.2, Type: double): Maximum allowable acceleration factor cap.


Heiken Ashi Settings:

- Use_HeikenAshi_Filter (Default: false, Type: bool): Toggles the internal synthetic Heiken Ashi bar filter.


CCI Trend Settings:

- Use_CCI_Filter (Default: false, Type: bool): Toggles the standard zero-line CCI directional filter.

- CCI_Period (Default: 50, Type: int): Calculation lookback period for trend CCI.

- CCI_Applied (Default: PRICE_CLOSE, Type: ENUM_APPLIED_PRICE): Applied price source for trend CCI.


CCI Overbought & Oversold Settings:

- Use_CCI_OBOS_Filter (Default: false, Type: bool): Toggles extreme momentum boundary CCI filtering.

- CCI_OBOS_Period (Default: 14, Type: int): Calculation lookback period for momentum CCI.

- CCI_OBOS_Applied (Default: PRICE_CLOSE, Type: ENUM_APPLIED_PRICE): Applied price source for momentum CCI.

- CCI_Overbought (Default: 100.0, Type: double): Upper threshold boundary required for BUY confirmation.

- CCI_Oversold (Default: -100.0, Type: double): Lower threshold boundary required for SELL confirmation.


RVI Trend Settings:

- Use_RVI_Filter (Default: false, Type: bool): Toggles zero-line Relative Vigor Index trend filtering.

- RVI_Period (Default: 75, Type: int): Calculation lookback period for trend RVI.


RVI Signal Settings:

- Use_RVI_Signal_Filter (Default: false, Type: bool): Toggles RVI main vs signal line crossover filtering.

- RVI_Signal_Period (Default: 20, Type: int): Calculation lookback period for signal line RVI.


MACD Signal & Zero Settings:

- Use_MACD_Filter (Default: false, Type: bool): Toggles MACD histogram directional filtering.

- MACD_FastEMA (Default: 12, Type: int): Averaging period for fast exponential moving average.

- MACD_SlowEMA (Default: 26, Type: int): Averaging period for slow exponential moving average.

- MACD_SignalSMA (Default: 9, Type: int): Averaging period for MACD signal line.

- MACD_Applied (Default: PRICE_CLOSE, Type: ENUM_APPLIED_PRICE): Applied price source for MACD computation.

- Use_MACD_Zero_Filter (Default: false, Type: bool): Toggles MACD baseline zero-level filtering.


Support & Resistance Settings:

- Use_SR_Filter (Default: false, Type: bool): Toggles dynamic support and resistance zone filtering.

- SR_Period (Default: 50, Type: int): Historical lookback window used to identify extreme price highs and lows.

- SR_Zone_Points (Default: 80, Type: double): Proximity boundary thickness in points surrounding identified levels.


Fibonacci Confluence Settings:

- Use_Fib_Filter (Default: false, Type: bool): Toggles dynamic ZigZag swing Fibonacci retracement filtering.

- Fib_Level_1 (Default: 0.382, Type: double): Primary Fibonacci ratio determining outer confluence boundary.

- Fib_Level_2 (Default: 0.618, Type: double): Secondary Fibonacci ratio determining inner confluence boundary.

- ZigZag_Depth (Default: 12, Type: int): Minimum bar lookback parameter for swing point identification.

- ZigZag_Deviation (Default: 5, Type: int): Minimum price deviation in points required to register a swing vertex.

- ZigZag_Backstep (Default: 3, Type: int): Minimum bar separation required between consecutive swing vertices.


5. Strategic Configurations and Analytical Presets

To assist traders in configuring the indicator across varying market regimes, four structured setup profiles are outlined below:


Configuration 1: Volatility Breakout with Trend Momentum Confirmation

- Intended Market Profile: Trending instruments experiencing contraction-to-expansion transitions.

- Recommended Setup: Bollinger Bands (Period: 20, Dev: 0.5 or 1.0), Single MA Filter (Period: 50, Method: EMA), ADX Filter (Period: 14, Min Level: 22.0).

- Operational Logic: Breakout signals beyond the bands are permitted only when the market trades on the correct side of the 50 EMA and ADX confirms sufficient trend strength, filtering out non-directional consolidation phases.


Configuration 2: Structural Key-Level Price Action Breakout

- Intended Market Profile: Rejection and continuation setups occurring around major historical inflection zones.

- Recommended Setup: Bollinger Bands (Period: 20, Dev: 0.5), Support & Resistance Filter (Period: 50, Zone: 100 points), Fibonacci Filter (Depth: 12, Dev: 5, Backstep: 3, Levels: 0.382 and 0.618).

- Operational Logic: Requires the breakout candle to interact with identified horizontal support/resistance levels or key Fibonacci golden ratio zones, ensuring technical confluence prior to signal generation.


Configuration 3: Multi-Oscillator Momentum Surge

- Intended Market Profile: Aggressive intra-day breakout trading during high-liquidity market sessions.

- Recommended Setup: Bollinger Bands (Period: 20, Dev: 0.5), MACD Signal Filter (Default 12, 26, 9), Awesome Oscillator Filter (Color Filter: true, Zero Filter: true), Heiken Ashi Filter: true.

- Operational Logic: Demands simultaneous agreement across MACD histogram expansion, Awesome Oscillator acceleration, and synthetic Heiken Ashi directional coloring to validate the volatility breakout.


Configuration 4: Macro Trend and Equilibrium Alignment

- Intended Market Profile: Higher-timeframe swing trading focused on multi-layered institutional baselines.

- Recommended Setup: Bollinger Bands (Period: 20, Dev: 0.5), Ichimoku Senkou Span B Filter (Span B: 52, Shift: 26), RSI 75 Filter (Period: 75), Parabolic SAR Filter (Step: 0.02, Max: 0.2).

- Operational Logic: Signals require market price to trade above the active Ichimoku cloud baseline, long-period RSI to maintain a position above 50, and Parabolic SAR to align underneath price for bullish breakout confirmation.


6. Technical Specifications, Buffer Architecture and Compatibility

- Platform Compatibility: Native MetaTrader 5 (MT5).

- Applicable Instruments: Forex Currency Pairs, Precious Metals (XAUUSD, XAGUSD), Crude Oil, Equity Indices, and Liquid Cryptocurrencies.

- Supported Timeframes: Operates across all standard MT5 timeframes (M1, M5, M15, M30, H1, H4, D1). Lower timeframes (M1-M15) are commonly utilized for intra-day scanning, while higher timeframes (H1-D1) provide macro confluence.

- Account Types: Fully functional on both Hedging and Netting account modes across Standard, ECN, and Raw Spread execution environments.


Buffer Allocation for Expert Advisor (EA) Integration:

Developers can interface with the indicator via standard MQL5 iCustom function calls. The indicator exposes five data buffers:

- Buffer Index 0: Upper Bollinger Band line series (double).

- Buffer Index 1: Middle Bollinger Band line series (double).

- Buffer Index 2: Lower Bollinger Band line series (double).

- Buffer Index 3: Bullish BUY Signal Arrow (double; contains price value on signal candle, EMPTY_VALUE otherwise).

- Buffer Index 4: Bearish SELL Signal Arrow (double; contains price value on signal candle, EMPTY_VALUE otherwise).


Computational Efficiency and Resource Management:

The indicator is engineered using event-driven OnCalculate routines with prev_calculated bar indexing. Historical bars are computed once during initialization, while subsequent incoming ticks only update the active bar sequence. This architecture maintains minimal terminal CPU and memory footprints even when all sixteen filters are activated concurrently.


7. Alerting, Notifications and Sound Diagnostics

The indicator incorporates an integrated multi-channel alerting framework:

- Terminal Pop-Up Alert: Generates a modal dialog box containing the asset symbol, timeframe, direction, and filter confirmation status.

- Sound Notification: Plays distinct audio alerts (ok.wav for BUY, timeout.wav for SELL) directly through the operating system audio interface. Audio files must reside in the standard Terminal_Data_Folder/Sounds/ directory.

- Mobile Push Notification: Dispatches real-time notifications to the trader's mobile MetaTrader 5 terminal on iOS or Android. Requires configuration of the trader's personal MetaQuotes ID under Tools -> Options -> Notifications.

- Terminal Journal Logging: Records timestamped execution logs in the Experts tab for audit trails and strategy diagnostics.


8. Installation and Operational Setup Guide

1. Launch the MetaTrader 5 terminal and open the data folder via File -> Open Data Folder.

2. Navigate to MQL5/Indicators/ and place the compiled indicator file into this directory.

3. Restart MetaTrader 5 or right-click the Indicators tree in the Navigator window and select Refresh.

4. Drag the indicator from the Navigator window onto your desired asset chart.

5. In the configuration window, adjust your preferred Bollinger Bands settings, enable required filter modules, and verify your notification choices.

6. Verify that 'Allow DLL imports' remains at default settings as this software relies strictly on native MQL5 algorithms and requires no external libraries.

7. Save your preferred configuration as a .set file within the Inputs tab for fast deployment across multiple charts.


9. Formal Risk Disclosure and Terms of Use

Trading foreign exchange, commodities, indices, and financial derivatives carries a substantial degree of risk and may not be suitable for all categories of investors. Leverage can magnify potential losses as well as gains. Past technical analysis performance and historical chart illustrations do not constitute a guarantee of future operational performance.


This software is an analytical and operational indicator engineered solely to assist traders with quantitative price evaluation and structured technical analysis; it does not provide automated financial recommendations or guarantee profitable outcomes. Users are strongly advised to evaluate the indicator thoroughly on a demo account in a simulated trading environment to understand its behavior, parameter sensitivities, and filter interactions before considering deployment in live market conditions.

추천 제품
CDC Trend Matrix
Peechanat Chatsermsak
The CDC Trend Matrix is a next-generation indicator that seamlessly combines trend detection with momentum insights, helping you spot optimal entry and exit zones at a glance. Its intuitive “zone” coloring immediately signals Bullish, Bearish, or Sideways market phases, while on-chart alerts keep you informed without cluttering your screen. Highlights Color-coded bars for instant trend zone recognition Clear BUY/SELL labels for precise action points Fully customizable settings to match your ri
Fibrillar
Vitalii Zakharuk
It is very easy to use the Fibrillar indicator, since the simplest is to look at the chart and act according to the indications of the colored arrows. The algorithm takes into account the measurement of prices, and this method also focuses on measuring each of the price drops (H / C, H / O, LC, LO) - which gives more detailed information, but also more averaged. When calculating this indicator, logarithmic gains are first calculated at the closing price, which allows you to filter out the tren
MACD FuturePredict Panel Pro MT5 MACD indicator for MT5 with non-repainting BUY/SELL arrows confirmed on candle close, a forward momentum projection, higher-timeframe filter and a 7-point signal score. Go Beyond the MACD Crossover A MACD crossover tells you momentum has changed. It does not tell you whether the trend agrees, whether the higher timeframe agrees, or whether the move has room to run. MACD FuturePredict Panel Pro answers those questions on one chart, so you can tell a strong setup
KillzoneLens - ICT Killzones for MT5 The ICT killzones are the hours when the big players move the market: the London open and the New York open above all. KillzoneLens draws them on your chart in the right place every day, converting New York time to your broker's server time automatically, including the US and European daylight-saving changes. Killzones (New York time, all adjustable) - Asian 20:00-00:00, London open 02:00-05:00, New York open 07:00-10:00, London close 10:00-12:00. - A colo
ZoneBlockX
M Fariz Haykal
5 (1)
ZoneBlockX — Smart Order Block Detector for MetaTrader 5 ZoneBlockX is a professional-grade supply and demand zone indicator for MetaTrader 5, built on the concept of Order Block detection. It automatically identifies high-probability reversal areas on the chart by locating institutional-style price zones where significant buying or selling activity has previously occurred. Designed for traders who rely on price action and market structure, ZoneBlockX provides a structured and objective view of
Donchian Dawn
Teng Fei Zhu
Donchian Dawn Breakout System My other products: https://www.mql5.com/zh/users/bitksk/seller 1. What Problem Does It Solve Manually identifying trend breakouts often relies on subjective judgment and lacks consistency. This indicator programmatically and visually implements the Donchian channel breakout logic, solving three core problems: Signal Standardization : Automatically generates arrow signals when the price breaks through the upper or lower band of the dynamic channel, eliminating subjec
FREE
Vertex Structure Dashboard delivers a complete multi-timeframe market structure analysis in a single, compact panel. It monitors up to 9   timeframes simultaneously and displays trend bias, structural breaks, momentum, and value zones in real time — no tab-switching, no manual   tracking.   The panel is fully draggable and collapsible. Its position persists across timeframe changes through GlobalVariables, so your layout stays   exactly where you placed it.   How It Works   Each enabled tim
Mean Reversion Breakout MT5
Christopher Graham Parish
!! FLASH SALE !!   Over 80% off !!     For ONE week only. Now only $47 - normally $297! >>>      Ends on 30 June 2023 - Don't miss it! Buy and Sell Arrows when price breaks away from mean price. Sends Alerts – On MT5 To Your Phone To Your Email Does not repaint . Works on any Forex pair, any timeframe. 10 Activations allowed so you are free from limitations >> MT4 Version Here For spreads from a tiny 0.1 pips RAW/ECN Accounts,  click here . Check out my Waka Esque EA signal here: >>   High
GP Confluence Scanner MT5 Advanced Multi-Timeframe Market Structure & Confluence Analysis Don't get stopped out easily again! GP Confluence Scanner MT5 is an advanced technical analysis indicator designed to reveal important market levels, hidden support and resistance, and multiple technical confluences before entering a setup. Rather than relying on a single indicator, GP Confluence Scanner examines multiple technical factors to identify areas where significant market reactions may occur. Key
SR Zones Sync
Hoang Phong Le
SR Zones Sync: Support & Resistance Zones with Break-on-Close Logic SR Zones Sync automatically draws support and resistance zones from swing pivots, then recolours them when price actually breaks through. Only a fully closed candle can break a zone, so wicks and the still-forming candle never trigger a false signal. How it works Zones are built by clustering swing highs and lows into price areas. Each zone’s thickness adapts to the average candle range. Each zone gets a role from its latest pi
Consecutive candles can give us an indication as to the strength of a trend. With this indicator, you can set the number of consecutive bull or bear candles you wish to be present before achieving a valid signal of RSI crossing into overbought or oversold. With this information, you can better judge if a continuation or reversal situation is about to present. RSI has two settable levels Interesting settings: Number of consecutive candles needed before a valid signal Overbought level of RSI Over
FREE
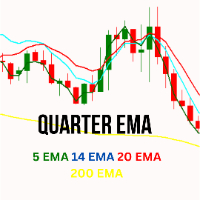
Quarter EMA
Jithin Sajan Sajan
Kindly rate and comment about the product for upgradation & Support The 5 EMA is plotted in green color ( Lime ). The 14 EMA is plotted in red color ( Red ). The 20 EMA is plotted in blue color ( Blue ). The 200 EMA is plotted in yellow color ( Yellow ). The Quarter EMA that provided calculates and plots four Exponential Moving Averages (EMAs) on the chart using different periods: 5, 14, 20, and 200. Each EMA is represented by a different color on the chart. Here's a description of each EMA:
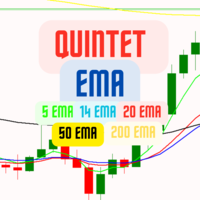
Quintet EMA
Jithin Sajan Sajan
Kindly rate and comment about the product for upgradation & Support The   5 EMA   is plotted in   green   color ( Lime ). The  14 EMA  is plotted in  red  color ( Red ). The   20 EMA   is plotted in   blue   color ( Blue ). The  200 EMA  is plotted in  black  color ( Black ). The   200 EMA   is plotted in   yellow   color ( Yellow ). The Quarter EMA that provided calculates and plots four Exponential Moving Averages (EMAs) on the chart using different periods: 5, 14, 20, and 200. Each EMA is
Mean Reversal Heikin Ashi Indicator calculates special trade reversal points based on Heikin Ashi candlesticks patterns. This indicator can be used on all symbols, even in Forex or B3 Brazillian Markets. You can configure just the position of each arrow. Then, after include the indicator on the graphic, pay attention on each arrow that indicates a long or short trade.
Confluence Scope
Brigetd Milena Mora Martinez
Confluence Scope consolidates four classic signal engines across up to nine timeframes into a single horizontal panel. It helps identify when momentum, strength and CCI alignment converge on the same direction.   FEATURES   - Four engines per timeframe: Stochastic, RSI, fast CCI entry, slow CCI trend - Nine timeframes from M1 to MN1, each independently toggleable - Per-timeframe verdict from MIXED up to four-star BUY or SELL - Adaptive panel that scales with the subwindow width - Native popup,
FREE
트레이딩 플로어에서 이익을 극대화하기 위한 최고의 도구인 TEI(Trend Enthusiasm Indicator)를 소개합니다. 이 혁신적인 지표는 추세 분석의 힘과 시장 정서의 흥분을 결합하여 끊임없이 변화하는 금융 시장에서 트레이더에게 고유한 우위를 제공합니다. TEI는 고급 알고리즘을 사용하여 금융 상품의 기본 추세와 트레이더의 열정을 분석하여 고수익 기회를 식별합니다. 이를 통해 트레이더는 추세와 트레이더 정서의 결합된 힘을 활용하여 최소한의 위험으로 일관된 수익을 보장할 수 있습니다. 노련한 프로이든 막 시작하든 TEI는 수입을 극대화하고 게임에서 앞서 나가고자 하는 모든 사람에게 이상적인 도구입니다. 오늘 그것을 시도하고 더 스마트하고 수익성 있는 거래를 시작하십시오! 표시기는 모든 시간대에서 작동하며 다시 칠하지 않습니다.
Gold M3 Doji Breakout H1 Gold M3 Doji Breakout H1 is an automated MetaTrader 5 Expert Advisor designed to identify a fixed M3 compression structure inside a closed H1 candle and evaluate a breakout during the following H1 trading window. This product is designed for Gold symbols. Its default absolute-price distances are not intended for Forex pairs, cryptocurrencies or stock indices. Position management The EA divides the position into three stages: - Stage 1 closes at the configured first
Regent Street
Icham Aidibe
Regent Street, rather than an expert or an indicator, is an all-in-one trading assistant easing your trading sessions by providing signals and notifications. It's an assistant rather than a robot - "an assisted steering rather than an autopilot", and now, it autoadjusts itself to any instrument, any timeframe & any circumstance. Note from the author: Regent Street's frontend is exactly the same as an other product Ermou Street , but the backend is different. Performances for each are very relati
VibeFox Squeeze Detector — 스퀴즈 압축, 모멘텀, 진입 지점 VibeFox Squeeze Detector는 MetaTrader 5를 위한 실시간 Squeeze Detector 지표입니다. 시장이 좁은 범위로 압축되는 구간을 식별하고 그 수면 아래에서 쌓여가는 모멘텀을 측정하므로, 시장이 속박에서 벗어나는 순간 곧바로 행동할 수 있습니다. 고전적인 스퀴즈 로직과 모멘텀 히스토그램은 별도의 하위 창에 표시되고, 진입 표시는 가격 차트 위에 바로 찍히며, 모든 컨트롤은 하나의 현대적인 인터랙티브 패널에 모여 있습니다. 지표가 측정하는 것 핵심 개념은 서로 다른 속도로 확장하고 수축하는 두 변동성 밴드의 비교입니다. Bollinger Bands 는 변동성에 빠르게 반응합니다. 이 밴드가 Keltner Channel 안쪽으로 좁아지면 시장은 스퀴즈에 들어간 것입니다——방향성 있는 움직임이 오기 전에 에너지가 축적되는 압축된 범위의 구간입니다. Bollinger Bands
The indicator for trading on the signals of the harmonic pattern AB=CD. It gives signals and shows the levels of entry into the market, as well as levels for placing stop orders, which allows the trader to make timely decisions on entering the market, as well as effectively manage positions and orders. It supports sending push notifications to a mobile device, e-mail, as well as alerts. This indicator has been ported from the version for MetaTrader 4. For more information, as well as a detailed
A Good , Easy , Readable and handy indicator for experienced and professional traders. It gives bounded signals between zero and one. Easy for investors to comprehend. It gives near and longer trading outlook to investors and helps them to find good opportunities. Indicator gives zero signal on price downturns and signal value equals to one on price upturns.   Once again a new type of indicator and rangebound between zero and one .
Coasyn Participation Intelligence Professional Market Participation Intelligence for MetaTrader 5 Most trading losses begin long before the entry—they begin by participating in poor market conditions. Coasyn Participation Intelligence is designed to help discretionary traders evaluate whether the current market environment deserves their participation before capital is committed. Rather than searching for more trading signals, this panel helps you become more selective by organizing important en
FREE
Alpha Trend Indicator for MT5
Mohammad Taher Halimi Tabrizi
Alpha Trend Indicator for MetaTrader 5 Check all of our products from mql5 market: What are the specifications of this indicator? Platform: MetaTrader 5 (MT5) Type of Application: Custom Trading Indicator Level: Intermediate / Professional Timeframe: All Timeframes (Multi-Timeframe Support) Trading Styles: Scalping, Day Trading, Swing Trading, Position Trading Trading Markets: Forex, Stocks, Commodities, Indices, and Crypto What does this indicator do? The Alpha Trend Indicator for
Rocket Trend
Andriy Sydoruk
The Rocket Trend indicator is trending. The indicator draws two-color points connected by lines along the chart. This is a trend indicator, it is an algorithmic indicator. It is easy to work and understand when a blue circle appears, you need to buy, when a red one appears, sell. The indicator is used for scalping and pipsing, and has proven itself well. Rocket Trend is available for analyzing the direction of the trend for a specific period of time. Ideal for novice traders learning the laws o
First Dawn MT5
Innovicient Limited
The First Dawn indicator uses a unique mechanism to search and plot signals. This keeps searching for signals, making it a great indicator for scaping and identification of changes in direction, swing trading and trend trading. The    First Dawn     helps you get early signals. The backtest gives the true picture of how the indicator works with real/demo accounts. Although this is a tiny indicator it is packed with advantageous settings that will help you whether you desire to: Snap the Peaks a
In the context of trading, Malaysia SNR (Support and Resistance) refers to the technical analysis of support and resistance levels in financial markets, particularly for stocks, indices, or other assets traded. This is single timeframe version. Multiple timeframe version is avaiable here . There are three type of Malaysia SNR level Classic , GAP and Flipped 1. Classic Support is the price level at which an asset tends to stop falling and may start to rebound. It acts as a "floor" where demand is
Pips On Candles
Giuseppe Nittoli
Pips on Candles shows the number of pips involved in each candle on the chart. It is possible to set 3 different ranges for counting on each single candle via the RangeType parameter: With "HighLow" you count the pips present between the minimum and the maximum. The number is shown under each candlestick on the chart. With "OpenClose" you count the pips present between the opening and closing price of the candle. The number is shown under each candlestick on the chart. With "HighDistAndLowDist"
Radar Trade Analytic
Jeverson Rodrigues Ferreira
Radar Trade Analytic 2.0 – MT5용 퀀트 패널 Radar Trade Analytic란? Radar Trade Analytic는 Radar Trade 생태계의 퀀트(정량 분석) 모듈입니다. 메인 차트 아래 별도의 창에서 열리며, 동일한 독자적인 Sigma 엔진으로 구축된 네 개의 동기화된 레이어를 표시합니다. 이를 통해 차트에서 보이는 것과 패널에서 읽는 것 사이의 직접적인 대응 관계를 보장합니다. 매수/매도 신호가 없습니다. 목표가도 없습니다. 알림도 없습니다. Radar Trade Analytic는 정말 중요한 데이터만 정리하여 명확하게 판단할 수 있도록 돕습니다. 2.0 버전에서 달라진 점 # 개선 사항 이전 버전 (1.00) 2.0 버전 1 Delta Flow (CVD) M1 캔들만 사용하여 계산(하위 타임프레임 추정치) TICK_FLAG_BUY/SELL 플래그가 포함된 틱 기반의 실제 공격성 델타 — 전문 플랫폼과 동일한 데이터 사용 2
Range Bar Pro
Antonio Molinaro
Range Bar Pro Indicator for MetaTrader 5 Visualize market trends, levels and other features with Range Bar Pro, an innovative indicator that draws a unique, standalone candle on the right side of any MT5 chart. This single candle is generated from an analysis of price over a specified range, providing you with a powerful snapshot of the market. Key Features: Single-Candle Visualization: Gain quick insights with a single, specially derived candle that reflects comprehensive price movement over a
Veloticker
Alexandro Matos
VeloTicker PRO is a professional trading indicator designed to reveal hidden market pressure at key institutional price levels. At these levels, the market often experiences: - Liquidity concentration - Institutional participation - Price reactions (reversals or breakouts) The indicator displays two real-time gauges: BUY Pressure Gauge SELL Pressure Gauge Each gauge measures the strength of buying and selling activity based on tick volume flow. This allows traders to instantly iden
FREE
이 제품의 구매자들이 또한 구매함
Trend Sniper X
Sarvarbek Abduvoxobov
4.86 (43)
Trend Sniper X 는 트레이더가 추세 방향과 잠재적 반전 지점을 명확하고 정확하게 포착할 수 있도록 도와주는 MetaTrader 5용 멀티 타임프레임 추세 추종 지표입니다. MT4용: https://www.mql5.com/en/market/product/193245 가격 정보: 현재 가격은 프로모션 할인가이며, 향후 업데이트 및 새로운 기능이 출시됨에 따라 변동될 수 있습니다. 보너스 혜택: 본 지표 전용 무료 자동매매 Assistant EA를 받으시려면 구매 후 작성자에게 메시지를 보내주시기 바랍니다. Code2Profit 채널 멀티 타임프레임 분석으로 시장을 마스터하세요! Trend Sniper X로 승률을 극대화하는 방법: 핵심 규칙 및 세션 팁 기술 사양 플랫폼 MetaTrader 5 지표 유형 멀티 타임프레임 추세 지표 운용 타임프레임 모든 차트 타임프레임 지원, 독립적으로 선택 가능한 상위 타임프레임(M1–MN1) 주요 상품 외환, 금(XAUUSD) 및 기타 C
Smart Trend Trading System — MetaTrader 5 구매 후 MQL5에서 저에게 메시지를 보내시면 Smart Universal Expert Advisor를 무료로 받으실 수 있으며, 온라인 강좌, PDF 매뉴얼 및 비공개 그룹 이용 권한도 함께 제공됩니다. STTS는 추세 방향, 진입·청산 신호, 반전 구간, 주요 가격 수준을 차트에 모아 보여줍니다. 시스템을 참고해 수동으로 거래하거나, 별도의 호환 EA를 연결하여 선택한 설정에 따라 자동으로 거래를 실행할 수 있습니다. 하나의 시스템, 네 가지 트레이딩 접근법 STTS의 트레이딩 접근법은 크게 네 가지로 나뉩니다. • 스캘핑 — 단기 신호와 시장 움직임을 살펴봅니다. • 추세 매매 — 방향을 평가하고 추세 안에서 기회를 찾습니다. • 반전 매매 — 잠재적인 전환 구간과 방향 변화를 파악합니다. • 거래량 매매 — 거래량 기반 정보로 시장 활동을 평가합니다. 진입·청산 화살표, 추세 정보, 지지·저항 수
새로운 왕의 등장 - 인디케이터 + 주문 관리 표시(TP1 + TP2 + TP3) + 선택형 텔레그램 시그널 전송 기능 포함 (무료) (완전한 트레이딩 및 시그널 시스템) 골드를 위한 최고의 EA: Gold Slayer 이 인디케이터는 고급 전략, 사용자 지정 가능한 주문 관리 시스템, 그리고 엔벨로프 확장을 결합한 평균 회귀(mean reversion) 시스템을 포함하고 있습니다. 또한 RSI와 같은 여러 지능형 확인 필터를 통해 높은 확률의 반전 진입 구간을 포착하여 BUY 및 SELL 시그널을 제공합니다. 단순히 거래 방법만 배우는 것이 아니라, 여러 포지션을 효과적으로 관리하고 이전에 수익 중인 오픈 포지션으로 손실 거래를 커버하는 방법까지 익힐 수 있습니다. M5 전용으로 설계 및 최적화되었으며, 유동성이 풍부해 시그널이 더 깔끔하고 신뢰도 높은 BTCUSD와 XAUUSD에서 뛰어난 성능을 발휘합니다. 이 인디케이터는 ATR 기반으로 자동 계산된 진입가, 손절가, 익절가와
Zoryk Gold
Reda El Koutbane
4.78 (18)
ZORYK — MetaTrader 5용 XAUUSD 전문 신호 및 트레이드 플래닝 시스템 이런 경험이 있을 것입니다. 골드를 분석하고 진입을 기다린 뒤 마침내 포지션을 열었지만 가격이 곧바로 반대 방향으로 움직입니다. 너무 일찍 청산하거나 Stop Loss를 옮기거나 몇 초 동안 망설입니다. 그 후 시장은 내가 없이도 처음 예상했던 목표까지 정확히 움직입니다. 문제는 항상 방향이 아니었습니다. 진짜 문제는 불확실성이었습니다. 정확한 진입 위치를 몰랐습니다. 어느 지점에서 원래의 트레이드 아이디어가 무효가 되는지 몰랐습니다. 가까운 수익을 확보해야 할지 더 큰 움직임을 기다려야 할지 판단하기 어려웠습니다. 현재 setup이 정말 강한지 아니면 단지 새로운 거래를 억지로 찾고 있는지도 확신하기 어려웠습니다. 골드는 매우 빠르게 움직입니다. 명확한 계획이 없다면 좋은 분석도 몇 초 만에 나쁜 결정으로 바뀔 수 있습니다. ZORYK는 이 문제를 해결하기 위해 개발되었습니다.
M5 Sniper
MeanFX
5 (3)
당신의 트레이딩 우위를 한눈에 확인하세요! M5 Sniper 는 MeanFX의 새로운 지표입니다. 정확한 트레이딩 신호 와 적응형 TP/SL 레벨 을 결합하여, 결과적으로 가능한 최고의 통계적 트레이딩을 만들어냅니다! 5회 구매마다 가격이 인상되며, 다음 가격은 69$입니다. 구매 후 저에게 메시지를 보내주시면 팁/가이드와 보너스 EA를 제공해 드립니다. 무엇이 이 지표를 특별하게 만들까요? Gold XAUUSD에서 검증된 통계적 성과 ( 거의 모든 자산에서 작동 하며, 일관된 결과 없이 모든 것을 다루려고 하기보다는 하나의 타임프레임을 완전히 익히는 데 집중합니다) 각 심볼당 하루 1~8회의 트레이드 와 높은 승률을 제공하며, 모든 통계적 우위를 우리의 편으로 가져갑니다. 차트에는 확인된 BUY 및 SELL 신호만 표시됩니다. 각 트레이드에 대해 지표가 생성하는 적응형 TP 및 SL 레벨 평균 승률 75%+ 평균 Signal Ratio 최소 1.1+ 알람 및 알림이 휴대폰 으로도
Ultra Indicator
Ihor Otkydach
5 (1)
ULTRA는 “올인원” 방식으로 작동하는 기술적 지표로, 시장을 독자적으로 분석하고, 매매 신호를 생성하며, 손절매 주문 설정 수준을 표시하고, 이익을 실현하거나 손실을 최소화하기 위해 포지션을 청산해야 할 시점을 제안합니다. 다시 말해, 시장을 분석하는 법을 모르거나, 가격 수준(손절매를 어디에 설정할지)을 파악하지 못하거나, 자금 관리에 어려움을 겪더라도 상관없습니다. ULTRA가 그 모든 것을 대신 해줄 테니까요! 구매자 특전 : ULTRA 지표를 구매하신 후, 저에게 비공개 메시지를 보내주시면 “ULTRA BOT”을 무료 선물로 드립니다. 이 도구는 해당 지표의 신호를 바탕으로 개설한 거래를 관리하는 데 도움을 주는 특별한 도구입니다(각 거래에 대해 손절매를 설정하고, 최상의 결과를 얻을 수 있도록 전략의 규칙에 따라 거래를 자동으로 청산해 줍니다).  또한 구매자분들께 다양한 자산에 바로 적용할 수 있는 설정값을 제공해 드리고 있으며, 이를 통해 지표가 최대 효율로 작동할
Entry Points Pro for MT5
Yury Orlov
4.52 (152)
2019년, 저는 이 지표가 무엇을 할 수 있는지 전 세계에 보여 주었습니다. 실계좌에서 지표의 시그널에 따라 수동으로, 모두가 볼 수 있게 공개적으로 거래했습니다 — 계좌는 Myfxbook에서 모니터링되었고, 저는 이 실험을 Facebook에 자세히 공유했습니다. 결과: 4개월 만에 10,000달러가 941,411달러가 되었습니다. 리스크는 의도적으로 극단적이었습니다 — 드로다운은 54%까지 이르렀습니다. 우리 직업에서 수익과 리스크는 언제나 함께 가기 때문입니다. Myfxbook 스크린샷은 갤러리의 첫 번째 이미지입니다. 아무래도 축하드려야 할 것 같습니다: 여러분의 탐색은 이제 끝났습니다. Entry Points Pro는 진입에서 추측을 없애고, 모든 트레이더가 찾는 것 — 확신과 평온함을 줍니다. 이 지표는 정말로 작동하고, 시그널을 절대 리페인팅하지 않으며, 그 결과를 여러분의 차트에서 곧바로 금액으로 보여 주기 때문입니다. 수많은 창과 서른 가지 설정, 그리고 작동하지도
SuperScalp Pro
Van Minh Nguyen
4.54 (37)
SuperScalp Pro - Professional Multi-Layer Confluence Scalping System SuperScalp Pro는 기존 Supertrend에 여러 지능형 확인 필터를 추가하여 기능을 강화한 고급 스캘핑 지표입니다. 잘못된 신호를 크게 줄이면서 성공 가능성이 더 높은 Buy/Sell 거래 기회를 식별하는 데 도움을 줍니다. 명확한 Buy 및 Sell 화살표가 차트에 직접 표시되며, ATR 기반 Stop Loss 및 Take Profit 레벨도 실시간으로 자동 계산됩니다. 구매 후 MQL5 메시지로 저에게 연락하시면 SuperScalp Pro Auto Trader EA를 무료로 받으실 수 있으며, 사용자 가이드와 비공개 그룹 이용 권한도 제공됩니다. 권장 설정 파일 다운로드: [Set File] 전체 문서는 제품 블로그에서 확인할 수 있습니다: [User Guide] 업데이트를 받으려면 공식 채널에 참여하세요: [Official Channel]
Gann Made Easy MT5
Oleg Rodin
5 (13)
Gann Made Easy 는 mr.의 이론을 사용하여 최고의 거래 원칙을 기반으로 하는 전문적이고 사용하기 쉬운 Forex 거래 시스템입니다. W.D. 간. 이 표시기는 Stop Loss 및 Take Profit Levels를 포함하여 정확한 BUY 및 SELL 신호를 제공합니다. PUSH 알림을 사용하여 이동 중에도 거래할 수 있습니다. 구매 후 거래 방법 안내 및 유용한 추가 지표를 무료로 받으시려면 저에게 연락주세요! 아마도 Gann 거래 방법에 대해 이미 여러 번 들었을 것입니다. 일반적으로 Gann의 이론은 초보자 거래자뿐만 아니라 이미 거래 경험이 있는 사람들에게도 매우 복잡한 것입니다. Gann의 거래 방식은 이론적으로 적용하기 쉽지 않기 때문입니다. 나는 그 지식을 연마하고 Forex 지표에 최고의 원칙을 적용하기 위해 몇 년을 보냈습니다. 표시기는 적용하기가 매우 쉽습니다. 차트에 첨부하고 간단한 거래 권장 사항을 따르기만 하면 됩니다. 지표는 지속적으로 시장 분석
SMC Intraday Formula
VividMind Digital Solutions
5 (26)
먼저 솔직하게 말하겠습니다. 어떤 인디케이터도 단독으로 당신을 수익성 있게 만들어주지 않습니다. 누군가 그렇게 말한다면, 그는 당신에게 꿈을 파는 것입니다. 완벽한 매수/매도 화살표를 보여주는 모든 인디케이터는 완벽하게 보이도록 만들 수 있습니다 — 단지 올바른 과거 구간을 확대하고 승리한 거래만 캡처하면 됩니다. 우리는 그렇게 하지 않습니다.  SMC Intraday Formula는 도구입니다. 시장 구조를 읽고, 가장 높은 확률의 가격 구간을 표시하며, 현재 스마트 머니의 흐름이 어떻게 보이는지 아주 단순한 언어로 보여줍니다. 최종 결정은 여전히 당신이 합니다. 실행도 당신이 합니다. 하지만 이제는 희망이 아니라 정확성으로 거래하게 됩니다. 우리는 이 인디케이터를 지난 약 3년 동안 골드(XAUUSD) 및 주요 외환 통화쌍의 데이 트레이딩 스캘핑에 사용해 왔습니다. M1, M5, M15, M30에서 우리의 핵심 도구입니다. 이 도구는 미래를 예측하려 하지 않습니다 — 지금 형성
M1 Sniper MT5
Oleg Rodin
5 (7)
M1 SNIPER 는 사용하기 쉬운 거래 지표 시스템입니다. M1 시간대에 맞춰 설계된 화살표 지표입니다. 이 지표는 M1 시간대 스캘핑을 위한 단독 시스템으로 사용할 수 있으며, 기존 거래 시스템의 일부로도 사용할 수 있습니다. 이 거래 시스템은 M1 시간대 거래용으로 특별히 설계되었지만, 다른 시간대에도 사용할 수 있습니다. 원래는 XAUUSD와 BTCUSD 거래를 위해 이 방법을 설계했지만, 다른 시장 거래에도 유용하다는 것을 알게 되었습니다. 이 지표의 신호는 추세 방향과 반대로 거래될 수 있습니다. 저는 지표의 신호를 활용하여 양방향으로 거래할 수 있도록 돕는 특별한 거래 기법을 알려드립니다. 이 방법은 특별한 동적 지지선과 저항선 가격 영역을 활용하는 것을 기반으로 합니다. 구매하시면 M1 SNIPER 화살표 지표를 바로 다운로드하실 수 있습니다. 또한, 아래 스크린샷에 표시된 Apollo Dynamic SR 지표는 M1 SNIPER 도구를 사용하는 모든 사용자에게 무료로
GoldenX Entry MT5
VividMind Digital Solutions
5 (17)
GoldenX Entry는 MT5용 인디케이터로, 적응형 Smart Entry Trend 알고리즘, 신호 스코어링 시스템, 시장 레짐 감지 기능, 그리고 변동성 필터를 포함합니다. 각 신호에는 계산된 진입 레벨, 3개의 익절(TP1, TP2, TP3) 레벨, 그리고 손절(Stop-Loss) 레벨이 포함됩니다. 이 인디케이터는 다양한 시장 환경에 적응하도록 설계된 다중 분석 레이어 구조 위에 구축되어 있으며, 내장 최적화기와 통계 추적 시스템을 결합합니다. 또한 Risk-to-Reward(RR) 지표와 과거 거래 행동 기반의 정량 분석을 제공합니다. 시작은 간단합니다 — 선택한 타임프레임에서 최적화기를 실행한 뒤 차트에서 바로 인디케이터를 사용하면 됩니다. 핵심 기능 GoldenX Entry는 하나의 차트에서 신호 엔진, 트레이드 관리 기능, 그리고 과거 통계 추적을 통합합니다: - 내장 최적화기: 최적화기는 차트에서 원클릭으로 실행됩니다. 200개의 파라미터 조합을 두 단계 탐색
다음 업데이트 — 버전 2.52 곧 출시! [신규] 시장 분석 및 트레이딩 워크플로를 향상시키기 위해 설계된 4가지 주요 신규 기능을 기대해 주세요. 트레이딩 요구 사항을 충족하도록 설계된 4가지 새로운 기능으로 시장 분석을 한 단계 더 발전시킵니다. 다음 기능을 소개합니다: 1. TRADE OVERVIEW DASHBOARD 2. CONFLUENCE AT ZONE 3. STRONG & WEAK HIGH/LOW 4. OTE 1. TRADE OVERVIEW DASHBOARD 시장 전체 상황을 더 쉽게 파악할 수 있도록 도와주는 대시보드입니다. 트레이딩 의사결정을 지원하는 가이드를 제공하며, 하나의 화면에서 시장을 분석하고 체계적으로 트레이딩을 계획할 수 있도록 도와줍니다. 멀티 타임프레임 시장 개요 (Multi-Timeframe Market Overview) 시장 방향과 가격 구조를 더욱 명확하게 파악 시장 상황을 빠르게 확인 체계적인 시장 분석 및 진입 계획을 위한 가이드 2. CO
Gold Trend Coach MT5
Cristhian Alexander Gaibor Cuasquer
5 (4)
Gold Trend Coach는 MetaTrader 5용 금(XAUUSD) 추세 지표로, 캔들 마감에 확정되는 매수·매도 신호(리페인트 없음), 손절과 세 개의 익절 목표, 진입부터 TP3까지 안내하는 코치, 멀티 타임프레임 패널, 휴대폰과 텔레그램 알림을 제공합니다. 런던·뉴욕 세션의 M1·M5 스캘핑과 M15 데이 트레이딩용으로 만들었습니다. 보너스: Gold Trend Coach 자동매매 EA 무료 제공. 구매 후 메시지를 주시면 지표 신호로 자동 매매하는 EA와, 모든 신호·진입·손절·도달한 목표를 텔레그램 채팅, 그룹 또는 채널로 보내는 Telegram Alert Bridge를 set 파일과 설치 가이드와 함께 보내 드립니다. 출시 가격 $39는 처음 20개 한정이었고 이미 매진되었습니다. 현재 가격 40개까지 $45, 이후 $59. 예정된 최종 가격 $79. 아마 이미 수십 개의 금 지표를 써 보셨을 겁니다. 대부분은 화살표로 매수·매도 신호만 주고 가장 어려운 부분, 즉
Atomic Analyst MT5
Issam Kassas
4.5 (64)
Atomic Analyst — MetaTrader 5 구매 후 MQL5에서 저에게 메시지를 보내시면 Smart Universal Expert Advisor를 무료로 받으실 수 있으며, 온라인 강좌, PDF 매뉴얼 및 비공개 그룹 이용 권한도 함께 제공됩니다. Atomic Analyst는 가격 움직임 분석, 추세 방향, 진입·청산 신호, 손절 수준, 여러 익절 수준을 차트에 모아 보여줍니다. 신호를 확인하고 매매 상황을 이해하세요 Atomic Analyst는 분석 결과를 명확한 시각 정보로 정리합니다. • 잠재적인 진입 기회를 확인할 수 있는 매수·매도 화살표. • 거래 계획에 도움이 되는 손절 수준과 여러 익절 수준. • 시장 방향을 평가할 수 있는 추세, 강도, 모멘텀 수치. • 더 넓은 시장 맥락을 비교할 수 있는 여러 시간대 분석. • 변화하는 시장 상황을 따라갈 수 있는 색상별 캔들과 알림. 신호와 보조 분석을 함께 검토한 다음, 해당 매매 상황이 자신의 거래 규칙에
Boba Analysis Suite
Trade Ready Solutions LLC
5 (2)
Boba Analysis Suite Boba Analysis Suite는 MetaTrader 5용 분석 지표입니다. 시장 구조, 주요 가격 영역, 전반적인 시장 상황을 하나의 차트 화면에 통합하여 표시합니다. 트레이더이자 트레이딩 코치로서의 실무 경험을 바탕으로 개발되었으며, 시장 방향 평가, 주요 가격 수준 식별, 여러 시간대의 종합적인 분석 등 체계적인 분석 과정을 지원합니다. 시장 맥락을 고려한 분석 개별 신호의 의미는 시장 상황에 따라 달라집니다. Boba Analysis Suite는 현재 차트 상황을 더 넓은 시장 구조와 연결하고, 사전에 정한 규칙에 따라 매매 아이디어를 검토할 수 있도록 돕습니다. 주요 분석 기능은 다음과 같습니다. 추세 및 시장 구조: 시장 방향과 관련 구조적 맥락을 평가합니다. 주요 가격 영역 및 수준: 추가 분석이 필요한 중요한 영역을 차트에 시각적으로 표시합니다. 여러 시간대: 서로 다른 시간대의 정보를 통합하여 전반적인 시장 상황을 평가합니다.
Adaptive Price Action Engine 지표를 구매하면 EA(자동매매 프로그램)가 무료 멀티 타임프레임 기반 자기 최적화 추세 & 캔들 패턴 분석 시스템 시장은 끊임없이 변화하며, 모든 Price Action 패턴이 모든 시장 환경에서 동일한 가치를 가지는 것은 아닙니다. Adaptive Price Action Engine 은 변화하는 시장 환경에 적응할 수 있도록 설계되었으며, 추세 구조, 멀티 타임프레임 분석, 캔들 패턴 및 통계적 최적화 를 하나의 분석 프레임워크로 결합합니다. 두 가지 적응형 모드 Dual Alpha Trend Mode 낮은 타임프레임과 높은 타임프레임에서 적합한 Alpha Trend 파라미터를 자동으로 탐색하여, 최근 시장 움직임에 맞춰 추세 분석을 조정합니다. Candlestick + Alpha Mode Alpha Trend를 통한 시장 국면 분석과 22개의 상승 및 하락 캔들 패턴 을 결합합니다. 모든 패턴을 동일하게 취급하는 대신, 다양
Azimuth Pro
Ottaviano De Cicco
5 (7)
Azimuth Pro V2: Synthetic Fractal Structure and Confirmed Entries for MT5 Overview Azimuth Pro is a multi-level swing structure indicator by Merkava Labs . Four nested swing layers, swing-anchored VWAP, ABC pattern detection, three-timeframe structural filtering, and closed-bar confirmed entries — one chart, one workflow from micro-swings to macro-cycles. This is not a blind signal product. It is a structure-first workflow for traders who care about location, context, and timing. Halloween P
Auto Optimized SpeedAngle 은 지속적인 워크포워드 최적화(Walk-Forward Optimization, WFO)를 통해 곡선 적합(curve-fitting)을 제거한 기관 수준의 모멘텀 벡터화 시스템입니다. 시장 체제가 바뀔 때 성능이 떨어지는 정적 입력에 의존하는 대신, 이 지표는 표본 외(Out-of-Sample, OOS) 검증을 사용하여 매개변수를 동적으로 재보정하며, 표시되는 신호가 과거의 우연이 아닌 진정한 통계적 우위를 나타내도록 보장합니다. 핵심 기관용 프레임워크 워크포워드 최적화 엔진: 핵심 알고리즘은 수천 가지의 룩백(lookback) 및 임계값 조합을 지속적으로 스캔하며, 데이터를 인샘플(in-sample)과 표본 외(out-of-sample) 세트로 엄격하게 분리합니다. 미지의 데이터 환경에서 수학적 우수성이 증명된 경우에만 새로운 매개변수 구성을 채택합니다. 정량적 목적 함수: 순수한 총이익을 쫓는 대신, 최적화 엔진은 기관 수준의 안정성
Zain Gold Scalping
Ahmed Gamal Abdel Nasser Mohamed
A complete price-action analysis tool built around dual independent entry logic, each confirmed against a volatility band, combined with a configurable set of nine optional confirmation filters that let you shape exactly how conservative or aggressive the tool's signals behave. Core Strategy Two independent entry setups, each triggering only when price moves outside a dynamic volatility band — giving two distinct ways to spot potential reversal points, which can be used together or separately.
Tokyo mt5 Indicator
Vasiliy Strukov
5 (14)
Tokyo Indicator는 추세 방향, 잠재적 거래 신호 및 시장 상황을 명확하고 시각적으로 보여줍니다. 색상으로 구분된 계단식 추세선은 강세 구간(파란색)과 약세 구간(자홍색)을 명확히 구별해 줍니다. 추세가 전환될 때 나타나는 방향성 화살표는 잠재적인 매수 및 매도 기회를 강조하여 보여줍니다. 통합 대시보드는 현재 신호, 시장 성향(bias), 모멘텀, 변동성, 신호 품질 등의 정보를 한눈에 파악할 수 있도록 구성되어 있습니다. 이를 통해 트레이더는 별도의 패널을 오갈 필요 없이 가격 움직임(price action)과 지표의 데이터를 동시에 분석할 수 있습니다. 깔끔한 차트 화면과 간결한 시장 개요를 제공하는 Tokyo Indicator는 체계적인 추세 분석과 거래 결정을 지원합니다. 모든 시간대와 다양한 자산(특히 금)에서 활용할 수 있습니다. 추세 방향, 잠재적 거래 신호 및 시장 상황을 명확하고 시각적으로 보여줍니다. 색상으로 구분된 계단식 추세선은 강세 구간(파란색)
FiboSniper Pro
Van Minh Nguyen
5 (4)
FiboSniper Pro – Multi-Filter Fibonacci System with Auto SL/TP and Control Panel FiboSniper Pro는 동적 Fibonacci Envelopes와 여러 확인 필터를 결합하여 선별된 Buy 및 Sell 신호를 생성하는 기술적 지표입니다. Fibonacci 레벨은 Moving Average와 ATR을 기반으로 계산된 후 ADX, EMA, RSI, ATR, Volume, Time 및 Candle 구조를 통해 필터링됩니다. 이 지표는 ATR 기반의 자동 Stop Loss 및 Take Profit 레벨을 차트에 직접 표시하며, 빠른 설정 조정을 위한 인터랙티브 Control Panel을 제공합니다. 구매 후 MQL5 메시지로 저에게 연락하시면 Auto Trader X를 무료로 받으실 수 있으며, 이 지표의 거래 신호를 자동화하는 방법에 대한 안내도 제공됩니다. User Guide 및 Set Files: [Click here
Quantum TrendPulse
Bogdan Ion Puscasu
5 (26)
SuperTrend   ,   RSI   ,   Stochastic   의 힘을 하나의 포괄적인 지표로 결합하여 트레이딩 잠재력을 극대화하는 궁극의 트레이딩 도구   인 Quantum TrendPulse를   소개합니다. 정밀성과 효율성을 추구하는 트레이더를 위해 설계된 이 지표는 시장 추세, 모멘텀 변화, 최적의 진입 및 종료 지점을 자신 있게 식별하는 데 도움이 됩니다. 주요 특징: SuperTrend 통합:   주요 시장 추세를 쉽게 따라가고 수익성의 물결을 타세요. RSI 정밀도:   매수 과다 및 매도 과다 수준을 감지하여 시장 반전 시점을 파악하는 데 적합하며 SuperTrend 필터로 사용 가능 확률적 정확도:   변동성이 큰 시장에서 숨겨진 기회를 찾기 위해 확률적 진동   을 활용하고 SuperTrend의 필터로 사용 다중 시간대 분석:   M5부터 H1 또는 H4까지 다양한 시간대에 걸쳐 시장을 최신 상태로 유지하세요. 맞춤형 알림:   맞춤형 거래 조건이 충족되면
Superhero
Ihor Otkydach
5 (3)
SUPERHERO 지표는 “올인원” 방식으로 설계된 다중 통화 거래 시스템입니다. 이 지표는 시장을 독자적으로 분석하여 포지션을 개설하고 청산할 시점에 대한 신호를 제공합니다. 손절매(Stop Loss) 및 익절(Take Profit) 주문을 활용하며, 위험 대비 수익 비율(R:R)은 1:1입니다. 이 시스템은 스마트폰으로 푸시 알림을 전송할 수 있으므로, PC에 묶여 있을 필요 없이 “이동 중에도” 매매를 할 수 있습니다. 이는 자체 거래 전문 회사에 안성맞춤입니다. 모든 고객님께 드리는 특별 혜택: 이 지표를 구매하시는 모든 분께는 제가 특별히 준비한 유틸리티를 선물로 드릴 예정이며, 이 유틸리티는 다음과 같은 기능을 제공합니다: 손절매 및 익절 주문을 자동으로 설정합니다 가격이 목표 수준에 도달하면 자동으로 포지션을 청산합니다 미결제 주문 거래를 지원합니다 평균화 거래 모드를 지원합니다 이 훌륭하고 매우 편리한 유틸리티를 선물로 받고 싶으시다면, SUPERHERO 지표를 구매하
Dynamic Forex28 Navigator MT5
Bernhard Schweigert
5 (1)
다중 통화 강도 및 모멘텀 지표 MT5 Dynamic Forex28 Navigator는 오랫동안 사랑받아 온 저희 지표의 진화 버전으로, 세 가지 기능을 하나로 결합했습니다: Advanced Currency Strength28 Indicator (리뷰 700개) Advanced Currency IMPULSE with ALERT (리뷰 530개) CS28 Combo Signals (최근 보너스) 두 이전 지표는 MQL5 Market에서 합계 1,200개가 넘는 리뷰를 받았으며 2016년부터 MT4 커뮤니티의 필수품이었습니다. Dynamic Forex28 Navigator MT5는 검증된 동일한 로직을 그대로 이어갑니다. MetaTrader 5를 위해 완전히 다시 제작 – MT5의 네이티브 다중 심볼 아키텍처를 최대한 활용하도록 설계되었습니다. 사용 설명서: https://www.mql5.com/en/blogs/post/758844 MT4 버전을 찾고 계신가요? 여기를 클릭하세요: ht
Trend Catcher ind mt5
Ramil Minniakhmetov
5 (18)
트렌드 캐처 인디케이터 트렌드 캐처 인디케이터는 개발자가 자체 개발한 맞춤형 적응형 트렌드 분석 지표들을 조합하여 시장 가격 움직임을 분석합니다. 단기적인 노이즈를 제거하고 근본적인 모멘텀 강도, 변동성 확대, 가격 구조 움직임에 집중하여 진정한 시장 방향을 파악합니다. 또한 이동 평균, RSI, 변동성 필터와 같은 맞춤형 지표들을 활용하여 가격을 평활화하고 트렌드를 필터링합니다. 실제 운영 모니터링 및 기타 제품은 다음 링크에서 확인하실 수 있습니다:   https://www.mql5.com/en/users/mechanic/seller 텔레그램에서는 EA나 설정 파일을 판매하지 않습니다. 사기이니 주의하세요. 모든 설정 파일은 블로그에서 무료로 제공됩니다. 중요! 구매 후 즉시 연락 주시면 사용 방법 및 보너스를 드립니다!
Apex Patterns PRO 인디케이터 구매 시 - 기반 Expert Advisor 무료 제공. 자체 최적화 차트 패턴 및 브레이크아웃 분석 시스템 기존의 패턴 스캐너는 고정된 파라미터에 의존하므로 시장 변동성과 구조가 변화할 때 성능이 저하되는 경우가 많습니다. Apex Patterns PRO는 구조적 차트 패턴 인식, 모멘텀 필터링, 통계적 자체 최적화를 하나의 분석 프레임워크로 결합하여 변화하는 시장 환경에 적응하도록 설계되었습니다. 적응형 스캐닝 엔진 자체 최적화 패턴 모드 최근 과거 데이터를 바탕으로 적절한 패턴 파라미터를 자동으로 탐색하여, 정적인 설정 대신 현재 시장 행보에 맞춰 인디케이터의 구조 감지 방식을 적응시킵니다. 스마트 브레이크아웃 필터링 클래식 패턴 인식과 모멘텀, 거래량, 프라이스 액션 지표를 결합합니다. 모든 브레이크아웃을 동일하게 다루는 대신, 시장의 기저 구조를 평가하여 현재 통계적 환경에 부합하는 셋업을 식별합니다. 주요 기능 리페인트 없는 고
Neuro Poseidon MT5
Daria Rezueva
4.68 (53)
Neuro Poseidon is a new indicator by Daria Rezueva. It combines precise trading signals with adaptive TP/SL levels - creating best possible trades as a result! Message me and get  Neuro Poseidon Assistant  as a gift to automize your trading process! What makes it stand out? 1. Proven profitability on all assets and timeframes 2. Only confirmed BUY and SELL signals present on the chart 3. Adaptive TP & SL levels generated by the software for each trade 4. Easy to understand - suitable for al
Crystal Heikin Ashi Signals
Muhammad Jawad Shabir
5 (5)
Crystal Heikin Ashi Signals—Professional Trend & Signal Detection Indicator Advanced Heikin Ashi Visualization with Intelligent Signal System for Manual & Automated Trading Final Price: $149 ---------> Price goes up $10 after every 10 sales . Limited slots available — act fast . Overview User Guide PDF Crystal Heikin Ashi Signals is a professional-grade MetaTrader 5 indicator that combines pure Heikin Ashi candle visualization with an advanced momentum-shift detection system. Designed for both m
Break and Retest Hunter
Mohamed Hassan
4 (4)
Break and Retest Hunter is a powerful MetaTrader 5 indicator designed to automatically identify support and resistance levels, breakout structures, and potential retest opportunities in real time. Bonus Indicator: After purchasing Break and Retest Hunter , contact me to receive Trade Indicator Assistant EA completely free as a bonus utility. $65 for the next 10 copies . Next price is $120.  Combining adaptive market analysis, clear BUY/SELL signals, Fibonacci-based profit targets, and a premiu
제작자의 제품 더 보기
1. OVERVIEW Harmonic Dashboard is a specialized multi-symbol and multi-timeframe analytical indicator designed for MetaTrader 5 (MT5). The software systematically scans financial instruments across multiple timeframes to identify six classical harmonic chart patterns: Gartley, Bat, Butterfly, Crab, Cypher, and Shark. The application consolidates multi-asset scanner results, trend filter validation metrics, price level projections, and interactive chart navigation controls into a single graphic
Overview MACD Signal with Multi Filters is an advanced technical analysis indicator engineered for MetaTrader 5 (MT5). The software combines the classic Moving Average Convergence Divergence (MACD) oscillator architecture with a modular 14-filter confirmation engine (MultiFilterSuite). It is developed to assist manual traders, quantitative analysts, and algorithmic system developers in identifying momentum shifts, trend continuations, and structural turning points while filtering out sideways ma
Overview The MA Cross Scanner Pro is an advanced, highly optimized multi-symbol and multi-timeframe analytical dashboard engineered specifically for the MetaTrader 5 terminal. Designed for technical analysts, systemic traders, and quantitative researchers, this utility serves as a comprehensive market surveillance engine. Its primary objective is to continuously monitor a customized array of financial instruments across numerous timeframes simultaneously, detecting precise moving average crosso
Product Overview: Relative Vigor Index Multi-Filter Technical System The Relative Vigor Index (RVI) Multi-Filter Indicator is a comprehensive technical analysis engine developed for the MetaTrader 5 terminal. Designed to identify cyclical momentum shifts, trend continuations, and structural market turning points, this analytical system couples the classic Relative Vigor Index formula with an advanced multi-layered confirmation matrix consisting of 17 distinct technical filters. Rather than rely
FREE
Hull Trend Arrows MT5 with Multi-Filter Suite - Technical Documentation 1. Overview and Analytical Purpose Hull Trend Arrows MT5 with Multi-Filter Suite is an algorithmic technical indicator for MetaTrader 5. It integrates the low-lag calculation engine of the Hull Moving Average (HMA) with fourteen modular confirmation filters to identify directional momentum transitions, calculate inflection points, and display non-repainting entry signals on the chart. Standard moving averages introduce sign
FREE
HA Signal MultiFilter MT5 - Technical Operational Manual & Architecture Guide 1. SYSTEM OVERVIEW & ARCHITECTURAL FOUNDATION HA Signal MultiFilter MT5 is a specialized analytical indicator developed for MetaTrader 5 terminal to identify directional momentum expansions and structural trend continuations[cite: 2]. By synthesizing smoothed Heiken Ashi candlestick price discovery with a modular 15-layer secondary confirmation filter suite, the system extracts high-probability market shifts while fil
FREE
CCI MultiFilter Overbought Oversold Signal Pro MT5 Technical Specification & Operational Manual  1. Overview and System Identity CCI MultiFilter Overbought Oversold Signal Pro MT5 is an institutional-grade technical analysis indicator engineered natively for MetaTrader 5. Developed for quantitative analysts, systematic manual traders, and multi-asset operators, the system provides an objective algorithmic framework to identify cyclical market extremes, momentum shifts, and structural trend cont
Multi-Pattern Signal Suite with Universal 14-Filter Framework for MetaTrader 5 1. Product Overview Multi-Pattern Signal Suite is an advanced technical analysis indicator engineered for the MetaTrader 5 terminal. The indicator detects high-probability candlestick formations comprising PinBar, Candle Rejection, and Marubozu (Full Body Candle) patterns. To eliminate market noise and false breakout formations, the core price action engine is integrated with the Universal MultiFilterSuite framework:
Overview: ADX Signal MultiFilter is an advanced technical analysis indicator for MetaTrader 5 designed to identify directional breakout momentum and trend acceleration phases. Built around the mathematical framework of J. Welles Wilder's Directional Movement system (ADX, +DI, and -DI), the tool monitors dynamic momentum shifts where directional movement lines break through user-defined threshold levels. To resolve the common challenge of false breakout signals during ranging or choppy market con

Breakout Divergence RSI MultiFilter is a modular technical analysis indicator for MetaTrader 5 designed to identify Regular and Hidden RSI Divergences alongside confirmed trendline breakout continuation opportunities. Equipped with an algorithmic multi-layer filtering engine comprising 16 technical filter systems, this indicator provides an analytical bridge between momentum divergence recognition and structural price action confirmation. 1. TECHNICAL OVERVIEW AND ARCHITECTURE Breakout Diverge
Pro CHO Chaikin Oscillator X Zero Signals Filter Chaikin Oscillator Signal MultiFilter for MetaTrader 5 Product Overview Chaikin Oscillator Signal MultiFilter is a professional-grade technical analysis indicator engineered specifically for the MetaTrader 5 trading platform. The system is designed to identify directional momentum transitions and institutional volume flow dynamics by tracking the Chaikin Oscillator algorithmic model in synchronization with a comprehensive 14-filter confirmation
### Product Overview The Engulfing Dual-Engine and Multi-Filter Confirmation Indicator for MetaTrader 5 is a specialized technical analysis analytical tool engineered to identify directional engulfing candlestick patterns across global financial markets. Developed for quantitative analysts, discretionary traders, and algorithmic strategy designers, the software categorizes engulfing structures into two distinct computational classifications: Standard Retail Engulfing and Advanced Institutional E
1. Overview and Indicator Identity Fractal Breakout MultiFilter MT5 is an institutional-grade technical indicator engineered natively for MetaTrader 5 that identifies high-probability structural breakout opportunities based on multi-bar fractal geometries and confirms them through an institutional suite of fourteen independent analytical filters. The primary purpose of this analytical tool is to eliminate subjective chart interpretation by mathematically locating confirmed price swing highs and
Product Overview: Heiken Ashi Multi-Filter Suite MT5 The Heiken Ashi Multi-Filter Suite is an analytical trading indicator developed natively for MetaTrader 5, designed to provide directional price smoothing, structural reversal detection, and rule-based signal confirmation. By merging modified Heiken Ashi bar calculations with a modular 14-indicator filtering engine, the tool eliminates transient market noise and provides traders with disciplined visual signals. The indicator is built around t
MultiFilter MA High Low Cross Buy Sell Arrows MT5 - Professional Technical Manual 1. Product Overview & System Architecture MultiFilter MA High Low Cross Buy Sell Arrows MT5 is an advanced technical indicator engineered for the MetaTrader 5 trading terminal. Designed for professional technical analysts, manual chartists, and systematic discretionary traders, this software identifies high-probability directional momentum expansions and trend resumption points by tracking price interactions acro
MultiFilter MA Crossover Signals Trend Alerts MT5 TECHNICAL SPECIFICATION & MANUAL Overview: MultiFilter MA Crossover Signals Trend Alerts MT5 is an analytical technical indicator engineered for MetaTrader 5, developed to identify systematic trend transitions through dual moving average crossovers combined with a 17-module quantitative filtering matrix. A primary weakness of conventional moving average systems is vulnerability to whipsaws, false breakouts, and erratic market noise during low-vo
Momentum KU v1.41 Technical Documentation and Operational Manual 1. Overview and Purpose Momentum KU v1.41 is an analytical technical indicator engineered natively for the MetaTrader 5 (MT5) platform. The primary objective of the software is to detect directional momentum transitions across financial assets and provide multi-layered signal validation through an integrated architecture of seventeen independent technical filter subsystems. Momentum KU executes as an on-chart visual utility, plott
NLMS Volatility Trail MultiFilter MT5 - Operational Manual & Technical Specification 1. Overview and Core Purpose NLMS Volatility Trail MultiFilter MT5 is an algorithmic market analysis indicator designed for MetaTrader 5, providing adaptive trend identification, dynamic trailing envelopes, and multi-layered signal filtering. The system is built upon digital signal processing theory, dynamic volatility channels, and a modular matrix of secondary filters. At its computational core operates the
================================================================================ PRO PARABOLIC RSI MULTIFILTER SIGNAL PREMIUM MT5 (OFFICIAL PRODUCT SPECIFICATION) ================================================================================ Pro Parabolic RSI MultiFilter Signal Premium MT5 is a professional-grade technical trading suite engineered for MetaTrader 5, combining high-precision Relative Strength Index (RSI) dynamics with the trailing acceleration mechanism of the Parabolic SAR (St
PARABOLIC RSI SCANNER DASHBOARD ALL PAIR TIMEFRAME - TECHNICAL MANUAL 1. OVERVIEW & SYSTEM ARCHITECTURE The Parabolic RSI Scanner Dashboard All Pair Timeframe is a multi-asset, multi-timeframe analytical utility developed for the MetaTrader 5 terminal. The software calculates a synthetic technical indicator by mapping J. Welles Wilder's Parabolic Stop and Reverse (SAR) tracking logic directly onto the Relative Strength Index (RSI) momentum data series. Rather than tracking price fluctuations,
Parabolic SAR Multi-Filter System MT5: Algorithmic Trend Reversal Engine 1. PRODUCT OVERVIEW & OPERATIONAL ARCHITECTURE Parabolic SAR Multi-Filter System MT5 is a professional multi-component technical analysis indicator engineered for the MetaTrader 5 terminal. The indicator combines J. Welles Wilder's classic Parabolic Time/Price System with an advanced modular filtering architecture comprising 17 distinct secondary validation engines. The primary objective of this software is to eliminate f
MultiCandle Pattern Pro with Universal Filter Suite v2.0 is a professional technical analysis indicator engineered for MetaTrader 5 (MT5). The software automates the identification of sequential multi-candle price action formations across liquid financial markets, focusing specifically on 4-Candle (4C), 5-Candle (5C), and 6-Candle (6C) structures. Rather than depending on isolated single-candle setups that are vulnerable to erratic market noise, the system analyzes structured multi-bar sequence
Product: Pro RSI Signal Overbought Oversold Multi Filters MT5 Category: Technical Indicator / Oscillators & Momentum Platform: MetaTrader 5 Overview Pro RSI Signal Overbought Oversold Multi Filters is a technical momentum analysis indicator developed natively for the MetaTrader 5 platform. The tool reproduces and expands upon the standard TradingView Relative Strength Index architecture, providing an authentic analytical bridge between modern charting environments and the MetaTrader trading te
Overview The RSI Scanner Dashboard is a comprehensive technical analysis utility and multi-symbol, multi-timeframe monitoring indicator designed for the MetaTrader terminal. The primary objective of this tool is to scan market instruments continuously to identify specific Relative Strength Index (RSI) crossover conditions based on defined overbought and oversold thresholds. By aggregating data across user-defined currency pairs and timeframes into a single graphical user interface (GUI), this d
RVI Dual Mode with Universal Multi-Filter Framework for MetaTrader 5 Product Overview and Technical Scope RVI Dual Mode with Universal Multi-Filter Framework is a modular technical analysis indicator engineered specifically for MetaTrader 5. Built upon the volatility-adjusted momentum mathematics of Donald Dorsey's Relative Volatility Index (RVI), this analytical tool provides systematic directional signal generation while addressing whipsaws during consolidating markets. Rather than relying on
Overview RVI Scanner Dashboard Pro is a multi-symbol and multi-timeframe analytical utility engineered for MetaTrader. In financial markets, tracking multiple instruments across various timeframes simultaneously creates significant cognitive load. This dashboard solves this by aggregating decentralized market data into a cohesive Graphical User Interface (GUI). Its primary objective is to monitor continuous data feeds to detect momentum shifts and potential trend reversals based on the Relative
Senkou Span B Dynamic Rejection and Multi-Filter Confluence Framework for MetaTrader 5 Overview The Senkou Span B Dynamic Rejection Indicator is a modular technical analysis system designed for the MetaTrader 5 platform. It identifies institutional price interactions around the Senkou Span B equilibrium line of the Ichimoku Kinko Hyo model. Senkou Span B represents the 52-period midpoint value projected into the market structure, serving as a primary indicator of medium-to-long term support, r
1. Overview Stochastic Multi-Filter Suite is a specialized technical indicator engineered natively for the MetaTrader 5 (MT5) trading platform. The software integrates George Lane's classical Stochastic Oscillator engine with a modular 14-filter algorithmic confirmation framework designated as the MultiFilter Suite. Developed specifically for systematic technical analysts, multi-asset discretionary traders, and quantitative chartists, the indicator transforms standard momentum oscillators into
OVERVIEW Stochastic Scanner Dashboard is a professional analytical utility and multi-symbol, multi-timeframe signal indicator designed for MetaTrader. The primary objective of this tool is to simultaneously monitor multiple financial instruments and timeframes to identify potential market entries based on the Stochastic Oscillator. It eliminates the need to open multiple charts by consolidating all active signals, price levels, and dynamic Risk/Reward calculations into a single interactive grap
Pro Traders Dynamic Index TDI rsi BB Signal Filter - Technical Specification and User Manual 1. Product Overview and Structural Architecture Pro Traders Dynamic Index TDI rsi BB Signal Filter is a multi-layered technical analysis indicator developed natively for the MetaTrader 5 trading platform. The architecture integrates the mathematical models of the classic Traders Dynamic Index (TDI), an adaptive dual-speed Relative Strength Index (RSI) dynamic line engine, baseline volatility envelope ch
필터:
리뷰 없음
리뷰 답변