Williams percent Range WPR Scanner Dash All PairTF

Overview
The WPR Scanner Dashboard Pro MT5 is a comprehensive technical analysis utility and multi-symbol signal scanner designed for the MetaTrader 5 terminal. The primary objective of this tool is to monitor multiple currency pairs and timeframes simultaneously to identify potential market reversal and breakout zones based on the Williams Percent Range (WPR) oscillator. To ensure high-quality signal generation, the core WPR logic is heavily augmented by a proprietary 14-filter framework and an automated Average True Range (ATR) calculation module for dynamic Stop Loss and Take Profit level projection. This utility functions strictly as an analytical charting and tracking dashboard to assist technical traders in managing complex multi-asset observation without cluttering the workspace.

Operating Principle and Signal Logic
The core algorithm relies on the Williams Percent Range (WPR) to measure overbought and oversold market conditions. The system does not operate as a black box; the entire mathematical logic is transparent. 
Buy Signal Generation: A bullish setup is initially "armed" when the WPR line drops to or below the user-defined Buy Touch Level (oversold territory). The actual Buy signal is triggered only when the WPR line breaks out and crosses above the Buy Break Level. 
Sell Signal Generation: A bearish setup is "armed" when the WPR line rises to or above the Sell Touch Level (overbought territory). The actual Sell signal is triggered when the WPR line crosses down below the Sell Break Level. 
Signal Validity and Repaint Behavior: All primary WPR signal calculations, moving averages, momentum oscillators, and logical checks are executed strictly on closed bars (Bar 1 and beyond). This ensures that once a signal is printed upon the close of a candle, the trigger condition is locked and will not repaint, shift, or disappear. However, if the user explicitly activates the "Fibonacci Filter" which relies on the ZigZag algorithm, users must note that ZigZag peak and trough detection evaluates dynamic swing highs and lows which can adjust to new extremes in real-time. 
Dynamic Risk Projections: Upon a valid signal trigger, the software calculates operational risk levels using the Average True Range (ATR). The Stop Loss distance is determined by multiplying the current ATR value by a user-defined multiplier. Take Profit 1 and Take Profit 2 are then automatically projected using fixed Risk-to-Reward (RR) ratios based on the calculated Stop Loss distance, plotting clear operational levels directly on the chart overlay.

The 14-Tier Validation Filter Framework
To prevent premature entries during strong trending phases or flat consolidations, the generated WPR signals must pass a strict sequence of logical gates if activated by the user in the input parameters.
1. RSI Cross Filter: Evaluates momentum shifts. A buy requires the RSI to cross above the oversold threshold from the previous closed bar to the current closed bar.
2. ADX Trend Filter: Measures trend strength. Signals are only permitted if the Average Directional Movement Index is above a specified minimum threshold.
3. Single MA Filter: A baseline trend filter ensuring buy signals only occur when the closing price is above the specified Moving Average, and sell signals when below.
4. Ichimoku Senkou Span B Filter: Utilizes the long-term equilibrium cloud line. Buy signals require price to be above Senkou Span B; sell signals require price below it.
5. RSI 75 Filter: A long-term relative strength baseline validating the macro trend bias (above 50 for bulls, below 50 for bears).
6. Double MA Filter: Evaluates short-term versus long-term momentum via Moving Average crossovers (Fast MA > Slow MA for buys).
7. Awesome Oscillator Filter: Analyzes market driving force via zero-line crossovers, color changes, and specific volume threshold minimums/maximums.
8. Parabolic SAR Filter: Validates the immediate trailing price action direction.
9. Heiken Ashi Filter: Re-calculates standard OHLC data into averaged Heiken Ashi synthetic candles, ensuring the synthetic close is favorable to the signal direction.
10. CCI Trend Filter: Validates the macro cycle. Buy signals require a positive Commodity Channel Index value.
11. CCI OB/OS Filter: Rejects signals unless the CCI confirms extreme exhaustion beyond the overbought/oversold boundaries.
12. RVI Trend Filter: Confirms the underlying trend vigor using the Relative Vigor Index baseline.
13. MACD Filters (Histogram & Zero Line): Validates momentum using the Moving Average Convergence Divergence main line relative to the signal line or the zero baseline.
14. Price Action Filters (Support/Resistance & Fibonacci): The SR filter dynamically calculates recent extreme highs and lows within a defined period, requiring price to be interacting with these zones. The Fibonacci filter utilizes a ZigZag engine to plot retracement levels, passing signals only if the price action is rejecting the specified Fibonacci ratios.

Key Features
- Automated multi-symbol and multi-timeframe scanning engine operating entirely from a single chart window.
- Fully interactive graphical user interface (GUI) dashboard with draggable positioning, minimization capabilities, and multi-column sorting (Pair, Timeframe, Direction, Time).
- One-click chart switching: Clicking the 'OPEN' button on any dashboard row instantly changes the active chart to the signal's specific symbol and timeframe.
- Automatic chart overlay drawing: Projects the exact Entry, Stop Loss, Take Profit 1, and Take Profit 2 levels on the chart using trend lines and text labels.
- Resource-efficient memory management allowing the user to limit the number of bars processed and the frequency of scanning intervals.

Operation and Setup Recommendations
Recommended Instruments: This utility can be applied to all highly liquid financial instruments including Major Forex pairs (EURUSD, GBPUSD, USDJPY), Minors, and Commodities (XAUUSD). Users are advised to evaluate the typical spread characteristics of their broker before enabling minor pairs.
Recommended Timeframes: The algorithm supports all standard timeframes. For intraday operations, M15, M30, and H1 are recommended. For swing analysis, H4 and D1 are optimal.
Account Environment: Standard, ECN, or Raw Spread accounts are supported. Both Hedging and Netting account structures are compatible as this is an analytical tool, not an automated trade executor.
Hardware Considerations: Dashboard scanners require CPU resources to process multiple data arrays. If operating on lower-end hardware, restrict the "InpMaxSymbols" parameter and increase the "InpScanSec" interval to reduce terminal computational load.

Input Parameters List
[Scanner Settings]
InpSymbols (Default: EURUSD,GBPUSD,USDJPY,AUDUSD,USDCAD,USDCHF,NZDUSD,EURJPY,GBPJPY,XAUUSD) -> Comma-separated list of market symbols to scan. Leave blank to use Market Watch.
InpTimeframes (Default: M5,M15,M30,H1,H4) -> Comma-separated list of timeframes to monitor.
InpUseWatch (Default: true) -> Enable to ignore InpSymbols and automatically scan all pairs visible in the MT5 Market Watch window.
InpMaxSymbols (Default: 10) -> Maximum number of concurrent symbols the dashboard is allowed to load into memory.
InpScanSec (Default: 7) -> The time interval in seconds between each complete market scan cycle.
InpBarsCopy (Default: 120) -> The depth of historical bars retrieved from the server per timeframe for calculation.
InpLookback (Default: 100) -> The maximum number of past bars the scanner will search to locate the most recent valid signal.
InpDirection (Default: 0) -> Signal direction filter: 0=Both Buy and Sell, 1=Buy Only, 2=Sell Only.

[WPR Settings]
InpWPRPeriod (Default: 14) -> The calculation period for the Williams Percent Range oscillator.
InpBuyTouchLevel (Default: -80.0) -> The WPR value threshold required to arm a bullish setup.
InpBuyBreakLevel (Default: -55.0) -> The WPR value threshold that must be broken upwards to trigger a Buy signal.
InpSellTouchLevel (Default: -20.0) -> The WPR value threshold required to arm a bearish setup.
InpSellBreakLevel (Default: -45.0) -> The WPR value threshold that must be broken downwards to trigger a Sell signal.

[ATR SL & TP Settings]
InpATRPeriod (Default: 14) -> The number of bars used to calculate the Average True Range for risk projection.
InpATRMultSL (Default: 1.5) -> The multiplier applied to the ATR value to calculate the Stop Loss distance in points.
InpTP1_RR (Default: 1.0) -> Risk-to-Reward ratio for Take Profit 1 (e.g., 1.0 means TP distance equals SL distance).
InpTP2_RR (Default: 2.0) -> Risk-to-Reward ratio for Take Profit 2 (e.g., 2.0 means TP distance is twice the SL distance).

[RSI Cross Filter]
Use_RSI_Cross_Filter (Default: false) -> Enable or disable the RSI crossover momentum filter.
RSI_Length (Default: 14) -> The calculation period for the Relative Strength Index.
RSI_Price_Source (Default: PRICE_CLOSE) -> The applied price data used for RSI calculation.
Oversold (Default: 30.0) -> The lower RSI boundary limit.
Overbought (Default: 70.0) -> The upper RSI boundary limit.

[ADX Filter]
Use_ADX_Filter (Default: false) -> Enable or disable the Average Directional Index trend strength filter.
ADX_Period (Default: 10) -> The calculation period for the ADX indicator.
ADX_Min_Level (Default: 20.0) -> The minimum ADX main line value required to permit a signal.

[Single MA Filter]
Use_MA_Filter (Default: false) -> Enable or disable the single Moving Average baseline filter.
MA_Period (Default: 50) -> The number of bars for the MA calculation.
MA_Method (Default: MODE_SMA) -> The smoothing method (Simple, Exponential, Smoothed, Linear Weighted).
MA_Applied (Default: PRICE_CLOSE) -> The applied price for the MA calculation.
MA_Shift (Default: 0) -> The horizontal bar shift offset for the MA.

[Ichimoku Senkou Span B Filter]
Use_Ichimoku_Filter (Default: false) -> Enable or disable the Ichimoku cloud equilibrium filter.
Ichimoku_SenkouB (Default: 52) -> The period setting for the Senkou Span B line calculation.
Ichimoku_Kijun (Default: 26) -> The period setting for the Kijun-sen baseline.

[RSI 75 Filter]
Use_RSI75_Filter (Default: false) -> Enable or disable the secondary long-term RSI trend filter.
RSI_Filter_Period (Default: 75) -> The extended calculation period for this specific RSI instance.
RSI_Filter_Price (Default: PRICE_CLOSE) -> Applied price for the RSI 75 calculation.

[Double MA Filter]
Use_DoubleMA_Filter (Default: true) -> Enable or disable the dual Moving Average crossover filter.
MA_A_Period (Default: 9) -> The calculation period for the Fast Moving Average.
MA_A_Method (Default: MODE_EMA) -> The smoothing method for the Fast MA.
MA_A_Applied (Default: PRICE_CLOSE) -> The applied price for the Fast MA.
MA_A_Shift (Default: 0) -> The bar shift offset for the Fast MA.
MA_B_Period (Default: 50) -> The calculation period for the Slow Moving Average.
MA_B_Method (Default: MODE_EMA) -> The smoothing method for the Slow MA.
MA_B_Applied (Default: PRICE_CLOSE) -> The applied price for the Slow MA.
MA_B_Shift (Default: 0) -> The bar shift offset for the Slow MA.

[Awesome Oscillator Filter]
Use_AO_Filter (Default: false) -> Enable or disable the Bill Williams Awesome Oscillator filter.
Use_AO_Volume_Filter (Default: false) -> Enable to restrict signals based on specific AO histogram extreme values.
AO_Buy_Min (Default: 4.0) -> Minimum positive histogram value required for buys.
AO_Sell_Max (Default: -4.0) -> Maximum negative histogram value required for sells.
Use_AO_Color_Filter (Default: false) -> Enable to require the AO histogram color to align with the signal direction.
Use_AO_Zero_Filter (Default: false) -> Enable to require the AO histogram to be on the correct side of the zero line.

[Parabolic SAR Filter]
Use_SAR_Filter (Default: false) -> Enable or disable the Parabolic Stop and Reverse trend filter.
SAR_Step (Default: 0.02) -> The acceleration factor step size for the SAR calculation.
SAR_Maximum (Default: 0.2) -> The maximum acceleration limit for the SAR calculation.

[Heiken Ashi Filter]
Use_HeikenAshi_Filter (Default: true) -> Enable or disable the synthetic Heiken Ashi candle filter logic.

[CCI Trend Filter]
Use_CCI_Filter (Default: false) -> Enable or disable the standard Commodity Channel Index filter.
CCI_Period (Default: 50) -> The calculation period for the CCI indicator.
CCI_Applied (Default: PRICE_CLOSE) -> The applied price used for CCI calculation.

[CCI OB & OS Filter]
Use_CCI_OBOS_Filter (Default: false) -> Enable or disable the extreme boundary Commodity Channel Index filter.
CCI_OBOS_Period (Default: 14) -> The calculation period for the extreme CCI filter.
CCI_OBOS_Applied (Default: PRICE_CLOSE) -> The applied price used for calculation.
CCI_Overbought (Default: 100.0) -> The upper extreme boundary for the CCI.
CCI_Oversold (Default: -100.0) -> The lower extreme boundary for the CCI.

[RVI Filters]
Use_RVI_Filter (Default: false) -> Enable or disable the Relative Vigor Index main line trend filter.
RVI_Period (Default: 75) -> The period for the RVI main line calculation.
Use_RVI_Signal_Filter (Default: false) -> Enable or disable the RVI main line versus signal line crossover filter.
RVI_Signal_Period (Default: 20) -> The period for the RVI signal line calculation.

[MACD Filters]
Use_MACD_Filter (Default: false) -> Enable or disable the MACD main line versus signal line histogram filter.
MACD_FastEMA (Default: 12) -> The period for the MACD fast exponential moving average.
MACD_SlowEMA (Default: 26) -> The period for the MACD slow exponential moving average.
MACD_SignalSMA (Default: 9) -> The period for the MACD signal line simple moving average.
MACD_Applied (Default: PRICE_CLOSE) -> The applied price for MACD calculations.
Use_MACD_Zero_Filter (Default: false) -> Enable or disable the MACD zero-level baseline cross filter.

[Support & Resistance Filter]
Use_SR_Filter (Default: false) -> Enable or disable the dynamic Price Action boundary filter.
SR_Period (Default: 50) -> The lookback period in bars to determine local support and resistance extremes.
SR_Zone_Points (Default: 80) -> The tolerance zone width in points around the calculated SR extremes to validate a touch.

[Fibonacci Filter]
Use_Fib_Filter (Default: false) -> Enable or disable the dynamic ZigZag-based Fibonacci retracement filter.
Fib_Level_1 (Default: 0.382) -> The primary Fibonacci retracement ratio boundary.
Fib_Level_2 (Default: 0.618) -> The secondary Fibonacci retracement ratio boundary.
ZigZag_Depth (Default: 12) -> The depth parameter for the underlying ZigZag peak/trough engine.
ZigZag_Deviation (Default: 5) -> The deviation threshold for the ZigZag engine.
ZigZag_Backstep (Default: 3) -> The backstep bar parameter for the ZigZag engine.

[Alerts & Notifications]
InpAlertPopup (Default: false) -> Enable native MetaTrader terminal pop-up window alerts.
InpAlertSound (Default: false) -> Enable audio playback upon signal detection.
InpSoundFile (Default: alert.wav) -> The filename of the wav audio to be played.
InpAlertPush (Default: false) -> Enable push notifications to the MetaTrader mobile application.
InpAlertEmail (Default: false) -> Enable email transmission of signals via terminal SMTP settings.
InpEmailSubject (Default: WPR Scanner Signal) -> The subject line format for generated email alerts.
InpAlertOnlyNew (Default: false) -> When enabled, the system restricts alerts strictly to newly formed signals to prevent repetition.

[Display & Layout]
InpX (Default: 12) -> The horizontal X-axis starting pixel coordinate for the dashboard panel.
InpY (Default: 28) -> The vertical Y-axis starting pixel coordinate for the dashboard panel.
InpScale (Default: 100) -> The graphical scaling percentage of the entire dashboard interface (acceptable range 70-160).
InpRowH (Default: 18) -> The pixel height of each individual data row inside the dashboard table.
InpFont (Default: 8) -> The base font size for the dashboard text rendering.
InpPadX (Default: 8) -> The internal pixel padding on the left side of the dashboard elements.
InpWPair (Default: 68) -> Pixel width for the Symbol Pair column.
InpWTF (Default: 34) -> Pixel width for the Timeframe column.
InpWArah (Default: 44) -> Pixel width for the Direction (Buy/Sell) column.
InpWTime (Default: 96) -> Pixel width for the Signal Time stamp column.
InpWEntry (Default: 64) -> Pixel width for the Entry Price coordinate column.
InpWSL (Default: 64) -> Pixel width for the Stop Loss coordinate column.
InpWTP1 (Default: 64) -> Pixel width for the Take Profit 1 coordinate column.
InpWTP2 (Default: 64) -> Pixel width for the Take Profit 2 coordinate column.
InpWWPR (Default: 46) -> Pixel width for the internal WPR value reading column.
InpWUmur (Default: 42) -> Pixel width for the Signal Age tracking column.
InpWOpen (Default: 44) -> Pixel width for the interactive Chart Open action button.
InpShowEmpty (Default: false) -> Enable to render rows for scanned symbols even if no valid signal is currently detected.
InpMaxRows (Default: 18) -> The absolute maximum number of signal rows visually rendered on the interface to manage screen real estate.

[Sorting Options]
InpSortBy (Default: SORT_TIME) -> Defines the default initialization sorting metric (Sort by Time, Pair, Timeframe, or Direction).
InpSortNewest (Default: true) -> Boolean toggle to position the most recently generated signals at the top of the dashboard list.

[Chart Overlay Signals]
InpDrawOnChart (Default: true) -> Enable visual rendering of trendlines and text labels on the active chart window.
InpShowArrow (Default: true) -> Enable rendering of directional Wingdings arrows at the signal entry bar.
InpShowLevels (Default: true) -> Enable plotting of horizontal dashes representing Entry, SL, TP1, and TP2 directly on the price chart.
InpExtendBars (Default: 25) -> The horizontal length in bars that the visual overlay lines will extend into the future.
InpArrowCodeBuy (Default: 233) -> The specific Wingdings character code for the bullish arrow.
InpArrowCodeSell (Default: 234) -> The specific Wingdings character code for the bearish arrow.
InpArrowSize (Default: 2) -> The graphical scaling size of the rendered directional arrows.
InpArrowDistance (Default: 20) -> The vertical distance in points from the candle high/low to place the arrow object.

[Color Theme]
InpColBg (Default: C'18,22,28') -> Base background color of the dashboard panel.
InpColHead (Default: C'32,38,48') -> Background color of the dashboard header and title area.
InpColRow (Default: C'24,28,36') -> Primary background color for alternating table rows.
InpColRow2 (Default: C'28,33,42') -> Secondary background color for alternating table rows (zebra striping).
InpColText (Default: C'220,225,230') -> Base font color for standard informational text.
InpColBull (Default: C'0,230,118') -> Font and element color associated with Bullish / Buy signals.
InpColBear (Default: C'255,82,82') -> Font and element color associated with Bearish / Sell signals.
InpColMute (Default: C'120,128,140') -> Font color used for muted, secondary, or inactive textual data.
InpColAccent (Default: C'0,200,255') -> Highlight color for interactive buttons and key data points.
InpColArrowBuy (Default: C'0,230,118') -> Specific color for the bullish chart overlay arrow.
InpColArrowSell (Default: C'255,82,82') -> Specific color for the bearish chart overlay arrow.
InpColEntry (Default: C'41,128,255') -> Color applied to the visual Entry line on the chart.
InpColSL (Default: C'255,82,82') -> Color applied to the visual Stop Loss line on the chart.
InpColTP1 (Default: C'0,200,83') -> Color applied to the visual Take Profit 1 line on the chart.
InpColTP2 (Default: C'0,230,118') -> Color applied to the visual Take Profit 2 line on the chart.

Risk Disclaimer:
Trading foreign exchange, commodities, and other financial instruments involves significant risk and may not be suitable for all investors. Past performance does not guarantee future results. This software is an analytical and operational tool designed strictly to assist traders in technical chart analysis; it does not guarantee financial profit or eliminate market exposure. Always thoroughly test the product on a demo account environment to fully understand its calculation dynamics and operational behavior before considering deployment in live trading environments.
추천 제품
Awesome Market Structure MT5
Komang Putra Riswanjaya
OVERVIEW The market structure indicator helps traders easily read market trends, this indicator shows trend continuity and trend reversals, this tool will be very useful for beginners who are just getting to know market structure, the indicator will provide visualization of the patterns that occur Key Features: BOS pattern The indicator will provide an overview of the Break Of Structure pattern, where the pattern will indicate the continuation of the trend.  CHOCH Pattern The indicator will pr
Mercury Solar Pro
Enzo Daniel Bergeron
Title: Mercury Solar Pro Description: Mercury Solar Pro is a specialized algorithmic trading system designed exclusively for the GBPUSD pair on the M15 timeframe. Unlike static risk models, Solar Pro utilizes dynamic risk allocation and time-based volatility tracking to navigate both accumulation and expansion market phases. This system is engineered to address the specific requirements of proprietary trading firm challenges, focusing on risk management, drawdown control, and execution during s
EquityEngine
Marco Resseghini
EquityEngine으로 포트폴리오를 강화하세요: NASDAQ의 장점을 최대한 활용한 자동 트레이딩 봇! EquityEngine은 트레이딩 세계에서 새로운 동맹입니다. NASDAQ에서 트레이딩하도록 설계된 이 고급 봇은 최첨단 알고리즘을 사용하여 최상의 시장 기회를 식별하고 포착하여 중단 없이 트레이딩을 최적화합니다. 지능형 자동 트레이딩: EquityEngine은 수천 개의 데이터 포인트를 실시간으로 분석하여 최대한 정확하게 트레이딩을 실행합니다. 실시간 시장 업데이트: 끊임없는 시장 데이터와 내장된 예측으로 최신 트렌드를 앞서가세요. 고급 자본 보호: 자본을 보호하고 손실을 최소화하기 위한 내장된 위험 관리 전략. 기회를 놓치지 마세요: EquityEngine을 사용하면 모든 시장 움직임을 수익으로 전환할 수 있습니다! EquityEngine을 사용하면 트레이딩이 완전히 자동화되고 최적화된 경험이 됩니다. AI가 당신을 위해 일하게 하여 투자가 성장하는 동안 다른 일을 할 수
Send me a message so I can send you the setfile 다양한 구성이 가능한 견고한 로봇 아래 스크린샷의 설정에 따라 10분 기간으로 BTC를 사용하세요. 전문가 로봇을 구매할 경우, 로봇을 지속적으로 개선하기 위해 수정을 요청할 권리가 있습니다. 주요 특징 이동 평균 교차 전략: EA는 두 개의 이동 평균선(MA1과 MA2)을 사용하여 거래 신호를 생성합니다. 빠른 MA(MA1)가 느린 MA(MA2) 위 또는 아래로 교차하면 거래가 시작됩니다. 마팅게일 전략: 거래에서 손실이 발생하면 다음 거래의 로트 크기가 승수(마팅게일 승수)만큼 증가합니다. 마팅게일 시퀀스는 승리한 거래 후 또는 최대 마팅게일 단계 수(maxMartingale)에 도달하면 재설정됩니다. 위험 관리: 손절매(SL) 및 이익실현(TP) 수준은 구성 가능합니다. 수익을 확보하고 손실을 최소화하기 위해 추적 정지 및 손익분기점 기능이 포함되었습니다. 일일 이익/손
Space X
Marta Gonzalez
Space X  it is a Secure Automated Software for trade Forex market and indices. The architecture is a Fully Automatic Autonomous Robot Expert capable of independently analyzing the market and making trading decisions Space X It is an advanced and professional trading system. This is a FULL configurable system.     Space X     is a professional system, Ready to personalized your profile.                            You can download the demo and test it yourself.                        Space X 18
Moriarti Hits Pro
Guillermo Julian Moreno Coma
Product Title: Moriarti Hits Pro: Institutional AI Gold Algo Description: Moriarti Hits Pro is not a simple moving average crossover; it is an institutional-grade quantitative ecosystem designed exclusively to dominate Gold (XAUUSD) volatility. Powered by a Neuro-Fractal Engine, the algorithm doesn't just analyze the past—it learns in real-time through weight adaptation (Online Learning), continuously adjusting its decision-making to dynamic market conditions. Developed for long-term survival an
VIX Momentum Pro EA - 제품 설명 개요 VIX Momentum Pro는 VIX75 합성 지수 전용으로 설계된 정교한 알고리즘 거래 시스템입니다. 이 알고리즘은 합성 변동성 시장에서 고확률 거래 기회를 식별하기 위해 독점적인 모멘텀 탐지 기술과 결합된 고급 다중 시간프레임 분석을 사용합니다. 거래 전략 Expert Advisor는 여러 시간프레임에 걸쳐 가격 움직임을 분석하는 포괄적인 모멘텀 기반 접근법으로 작동합니다. 시스템은 VIX75 특성에 특화된 가격 패턴의 수학적 분석을 통해 방향성 모멘텀을 식별합니다. 진입 신호는 모멘텀 수렴, 변동성 임계값, 방향성 편향 확인을 포함한 여러 기술적 조건이 일치할 때 생성됩니다. 이 전략은 기존 지표 의존성을 피하고 대신 합성 지수 행동에 특별히 보정된 독점 수학 모델에 의존합니다. 이 접근법은 알고리즘이 합성 시장의 독특한 24/7 거래 환경에서 효과적으로 작동할 수 있게 합니다. 위험 관리 VIX Momentum Pro
Heat Map Pro mt5
Augusto Martins Lopes
Heat Map Indicator - Advanced Volume Analysis Introducing the Heat Map Indicator - A Professional Tool for Market Volume Analysis! **Key Features** **Visual Heat Map** - Instant volume intensity visualization through colors - Blue: Low volume - Green: Medium volume - Yellow/Orange: Increasing volume - Red: High volume **Intuitive Interface** - Dynamic color scale - Real-time percentage indicator - Current level indicator - Customizable colors and transparency **Smart Alert System** - Custo
Synthesis X Neural EA
Thanaporn Sungthong
Forget Everything You Know About Trading Robots. Introducing Synthesis X Neural EA , the world's first Hybrid Intelligence Trading System . We have moved beyond the limitations of simple, indicator-based EAs to create a sophisticated, two-part artificial intelligence designed for one purpose: to generate stable, consistent portfolio growth with unparalleled risk management. Synthesis X is not merely an algorithm; it is a complete trading architecture. It combines the immense analytical power of
Provlepsis 지표에 오신 것을 환영합니다. "Provlepsis"는 MQL 마켓을 위해 개발된 고급 지표입니다. 같은 시간대의 이전 바를 분석하여 시장 움직임의 잠재적 범위를 정확하게 계산하여 향후 가격 변동에 대한 소중한 통찰력을 제공합니다. 전통적인 ATR 지표와 달리 "Provlepsis"는 시간 요소를 고려하여 다양한 시장 조건에 적응하는 더 강력한 도구입니다. 밤에는 좁은 범위를 예측하고 활발한 거래 시간대에는 더 넓은 범위를 예측합니다. "Provlepsis"가 제공하는 포괄적인 범위 분석으로 거래 전략에서 경쟁 우위를 확보하세요. 여기에서 Provlepsis 지표의 길이와 시프트를 변경할 수 있는 전체 버전을 확인할 수 있습니다! https://www.mql5.com/ko/market/product/98802 프로블렙시스 사용의 이유 범위 기반 트레이딩: 이 지표는 시장 움직임의 잠재적 범위를 식별하는 능력으로 범위 기반 트레이딩 전략에 가치를 제공할 수 있
FREE
ELTRA Guardian EA
Aziz Maulidi Wimantara
Proven consistent performance — backtested from 2021 to 2025 with steady growth every week, month, and year. ELTRA Guardian EA is a fully automated Expert Advisor exclusively optimized for trading XAU/USD (Gold) . It combines precise level-based entries with EMA trend filtering to deliver consistent performance in volatile gold markets. Key Features: Gold-Only Strategy: Specifically designed and tuned for XAU/USD. Fixed Price Levels: Executes trades only when price touches 4-point interv
Quant Pro AI
Ignacio Agustin Mene Franco
Quant Pro AI Expert Advisor for XAUUSD (Gold) Quant Pro AI is a next-generation expert advisor specifically designed for trading the Gold (XAUUSD) market on the M5 timeframe. Developed with an advanced combination of artificial intelligence, quantitative analysis, and high-precision algorithms, it aims to capture high-probability movements in one of the market's most profitable and volatile instruments. Key Features: Exclusive Focus on XAUUSD: Optimized and thoroughly tested on the Gold vs. U
강세 및 약세 3선 스트라이크 형성을 찾는 것 외에도 이 다중 기호 및 다중 시간 프레임 표시기는 다음 촛대 패턴을 스캔할 수도 있습니다(패턴 설명은 스크린샷 참조). 백병 3명(역전>연속 패턴) 검은 까마귀 3마리(역전>연속 패턴) 지표 설정의 엄격한 옵션이 활성화된 경우 대형은 더 높은 시간 프레임에 자주 나타나지 않습니다. 그러나 그렇게 할 때 그것은 매우 높은 가능성의 설정입니다. Thomas Bulkowski(국제적으로 알려진 촛대 패턴의 저자이자 선도적인 전문가)에 따르면 Three line strike는 모든 촛대 패턴의 전체 성능 순위가 가장 높습니다. 고유한 규칙 및 기술과 결합하여 이 표시기를 사용하면 강력한 시스템을 생성(또는 강화)할 수 있습니다. 특징 Market Watch 창에 표시되는 모든 기호를 동시에 모니터링할 수 있습니다. 하나의 차트에만 지표를 적용하고 전체 시장을 즉시 모니터링하십시오. M1에서 MN까지 모든 시간 프레임을 모니터링할 수 있으며 패
Strike Zone EA MT5
Matteo Schizzerotto
Strike Zone은 OHLC 캔들스틱 차트 패턴을 기반으로 한 Expert Advisor이며, 모든 백테스트는 10년간의 전문가 활동을 기반으로 합니다. 백테스트에는 고정 매개변수가 사용되었습니다: 1쌍, $10,000 자본 및 0.1랏의 시장 진입. 며칠 동안 테스트한 후 이 Expert Advisor는 다음 쌍과 기간에서 수익성이 있음이 입증되었습니다. 아우디캐드 H4 NAS100 NZDCAD H1 USDCAD H1 백테스트는 미래 이익을 보장하지 않으며, 이 도구의 사용은 이를 사용하는 사람의 전적인 책임입니다. 다음 EA를 실제 계정에 넣기 전에 데모 계정에서 테스트해야 합니다. oooooooooooooooooooooooooooooooooooooooooooooooooo
FREE
Orderflow7
Antony Kiragu Maina
NY OPEN ORDERFLOW The Intelligence Behind the Market. NY OPEN ORDERFLOW is an intelligent algorithmic trading system engineered to interpret market structure, identify liquidity traps, and recognize failed auctions around the New York trading session. Inspired by the analytical precision of institutional trading, it transforms price action into systematic trading decisions. Rather than blindly chasing momentum, NY OPEN ORDERFLOW observes how price behaves around key levels, detects potential bre
EA MARS SCALP PRO Professional Automated Scalping Expert Advisor for MetaTrader 5 EA MARS SCALP PRO is a professional automated trading system designed for traders who want fast, disciplined, and systematic execution on MetaTrader 5 . The EA is built to identify short-term trading opportunities and execute orders automatically according to its programmed trading logic, helping reduce emotional decision-making and manual execution errors. Key Features Fully Automated Trading Automatically analyz
Entry Pointz Pro
Thabang John Wotsa
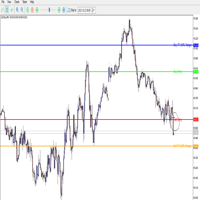
This custom MT5 indicator automatically draws trading levels based on the previous H4 candlestick. It is designed to help traders quickly identify potential entry and take profit (TP) points according to a simple breakout strategy. What it does:- Draws Buy Entry line at the previous H4 High.- Draws Sell Entry line at the previous H4 Low.- Calculates the 50% range of the previous H4 candle and plots: • Buy TP line above the High. • Sell TP line below the Low.- Adds text labels directly on the cha
Gladiator Gold Pro
Mohammed Nentoussi
Gladiator Gold Pro — 전문 골드 자동매매 엔진 오늘날의 금융시장에서 금(XAU/USD)은 세계에서 가장 높은 변동성과 막대한 자본이 거래되는 금융상품 중 하나입니다. Gladiator Gold Pro는 시장 모멘텀, 자금 흐름, 그리고 엄격한 리스크 관리를 기반으로 한 규율 있는 알고리즘 거래를 원하는 전문 골드 트레이더를 위해 오직 XAU/USD 전용으로 개발되었습니다. Grid(그리드), Martingale(마틴게일), 또는 손실 복구 전략과는 달리, Gladiator Gold Pro는 전략의 모든 수학적 거래 조건이 완전히 충족될 때에만 거래를 실행합니다. 백테스트 성과 고변동성 테스트 (2026년 1월 1일부터) • 초기 자금: 100,000 USD • 데이터 품질: 100% (실제 Tick 데이터) • 총 순이익: 957,346.70 USD • Profit Factor: 3.76 • Sharpe Ra
SuperDuperScalper Pro MT5 는 차트의 혼란 없이 더 빠른 의사결정, 깔끔한 진입, 그리고 강력한 비주얼 대시보드를 원하는 트레이더를 위해 제작된 전문적인 MetaTrader 5 스캘핑 지표입니다. 변동성이 큰 시장에서 대부분의 트레이더는 지표를 전환하고, 추세 방향을 수동으로 확인하며, 신호가 충분히 강력한지 고민하다가 시간을 허비하곤 합니다. SuperDuperScalper Pro MT5 는 추세 감지, 신호 확인, 피보나치 목표가, 캔들 색상 지정 및 알림 기능을 하나의 완전한 시각적 거래 시스템으로 결합하여 이 문제를 해결합니다. Brijesh Jaiswal 씨가 개발한 이 지표는 트레이더가 시장 상황과 추세 방향을 빠르게 파악하고, 높은 확률의 매수 또는 매도 기회가 나타나는 시점을 포착할 수 있도록 설계되었습니다. 왜 SuperDuperScalper Pro MT5를 구매해야 할까요? 이것은 단순한 화살표 지표가 아니라, 완전한 시각적 의사결정 지원 시스템
AlgoMatrix EMA Ribbon Indicator for MetaTrader 5 Overview AlgoMatrix EMA Ribbon Indicator is a trend-following indicator developed for MetaTrader 5. It is designed to help traders identify structured market trends and reduce the impact of noisy or sideways price movements. Many indicators produce frequent signals that can create confusion rather than clarity. The goal of this indicator is different. It focuses on providing cleaner, more disciplined signals by combining an EMA ribbon structur
Multi-timeframe dashboard showing the average value of five core momentum indicators across multiple currency pairs to quickly identify overbought and oversold market conditions. What the Indicator Does Calculates a single average  value of five indicators (0–100) Uses five well-known momentum indicators Displays values across multiple timeframes and symbols Highlights oversold and overbought zones Provides a BUY / SELL decision column based on consecutive timeframe alignment Indicators Us
KT Displaced Moving Averages MT5
KEENBASE SOFTWARE SOLUTIONS
KT DMA is a modified and advanced version of the classic Displaced Moving Averages with buy/sell crossover alerts and a Multi-Timeframe scanner that shows DMA's direction across each real-time time frame. A Displaced Moving Average is a simple moving average that moves ahead or backward in a time frame (either short-term or long-term). It also allows you to predict price movement more accurately. Features Depicts the trend direction using the alignment of three moving averages. Buy/Sell signals
TrendStrengthDeviationSub TrendStrengthDeviationSub is a visual indicator package for MetaTrader 5. It summarizes recent price movement into a trend strength reading between -1 and +1, together with a confirmed trend state. The package contains two indicators that can be used together or on their own: a main-chart candle coloring indicator and a separate-window oscillator. It is an indicator only and does not open, manage or close orders. What is included The main-chart indicator colors each can
FREE
TrendStrengthDeviationMain TrendStrengthDeviationMain   is a visual indicator package for MetaTrader 5. It summarizes recent price movement into a trend strength reading between -1 and +1, together with a confirmed trend state. The package contains two indicators that can be used together or on their own: a main-chart candle coloring indicator and a separate-window oscillator. It is an indicator only and does not open, manage or close orders. What is included The main-chart indicator colors each
FREE
Weekday Stats
Elidio Xavier Guimaraes
Weekday Stats Overview Weekday Stats is a quantitative analysis indicator designed to perform statistical studies of price behavior by classifying candle data according to the day of the week on which each candle occurred. The indicator processes the historical candles of the selected asset and provides statistical information for each day of the week, allowing the user to analyze price direction and price variation separately for each weekday. The sampling period, statistical parameters, and da
Aurum Quant Logic – 전문 XAUUSD 알고리즘 Aurum Quant Logic은 XAUUSD(금) 시장 전용으로 개발된 H1 타임프레임 기반의 전문 트레이딩 시스템입니다. 고위험 Grid 또는 Martingale 방식과 달리, 순수 퀀트 분석과 변동성 돌파 로직, 엄격한 리스크 관리를 기반으로 합니다. ADX 필터가 적용된 동적 채널 돌파 전략을 사용하여 고확률 움직임만 포착합니다. 주요 특징 Prop Firm 대응: 하드 스탑로스 및 드로우다운 제한 위험한 기법 없음: 100% Price Action 머신러닝 최적화: 금의 변동성에 맞게 조정 동적 채널: 실제 추세 전환 감지 ️ 기술 사양 심볼: XAUUSD 전용 타임프레임: H1 리스크 관리: 자동 로트 또는 고정 로트 필터: ADX, ATR, 시간 필터 설정 방법 XAUUSD 차트 열기 H1 설정 EA 적용 InpRiskPercent 조정 MT5에서 “Algo Trading” 활성화 파라미터
TalentBR
Daniel Soria
TalentBR – 멀티심볼 스윙 EA | VPS 불필요 | 구조적 리스크 관리 TalentFX가 아닌 TalentBR은 독자적 패턴 로직, 장기 방향 필터, 구조적 리스크 관리를 결합한 멀티심볼 Expert Advisor로, 컴퓨터 전원이 꺼져 있어도 계속 작동하도록 설계되었습니다. VPS 불필요(핵심 차별점) • 설정이 배치되면 진입과 보호 수준이 브로커 서버에 상주: 컴퓨터가 꺼져   있어도 사이클과 그 보호가 계속 작동합니다. • 터미널을 24/7 가동할 수 없는 트레이더에게 이상적. • 시그널 윈도우 동안 터미널을 열어 두면 EA가 전체 사이클(재장착 및 규율   있는 청산)을 실시간으로 관리합니다. 작동 방식 • 장기 방향 필터로 검증된 독자적 패턴 로직(노출된 파라미터 없음). • 구조적 스탑로스: 시그널 캔들 자체에서 도출되며 브로커의 최소 거리   규칙에 자동 조정. • 규율 있는 청산: 시그널 캔들 종료 시, 반대 시그널 시, 또는 월말 청산   윈도우에서
Multi Timeframe Currency Strength Panel
Narayanan Mohanan Mohanan Krishnan
MTF Currency Strength Panel for MetaTrader 5 멀티 타임프레임 통화 강도 지표: 28개 주요 통화쌍 전체를 하나의 차트에서. 이 통화 강도 패널은 주요 8개 통화가 현재 어디에 있는지, 그리고 28개 주요 통화쌍이 M1부터 MN1까지 아홉 개 시간프레임에서 어떻게 움직였는지를 함께 보여줍니다. 두 정보가 하나의 차트에 표시되며 타이머로 갱신됩니다. 통화쌍만 순위로 나열하면 판단을 그르치기 쉽습니다. 한 통화가 움직이면 그 통화가 포함된 모든 쌍이 함께 움직이므로, 순위 상단은 흔히 같은 통화가 일곱 번 반복된 결과일 뿐입니다. 이 패널은 행렬 전체를 개별 통화의 강도로 분해하여 원인과 중복을 구분합니다. 분해 방식 8개 통화 각각은 28개 쌍 가운데 7개에 포함됩니다. 해당 통화의 강도는 그 7개 값의 평균이며, 그 통화가 결제통화인 경우에는 부호를 뒤집습니다. AUDJPY의 하락은 엔화 약세가 아니라 엔화 강세를 의미합니다. 각 쌍은 정확히 두 통
FREE
SunSignal ML — AI Gold Signals with Multi-Timeframe Confluence SunSignal ML is an advanced AI-powered signal indicator purpose-built for XAUUSD gold trading. It combines a proprietary adaptive trend algorithm with six machine learning models trained on confirmed price pivots to produce high-confidence entry signals with multi-timeframe validation. The indicator runs efficiently on M1, M5 and M15 timeframes and is designed for traders who want precision entries guided by data rather than guesswor
이 제품의 구매자들이 또한 구매함
Trend Sniper X
Sarvarbek Abduvoxobov
4.87 (46)
Trend Sniper X 는 트레이더가 추세 방향과 잠재적 반전 지점을 명확하고 정확하게 포착할 수 있도록 도와주는 MetaTrader 5용 멀티 타임프레임 추세 추종 지표입니다. MT4용: https://www.mql5.com/en/market/product/193245 가격 정보: 현재 가격은 프로모션 할인가이며, 향후 업데이트 및 새로운 기능이 출시됨에 따라 변동될 수 있습니다. 보너스 혜택: 본 지표 전용 무료 자동매매 Assistant EA를 받으시려면 구매 후 작성자에게 메시지를 보내주시기 바랍니다. Code2Profit 채널 멀티 타임프레임 분석으로 시장을 마스터하세요! Trend Sniper X로 승률을 극대화하는 방법: 핵심 규칙 및 세션 팁 기술 사양 플랫폼 MetaTrader 5 지표 유형 멀티 타임프레임 추세 지표 운용 타임프레임 모든 차트 타임프레임 지원, 독립적으로 선택 가능한 상위 타임프레임(M1–MN1) 주요 상품 외환, 금(XAUUSD) 및 기타 C
Smart Trend Trading System — MetaTrader 5 구매 후 MQL5에서 저에게 메시지를 보내시면 Smart Universal Expert Advisor를 무료로 받으실 수 있으며, 온라인 강좌, PDF 매뉴얼 및 비공개 그룹 이용 권한도 함께 제공됩니다. STTS는 추세 방향, 진입·청산 신호, 반전 구간, 주요 가격 수준을 차트에 모아 보여줍니다. 시스템을 참고해 수동으로 거래하거나, 별도의 호환 EA를 연결하여 선택한 설정에 따라 자동으로 거래를 실행할 수 있습니다. 하나의 시스템, 네 가지 트레이딩 접근법 STTS의 트레이딩 접근법은 크게 네 가지로 나뉩니다. • 스캘핑 — 단기 신호와 시장 움직임을 살펴봅니다. • 추세 매매 — 방향을 평가하고 추세 안에서 기회를 찾습니다. • 반전 매매 — 잠재적인 전환 구간과 방향 변화를 파악합니다. • 거래량 매매 — 거래량 기반 정보로 시장 활동을 평가합니다. 진입·청산 화살표, 추세 정보, 지지·저항 수
새로운 왕의 등장 - 인디케이터 + 주문 관리 표시(TP1 + TP2 + TP3) + 선택형 텔레그램 시그널 전송 기능 포함 (무료) (완전한 트레이딩 및 시그널 시스템) 골드를 위한 최고의 EA: Gold Slayer 이 인디케이터는 고급 전략, 사용자 지정 가능한 주문 관리 시스템, 그리고 엔벨로프 확장을 결합한 평균 회귀(mean reversion) 시스템을 포함하고 있습니다. 또한 RSI와 같은 여러 지능형 확인 필터를 통해 높은 확률의 반전 진입 구간을 포착하여 BUY 및 SELL 시그널을 제공합니다. 단순히 거래 방법만 배우는 것이 아니라, 여러 포지션을 효과적으로 관리하고 이전에 수익 중인 오픈 포지션으로 손실 거래를 커버하는 방법까지 익힐 수 있습니다. M5 전용으로 설계 및 최적화되었으며, 유동성이 풍부해 시그널이 더 깔끔하고 신뢰도 높은 BTCUSD와 XAUUSD에서 뛰어난 성능을 발휘합니다. 이 인디케이터는 ATR 기반으로 자동 계산된 진입가, 손절가, 익절가와
Entry Points Pro for MT5
Yury Orlov
4.54 (155)
Entry Points Pro는 주문을 넣기 전에 어디에서 진입하고, 스탑을 어디에 두고, 어떤 랏으로 거래할지 보여 줍니다. 가격 지금 199 USD이며, 이 가격으로는 4카피입니다. 이후 가격은 249 USD, 최종 가격은 349 USD입니다. 저는 시장에서 트레이딩으로 돈을 벌고 그것을 보여 드립니다. 그래서 이 인디케이터를 모두에게 팔 필요가 없습니다. 스스로 생각하는 트레이더를 위한 도구이지, 마법 버튼이 아닙니다. 돌파가 없으면 거래도 없습니다. 회색 화살표는 취소된 신호입니다. 가격이 신호 캔들을 돌파하지 못했으므로 진입도 손실도 없습니다. 화살표는 캔들이 마감될 때 나타나며 리페인팅되지 않습니다. 설정은 두 가지: 예치금과 거래당 리스크. 결제 전에 확인하세요: 무료 데모는 MT5 전략 테스터에서 작동하며 2분이면 됩니다. 구매 후에는 제가 직접 설정을 도와 드리겠습니다. 2019년, 저는 이 지표가 무엇을 할 수 있는지 전 세계에 보여 주었습니다. 실계좌에서 지표의
SuperScalp Pro
Van Minh Nguyen
4.54 (37)
SuperScalp Pro - Professional Multi-Layer Confluence Scalping System SuperScalp Pro는 기존 Supertrend에 여러 지능형 확인 필터를 추가하여 기능을 강화한 고급 스캘핑 지표입니다. 잘못된 신호를 크게 줄이면서 성공 가능성이 더 높은 Buy/Sell 거래 기회를 식별하는 데 도움을 줍니다. 명확한 Buy 및 Sell 화살표가 차트에 직접 표시되며, ATR 기반 Stop Loss 및 Take Profit 레벨도 실시간으로 자동 계산됩니다. 구매 후 MQL5 메시지로 저에게 연락하시면 SuperScalp Pro Auto Trader EA를 무료로 받으실 수 있으며, 사용자 가이드와 비공개 그룹 이용 권한도 제공됩니다. 권장 설정 파일 다운로드: [Set File] 전체 문서는 제품 블로그에서 확인할 수 있습니다: [User Guide] 업데이트를 받으려면 공식 채널에 참여하세요: [Official Channel]
Gann Made Easy MT5
Oleg Rodin
5 (14)
Gann Made Easy 는 mr.의 이론을 사용하여 최고의 거래 원칙을 기반으로 하는 전문적이고 사용하기 쉬운 Forex 거래 시스템입니다. W.D. 간. 이 표시기는 Stop Loss 및 Take Profit Levels를 포함하여 정확한 BUY 및 SELL 신호를 제공합니다. PUSH 알림을 사용하여 이동 중에도 거래할 수 있습니다. 구매 후 거래 방법 안내 및 유용한 추가 지표를 무료로 받으시려면 저에게 연락주세요! 아마도 Gann 거래 방법에 대해 이미 여러 번 들었을 것입니다. 일반적으로 Gann의 이론은 초보자 거래자뿐만 아니라 이미 거래 경험이 있는 사람들에게도 매우 복잡한 것입니다. Gann의 거래 방식은 이론적으로 적용하기 쉽지 않기 때문입니다. 나는 그 지식을 연마하고 Forex 지표에 최고의 원칙을 적용하기 위해 몇 년을 보냈습니다. 표시기는 적용하기가 매우 쉽습니다. 차트에 첨부하고 간단한 거래 권장 사항을 따르기만 하면 됩니다. 지표는 지속적으로 시장 분석
M5 Sniper
MeanFX
5 (4)
당신의 트레이딩 우위를 한눈에 확인하세요! M5 Sniper 는 MeanFX의 새로운 지표입니다. 정확한 트레이딩 신호 와 적응형 TP/SL 레벨 을 결합하여, 결과적으로 가능한 최고의 통계적 트레이딩을 만들어냅니다! 5회 구매마다 가격이 인상되며, 다음 가격은 69$입니다. 구매 후 저에게 메시지를 보내주시면 팁/가이드와 보너스 EA를 제공해 드립니다. 무엇이 이 지표를 특별하게 만들까요? Gold XAUUSD에서 검증된 통계적 성과 ( 거의 모든 자산에서 작동 하며, 일관된 결과 없이 모든 것을 다루려고 하기보다는 하나의 타임프레임을 완전히 익히는 데 집중합니다) 각 심볼당 하루 1~8회의 트레이드 와 높은 승률을 제공하며, 모든 통계적 우위를 우리의 편으로 가져갑니다. 차트에는 확인된 BUY 및 SELL 신호만 표시됩니다. 각 트레이드에 대해 지표가 생성하는 적응형 TP 및 SL 레벨 평균 승률 75%+ 평균 Signal Ratio 최소 1.1+ 알람 및 알림이 휴대폰 으로도
SMC Intraday Formula
VividMind Digital Solutions
5 (26)
먼저 솔직하게 말하겠습니다. 어떤 인디케이터도 단독으로 당신을 수익성 있게 만들어주지 않습니다. 누군가 그렇게 말한다면, 그는 당신에게 꿈을 파는 것입니다. 완벽한 매수/매도 화살표를 보여주는 모든 인디케이터는 완벽하게 보이도록 만들 수 있습니다 — 단지 올바른 과거 구간을 확대하고 승리한 거래만 캡처하면 됩니다. 우리는 그렇게 하지 않습니다.  SMC Intraday Formula는 도구입니다. 시장 구조를 읽고, 가장 높은 확률의 가격 구간을 표시하며, 현재 스마트 머니의 흐름이 어떻게 보이는지 아주 단순한 언어로 보여줍니다. 최종 결정은 여전히 당신이 합니다. 실행도 당신이 합니다. 하지만 이제는 희망이 아니라 정확성으로 거래하게 됩니다. 우리는 이 인디케이터를 지난 약 3년 동안 골드(XAUUSD) 및 주요 외환 통화쌍의 데이 트레이딩 스캘핑에 사용해 왔습니다. M1, M5, M15, M30에서 우리의 핵심 도구입니다. 이 도구는 미래를 예측하려 하지 않습니다 — 지금 형성
Zoryk Gold
Reda El Koutbane
4.68 (22)
ZORYK — MetaTrader 5용 XAUUSD 전문 신호 및 트레이드 플래닝 시스템 이런 경험이 있을 것입니다. 골드를 분석하고 진입을 기다린 뒤 마침내 포지션을 열었지만 가격이 곧바로 반대 방향으로 움직입니다. 너무 일찍 청산하거나 Stop Loss를 옮기거나 몇 초 동안 망설입니다. 그 후 시장은 내가 없이도 처음 예상했던 목표까지 정확히 움직입니다. 문제는 항상 방향이 아니었습니다. 진짜 문제는 불확실성이었습니다. 정확한 진입 위치를 몰랐습니다. 어느 지점에서 원래의 트레이드 아이디어가 무효가 되는지 몰랐습니다. 가까운 수익을 확보해야 할지 더 큰 움직임을 기다려야 할지 판단하기 어려웠습니다. 현재 setup이 정말 강한지 아니면 단지 새로운 거래를 억지로 찾고 있는지도 확신하기 어려웠습니다. 골드는 매우 빠르게 움직입니다. 명확한 계획이 없다면 좋은 분석도 몇 초 만에 나쁜 결정으로 바뀔 수 있습니다. ZORYK는 이 문제를 해결하기 위해 개발되었습니다.
Ultra Indicator
Ihor Otkydach
5 (1)
ULTRA는 “올인원” 방식으로 작동하는 기술적 지표로, 시장을 독자적으로 분석하고, 매매 신호를 생성하며, 손절매 주문 설정 수준을 표시하고, 이익을 실현하거나 손실을 최소화하기 위해 포지션을 청산해야 할 시점을 제안합니다. 다시 말해, 시장을 분석하는 법을 모르거나, 가격 수준(손절매를 어디에 설정할지)을 파악하지 못하거나, 자금 관리에 어려움을 겪더라도 상관없습니다. ULTRA가 그 모든 것을 대신 해줄 테니까요! 구매자 특전 : ULTRA 지표를 구매하신 후, 저에게 비공개 메시지를 보내주시면 “ULTRA BOT”을 무료 선물로 드립니다. 이 도구는 해당 지표의 신호를 바탕으로 개설한 거래를 관리하는 데 도움을 주는 특별한 도구입니다(각 거래에 대해 손절매를 설정하고, 최상의 결과를 얻을 수 있도록 전략의 규칙에 따라 거래를 자동으로 청산해 줍니다).  또한 구매자분들께 다양한 자산에 바로 적용할 수 있는 설정값을 제공해 드리고 있으며, 이를 통해 지표가 최대 효율로 작동할
GoldenX Entry MT5
VividMind Digital Solutions
5 (17)
GoldenX Entry는 MT5용 인디케이터로, 적응형 Smart Entry Trend 알고리즘, 신호 스코어링 시스템, 시장 레짐 감지 기능, 그리고 변동성 필터를 포함합니다. 각 신호에는 계산된 진입 레벨, 3개의 익절(TP1, TP2, TP3) 레벨, 그리고 손절(Stop-Loss) 레벨이 포함됩니다. 이 인디케이터는 다양한 시장 환경에 적응하도록 설계된 다중 분석 레이어 구조 위에 구축되어 있으며, 내장 최적화기와 통계 추적 시스템을 결합합니다. 또한 Risk-to-Reward(RR) 지표와 과거 거래 행동 기반의 정량 분석을 제공합니다. 시작은 간단합니다 — 선택한 타임프레임에서 최적화기를 실행한 뒤 차트에서 바로 인디케이터를 사용하면 됩니다. 핵심 기능 GoldenX Entry는 하나의 차트에서 신호 엔진, 트레이드 관리 기능, 그리고 과거 통계 추적을 통합합니다: - 내장 최적화기: 최적화기는 차트에서 원클릭으로 실행됩니다. 200개의 파라미터 조합을 두 단계 탐색
통화 강도 마법사는 성공적인 거래를 위한 올인원 솔루션을 제공하는 매우 강력한 지표입니다. 표시기는 여러 시간 프레임의 모든 통화 데이터를 사용하여 이 또는 해당 외환 쌍의 힘을 계산합니다. 이 데이터는 특정 통화의 힘을 확인하는 데 사용할 수 있는 사용하기 쉬운 통화 지수 및 통화 전력선의 형태로 표시됩니다. 필요한 것은 거래하려는 차트에 표시기를 부착하는 것뿐입니다. 표시기는 거래하는 통화의 실제 강세를 보여줍니다. 지표는 또한 추세와 거래할 때 유리하게 사용할 수 있는 구매 및 판매 거래량 압력의 극한값을 보여줍니다. 지표는 또한 피보나치에 기반한 가능한 대상을 보여줍니다. 표시기는 PUSH 알림을 포함한 모든 유형의 알림을 제공합니다. 구매 후 연락주세요. 나는 당신과 거래 팁을 공유하고 당신에게 무료로 훌륭한 보너스 지표를 줄 것입니다! 나는 당신에게 행복하고 유익한 거래를 기원합니다!
Gold Trend Coach MT5
Cristhian Alexander Gaibor Cuasquer
4.27 (11)
MetaTrader 5용 골드(XAUUSD) 매수·매도 신호, 리페인팅 없음. 모든 신호에 손절가와 세 개의 익절가가 함께 나옵니다. BOS와 CHoCH를 활용한 Smart Money Concepts 필터로 구조를 거스르지 않고 구조를 따라 매매합니다. 패널의 실시간 멘토가 진입부터 TP3까지 모든 단계를 안내합니다. 알림은 휴대폰과 나만의 Telegram 채널로 바로 옵니다. 이것이 Gold Trend Coach입니다. 이제 혼자 매매하지 마세요. 구매 시 무료 구매자 키트 제공: 1. Telegram Alert Bridge: 신호가 차트 스크린샷, 일일 리포트와 함께 나만의 Telegram 채널로 전송됩니다. 2. 사용자 매뉴얼과 설정 가이드. 받는 방법: 키트는 다운로드 파일에 들어 있지 않습니다. 구매 후 MQL5 메시지로 연락 주시면 당일에 보내드립니다. $39, $45 런칭가 물량은 매진되었습니다. 지금은 다음 10카피까지 $59, 이후 $79입니다. 먼저, 솔직한 이야
Auto Optimized SpeedAngle 은 지속적인 워크포워드 최적화(Walk-Forward Optimization, WFO)를 통해 곡선 적합(curve-fitting)을 제거한 기관 수준의 모멘텀 벡터화 시스템입니다. 시장 체제가 바뀔 때 성능이 떨어지는 정적 입력에 의존하는 대신, 이 지표는 표본 외(Out-of-Sample, OOS) 검증을 사용하여 매개변수를 동적으로 재보정하며, 표시되는 신호가 과거의 우연이 아닌 진정한 통계적 우위를 나타내도록 보장합니다. 핵심 기관용 프레임워크 워크포워드 최적화 엔진: 핵심 알고리즘은 수천 가지의 룩백(lookback) 및 임계값 조합을 지속적으로 스캔하며, 데이터를 인샘플(in-sample)과 표본 외(out-of-sample) 세트로 엄격하게 분리합니다. 미지의 데이터 환경에서 수학적 우수성이 증명된 경우에만 새로운 매개변수 구성을 채택합니다. 정량적 목적 함수: 순수한 총이익을 쫓는 대신, 최적화 엔진은 기관 수준의 안정성
Boba Analysis Suite
Trade Ready Solutions LLC
5 (2)
Boba Analysis Suite Boba Analysis Suite는 MetaTrader 5용 분석 지표입니다. 시장 구조, 주요 가격 영역, 전반적인 시장 상황을 하나의 차트 화면에 통합하여 표시합니다. 트레이더이자 트레이딩 코치로서의 실무 경험을 바탕으로 개발되었으며, 시장 방향 평가, 주요 가격 수준 식별, 여러 시간대의 종합적인 분석 등 체계적인 분석 과정을 지원합니다. 시장 맥락을 고려한 분석 개별 신호의 의미는 시장 상황에 따라 달라집니다. Boba Analysis Suite는 현재 차트 상황을 더 넓은 시장 구조와 연결하고, 사전에 정한 규칙에 따라 매매 아이디어를 검토할 수 있도록 돕습니다. 주요 분석 기능은 다음과 같습니다. 추세 및 시장 구조: 시장 방향과 관련 구조적 맥락을 평가합니다. 주요 가격 영역 및 수준: 추가 분석이 필요한 중요한 영역을 차트에 시각적으로 표시합니다. 여러 시간대: 서로 다른 시간대의 정보를 통합하여 전반적인 시장 상황을 평가합니다.
FX Power MT5 NG
Daniel Stein
5 (33)
FX Power: 통화 강세 분석으로 더 스마트한 거래 결정을 개요 FX Power 는 어떤 시장 상황에서도 주요 통화와 금의 실제 강세를 이해하기 위한 필수 도구입니다. 강한 통화를 매수하고 약한 통화를 매도함으로써 FX Power 는 거래 결정을 단순화하고 높은 확률의 기회를 발견합니다. 트렌드를 따르거나 극단적인 델타 값을 사용해 반전을 예측하고자 한다면, 이 도구는 귀하의 거래 스타일에 완벽히 적응합니다. 단순히 거래하지 말고, FX Power 로 더 스마트하게 거래하세요. 1. FX Power가 거래자에게 매우 유용한 이유 통화와 금의 실시간 강세 분석 • FX Power 는 주요 통화와 금의 상대적 강세를 계산하고 표시하여 시장 역학에 대한 명확한 통찰력을 제공합니다. • 어떤 자산이 앞서고 있고 어떤 자산이 뒤처지는지 모니터링하여 보다 현명한 거래 결정을 내릴 수 있습니다. 포괄적인 멀티 타임프레임 뷰 • 단기, 중기 및 장기 타임프레임에서 통화와 금의 강세를
Dynamic Forex28 Navigator MT5
Bernhard Schweigert
5 (1)
다중 통화 강도 및 모멘텀 지표 MT5 Dynamic Forex28 Navigator는 오랫동안 사랑받아 온 인기 지표들의 진화형으로, 다섯 가지의 힘을 하나로 결합했습니다. Advanced Currency Strength28 Indicator (리뷰 700개) Advanced Currency IMPULSE with ALERT (리뷰 530개) Currency Strength EXOTICS GOLD Impulse with Alert CS28 Combo Signals (최근 보너스) 지표 네 개를 따로 구매해 차트에 겹쳐 놓을 필요가 없습니다. 28개 Forex 페어의 강도, 이를 이끄는 시장의 모멘텀, 그리고 두 가지 모두의 알림이 하나의 강력한 지표로 통합되어 한 창, 한 차트에서 확인할 수 있습니다. 위 프로그램들은 MQL5 Market에서 1,200개 이상의 리뷰를 받았으며 2016년부터 MT4 커뮤니티의 필수 지표로 자리잡았습니다. Dynamic Forex28 Navigato
M1 Sniper MT5
Oleg Rodin
5 (7)
M1 SNIPER 는 사용하기 쉬운 거래 지표 시스템입니다. M1 시간대에 맞춰 설계된 화살표 지표입니다. 이 지표는 M1 시간대 스캘핑을 위한 단독 시스템으로 사용할 수 있으며, 기존 거래 시스템의 일부로도 사용할 수 있습니다. 이 거래 시스템은 M1 시간대 거래용으로 특별히 설계되었지만, 다른 시간대에도 사용할 수 있습니다. 원래는 XAUUSD와 BTCUSD 거래를 위해 이 방법을 설계했지만, 다른 시장 거래에도 유용하다는 것을 알게 되었습니다. 이 지표의 신호는 추세 방향과 반대로 거래될 수 있습니다. 저는 지표의 신호를 활용하여 양방향으로 거래할 수 있도록 돕는 특별한 거래 기법을 알려드립니다. 이 방법은 특별한 동적 지지선과 저항선 가격 영역을 활용하는 것을 기반으로 합니다. 구매하시면 M1 SNIPER 화살표 지표를 바로 다운로드하실 수 있습니다. 또한, 아래 스크린샷에 표시된 Apollo Dynamic SR 지표는 M1 SNIPER 도구를 사용하는 모든 사용자에게 무료로
Atomic Analyst MT5
Issam Kassas
4.51 (65)
Atomic Analyst — MetaTrader 5 구매 후 MQL5에서 저에게 메시지를 보내시면 Smart Universal Expert Advisor를 무료로 받으실 수 있으며, 온라인 강좌, PDF 매뉴얼 및 비공개 그룹 이용 권한도 함께 제공됩니다. Atomic Analyst는 가격 움직임 분석, 추세 방향, 진입·청산 신호, 손절 수준, 여러 익절 수준을 차트에 모아 보여줍니다. 신호를 확인하고 매매 상황을 이해하세요 Atomic Analyst는 분석 결과를 명확한 시각 정보로 정리합니다. • 잠재적인 진입 기회를 확인할 수 있는 매수·매도 화살표. • 거래 계획에 도움이 되는 손절 수준과 여러 익절 수준. • 시장 방향을 평가할 수 있는 추세, 강도, 모멘텀 수치. • 더 넓은 시장 맥락을 비교할 수 있는 여러 시간대 분석. • 변화하는 시장 상황을 따라갈 수 있는 색상별 캔들과 알림. 신호와 보조 분석을 함께 검토한 다음, 해당 매매 상황이 자신의 거래 규칙에
Unix Scalper
Issam Kassas
4 (4)
Unix Scalper — MetaTrader 5 구매 후 MQL5에서 저에게 메시지를 보내시면 Smart Universal Expert Advisor를 무료로 받으실 수 있으며, 온라인 강좌, PDF 매뉴얼 및 비공개 그룹 이용 권한도 함께 제공됩니다. 매매 기회를 찾고, 거래 계획을 확인하고, 실행 방법을 선택하세요. UNIX Scalper는 시장 분석, BUY/SELL/WAIT 판단, Entry, Stop Loss, TP1 및 TP2 가격 수준을 하나의 정돈된 패널에 제공합니다. 신호와 거래 계획을 한눈에 • 명확한 판단: BUY, SELL 또는 WAIT. • 구체적인 가격 수준: Entry, Stop Loss, TP1 및 TP2. • 다중 시간대 개요: 패널의 여러 시간대 신호를 비교하세요. • 판단을 돕는 분석: 추세, 모멘텀, 거래량, 변동성, 지지와 저항, 시장 품질. • 다양한 레이아웃: Minimized, Compact, Standard 또는 Full. 신호와
Smc Pro ToolKit
Talal N Z Aljarusha
5 (13)
SMC PRO TOOLKIT — SMART MONEY ANALYSIS & STRUCTURED TRADE PLANNING SMC Pro ToolKit is a professional Smart Money Concepts analysis workspace for MetaTrader 5. It combines market structure, multi-timeframe analysis, institutional price zones, setup evaluation, confirmation tools, volume context, alerts, and risk planning inside one organized chart environment. One workspace. Multiple layers of confirmation. One structured trading plan. OPEN COMPLETE USER GUIDE MULTI-CONDITION SETUP ENGINE At
Azimuth Pro
Ottaviano De Cicco
5 (7)
Azimuth Pro V2: Synthetic Fractal Structure and Confirmed Entries for MT5 Overview Azimuth Pro is a multi-level swing structure indicator by Merkava Labs . Four nested swing layers, swing-anchored VWAP, ABC pattern detection, three-timeframe structural filtering, and closed-bar confirmed entries — one chart, one workflow from micro-swings to macro-cycles. This is not a blind signal product. It is a structure-first workflow for traders who care about location, context, and timing. 1. What Change
Apex Patterns PRO 인디케이터 구매 시 - 기반 Expert Advisor 무료 제공. 자체 최적화 차트 패턴 및 브레이크아웃 분석 시스템 기존의 패턴 스캐너는 고정된 파라미터에 의존하므로 시장 변동성과 구조가 변화할 때 성능이 저하되는 경우가 많습니다. Apex Patterns PRO는 구조적 차트 패턴 인식, 모멘텀 필터링, 통계적 자체 최적화를 하나의 분석 프레임워크로 결합하여 변화하는 시장 환경에 적응하도록 설계되었습니다. 적응형 스캐닝 엔진 자체 최적화 패턴 모드 최근 과거 데이터를 바탕으로 적절한 패턴 파라미터를 자동으로 탐색하여, 정적인 설정 대신 현재 시장 행보에 맞춰 인디케이터의 구조 감지 방식을 적응시킵니다. 스마트 브레이크아웃 필터링 클래식 패턴 인식과 모멘텀, 거래량, 프라이스 액션 지표를 결합합니다. 모든 브레이크아웃을 동일하게 다루는 대신, 시장의 기저 구조를 평가하여 현재 통계적 환경에 부합하는 셋업을 식별합니다. 주요 기능 리페인트 없는 고
다음 업데이트 — 버전 2.52 곧 출시! [신규] 시장 분석 및 트레이딩 워크플로를 향상시키기 위해 설계된 4가지 주요 신규 기능을 기대해 주세요. 트레이딩 요구 사항을 충족하도록 설계된 4가지 새로운 기능으로 시장 분석을 한 단계 더 발전시킵니다. 다음 기능을 소개합니다: 1. TRADE OVERVIEW DASHBOARD 2. CONFLUENCE AT ZONE 3. STRONG & WEAK HIGH/LOW 4. OTE 1. TRADE OVERVIEW DASHBOARD 시장 전체 상황을 더 쉽게 파악할 수 있도록 도와주는 대시보드입니다. 트레이딩 의사결정을 지원하는 가이드를 제공하며, 하나의 화면에서 시장을 분석하고 체계적으로 트레이딩을 계획할 수 있도록 도와줍니다. 멀티 타임프레임 시장 개요 (Multi-Timeframe Market Overview) 시장 방향과 가격 구조를 더욱 명확하게 파악 시장 상황을 빠르게 확인 체계적인 시장 분석 및 진입 계획을 위한 가이드 2. CO
Divergence Bomber
Ihor Otkydach
4.89 (94)
이 지표를 구매하신 분께는 다음과 같은 혜택이 무료로 제공됩니다: 각 거래를 자동으로 관리하고, 손절/익절 수준을 설정하며, 전략 규칙에 따라 거래를 종료하는 전용 도우미 툴 "Bomber Utility" 다양한 자산에 맞게 지표를 설정할 수 있는 셋업 파일(Set Files) "최소 위험", "균형 잡힌 위험", "관망 전략" 모드로 설정 가능한 Bomber Utility의 셋업 파일 이 전략을 빠르게 설치, 설정, 시작할 수 있도록 돕는 단계별 영상 매뉴얼 주의: 위의 모든 보너스를 받기 위해서는 MQL5 개인 메시지 시스템을 통해 판매자에게 연락해 주세요. 독창적인 커스텀 지표인 “Divergence Bomber(다이버전스 봄버)”를 소개합니다. 이 지표는 MACD 다이버전스(괴리) 전략을 기반으로 한 올인원(All-in-One) 거래 시스템입니다. 이 기술 지표의 주요 목적은 가격과 MACD 지표 간의 다이버전스를 감지하고, **향후 가격이 어느 방향으로 움직일지를 알려주
Power Candles MT5
Daniel Stein
4.58 (12)
Power Candles V3 - 자체 최적화 강도 지표 파워 캔들 V3는 적용된 모든 차트에서 통화 및 상품의 강세를 실행 가능한 거래 계획으로 전환합니다. 단순히 캔들에 색상을 입히는 대신, 백그라운드에서 실시간 자동 최적화를 수행하여 현재 보고 있는 종목에 대한 최적의 손절매, 익절 및 신호 임계값을 제공합니다. 한 번의 클릭으로 실시간 거래에 적용할 수 있으며, 진입점, 손절매 및 익절 선이 정확한 가격에 맞춰 차트에 표시되고, 방향과 함께 알림이 발령됩니다. 이 도구는 Stein Investments 에코시스템의 일부입니다. 18개 이상의 도구와 함께 당신의 1대1 AI 트레이딩 멘토 Max.  항상 대기 중, 모든 인디케이터를 깊이 있게 이해, 무언가를 차근차근 생각해보고 싶은 순간에 도움을 줍니다.  https://stein.investments 에서 만나보세요 매 종가 바마다 3,000회 이상의 트레이딩 시뮬레이션. 9가지 강도 상태. 2가지 전략을 병렬로 테스트.
Gold Entry Sniper
Tahir Mehmood
5 (23)
Gold Entry Sniper – 골드 스캘핑 & 스윙 트레이딩을 위한 전문 다중 시간 프레임 ATR 대시보드 Gold Entry Sniper 는 XAUUSD 및 기타 종목에 대해 정확한 매수/매도 신호 를 제공하는 고급 MetaTrader 5 지표입니다. ATR 트레일링 스톱 로직 과 다중 시간 프레임 분석 을 기반으로 설계되어 스캘핑과 스윙 트레이딩 모두에 적합합니다. 주요 기능 및 장점 다중 시간 프레임 분석 – M1, M5, M15 추세를 한눈에 확인. ATR 기반 트레일링 스톱 – 변동성에 따라 자동 조정. 전문 차트 대시보드 – 신호 상태, ATR 레벨, 회귀선, 매매 방향 표시. 명확한 매수/매도 마커 – 자동 화살표와 텍스트 라벨. 종료 알림 & 거래 관리 – 수익 보호를 위한 자동 종료 감지. 완전 사용자 설정 가능 – 대시보드 위치, 색상, ATR/회귀선 파라미터 조정. 골드(XAUUSD) 최적화 – M1~M15 스캘핑에 완벽, 외환/지수/암호화폐에도 적용 가능.
Gold Sniper Scalper Pro
Ich Khiem Nguyen
3.9 (10)
Gold Sniper Scalper Pro는 XAUUSD에서 허위 돌파 (false breakout) 패턴을 감지하기 위해 특별히 설계된 MetaTrader 5 지표입니다. 가격이 레인지 경계를 돌파하여 돌파 트레이더를 유인한 후 반전하는 4봉 트랩 구조를 식별합니다. 지표는 각 셋업을 17개 품질 요소로 평가하고, 4계층 합류 파이프라인을 통해 처리하며, 7타임프레임 추세 합의 엔진으로 검증하고, 금 변동성 상태 분류기로 필터링합니다. 이 모든 과정이 신호가 차트에 표시되기 전에 완료됩니다. 자세한 사용자 가이드는 작성자의   MQL5 블로그 에서 확인할 수 있습니다. 추가 업데이트는 작성자의   MQL5 채널 을 통해 제공됩니다. 현재 지원 정책에 따라 구매자는 저자가 개발한 선별된 보조 도구에 대한 추가 접근 권한을 받을 수 있습니다. Forex 쌍, 지수 및 암호화폐에서도 작동하지만, 감지 매개변수, 변동성 처리 및 필터 로직은 XAUUSD 특성에 최적화되어 있습니다.
Naked Forex Tweezer Pro Indicator Tweezer Pro Indicator is a pattern recognition indicator for Forex, Stocks, Indices, Futures, Commodities and Cryptos. The standard Tweezer is a two bar pattern. Our enhanced version is a multi-bar pattern. We filter the patterns for you so that you only get the     best and most effective patterns   and ignore the noise. The Tweezer pattern is a simple and effective pattern to trade. The strategy that comes with the Tweezer is based on price action. The Twe
Adaptive Price Action Engine 지표를 구매하면 EA(자동매매 프로그램)가 무료 멀티 타임프레임 기반 자기 최적화 추세 & 캔들 패턴 분석 시스템 시장은 끊임없이 변화하며, 모든 Price Action 패턴이 모든 시장 환경에서 동일한 가치를 가지는 것은 아닙니다. Adaptive Price Action Engine 은 변화하는 시장 환경에 적응할 수 있도록 설계되었으며, 추세 구조, 멀티 타임프레임 분석, 캔들 패턴 및 통계적 최적화 를 하나의 분석 프레임워크로 결합합니다. 두 가지 적응형 모드 Dual Alpha Trend Mode 낮은 타임프레임과 높은 타임프레임에서 적합한 Alpha Trend 파라미터를 자동으로 탐색하여, 최근 시장 움직임에 맞춰 추세 분석을 조정합니다. Candlestick + Alpha Mode Alpha Trend를 통한 시장 국면 분석과 22개의 상승 및 하락 캔들 패턴 을 결합합니다. 모든 패턴을 동일하게 취급하는 대신, 다양
제작자의 제품 더 보기
Overview MACD Signal with Multi Filters is an advanced technical analysis indicator engineered for MetaTrader 5 (MT5). The software combines the classic Moving Average Convergence Divergence (MACD) oscillator architecture with a modular 14-filter confirmation engine (MultiFilterSuite). It is developed to assist manual traders, quantitative analysts, and algorithmic system developers in identifying momentum shifts, trend continuations, and structural turning points while filtering out sideways ma
Parabolic SAR Multi-Filter System MT5: Algorithmic Trend Reversal Engine 1. PRODUCT OVERVIEW & OPERATIONAL ARCHITECTURE Parabolic SAR Multi-Filter System MT5 is a professional multi-component technical analysis indicator engineered for the MetaTrader 5 terminal. The indicator combines J. Welles Wilder's classic Parabolic Time/Price System with an advanced modular filtering architecture comprising 17 distinct secondary validation engines. The primary objective of this software is to eliminate f
Hull Trend Arrows MT5 with Multi-Filter Suite - Technical Documentation 1. Overview and Analytical Purpose Hull Trend Arrows MT5 with Multi-Filter Suite is an algorithmic technical indicator for MetaTrader 5. It integrates the low-lag calculation engine of the Hull Moving Average (HMA) with fourteen modular confirmation filters to identify directional momentum transitions, calculate inflection points, and display non-repainting entry signals on the chart. Standard moving averages introduce sign
FREE
Product Overview: Relative Vigor Index Multi-Filter Technical System The Relative Vigor Index (RVI) Multi-Filter Indicator is a comprehensive technical analysis engine developed for the MetaTrader 5 terminal. Designed to identify cyclical momentum shifts, trend continuations, and structural market turning points, this analytical system couples the classic Relative Vigor Index formula with an advanced multi-layered confirmation matrix consisting of 17 distinct technical filters. Rather than rely
FREE
HA Signal MultiFilter MT5 - Technical Operational Manual & Architecture Guide 1. SYSTEM OVERVIEW & ARCHITECTURAL FOUNDATION HA Signal MultiFilter MT5 is a specialized analytical indicator developed for MetaTrader 5 terminal to identify directional momentum expansions and structural trend continuations[cite: 2]. By synthesizing smoothed Heiken Ashi candlestick price discovery with a modular 15-layer secondary confirmation filter suite, the system extracts high-probability market shifts while fil
FREE
1. OVERVIEW Harmonic Dashboard is a specialized multi-symbol and multi-timeframe analytical indicator designed for MetaTrader 5 (MT5). The software systematically scans financial instruments across multiple timeframes to identify six classical harmonic chart patterns: Gartley, Bat, Butterfly, Crab, Cypher, and Shark. The application consolidates multi-asset scanner results, trend filter validation metrics, price level projections, and interactive chart navigation controls into a single graphic
Overview The MA Cross Scanner Pro is an advanced, highly optimized multi-symbol and multi-timeframe analytical dashboard engineered specifically for the MetaTrader 5 terminal. Designed for technical analysts, systemic traders, and quantitative researchers, this utility serves as a comprehensive market surveillance engine. Its primary objective is to continuously monitor a customized array of financial instruments across numerous timeframes simultaneously, detecting precise moving average crosso
CCI MultiFilter Overbought Oversold Signal Pro MT5 Technical Specification & Operational Manual  1. Overview and System Identity CCI MultiFilter Overbought Oversold Signal Pro MT5 is an institutional-grade technical analysis indicator engineered natively for MetaTrader 5. Developed for quantitative analysts, systematic manual traders, and multi-asset operators, the system provides an objective algorithmic framework to identify cyclical market extremes, momentum shifts, and structural trend cont
WPR Williams Percent Range All Pair Timeframe Scanner Dashboard Overview WPR Scanner Dashboard Pro is a multi-symbol, multi-timeframe market scanning indicator and visual chart overlay utility built for MetaTrader 4 (MT4). The tool monitors Williams Percent Range (WPR) momentum exhaustion and threshold breakouts across multiple currency pairs, metals, indices, and CFDs simultaneously from a single chart window. In addition to its core WPR detection engine, the indicator incorporates an optiona
WAE Waddah Attar Explosion Multi Pair TimeFrame Scanner 1. Overview - WAE Scanner Dashboard is a technical analysis indicator and multi-symbol, multi-timeframe market scanner built for MetaTrader 4 (MT4). - It automates multi-chart monitoring by scanning volatility-driven momentum breakouts based on the Waddah Attar Explosion (WAE) methodology across multiple currency pairs, crosses, indices, or metals simultaneously. - Candidate signals are processed through a modular 15-filter technical conf
UT Bot Trend Multi Pair Timeframe Scan Dashboard Overview UT Bot Scanner Dashboard is a multi-pair and multi-timeframe technical indicator and market scanner developed natively for MetaTrader 4 (MT4). It continuously monitors selected Forex pairs, precious metals, indices, or active Market Watch symbols across multiple timeframes simultaneously to detect dynamic Average True Range (ATR) volatility trailing stop crossovers. Instead of manually cycling through dozens of individual charts to monit
Stochastic Scanner Dashboard for MetaTrader 4 Stochastic Overbought Oversold Scanner Dashboard All Pair Time frame Overview - Stochastic Scanner Dashboard is a multi-symbol and multi-timeframe technical analysis indicator and market scanner built for MetaTrader 4 (MT4). - The tool continuously monitors user-defined currency pairs, metals, or Market Watch symbols across multiple timeframes from one chart. - It detects momentum shifts using configurable Stochastic Oscillator strategies and valida
SSL Channel Trend Scanner Dashboard Multi Pair Multi TimeFrame Overview SSL Channel Multi-Filter Dashboard is a technical analysis indicator and multi-symbol, multi-timeframe market scanner built for MetaTrader 4. It continuously monitors multiple currency pairs, commodities, or other broker instruments across user-selected timeframes to detect directional channel crossovers confirmed by an optional 15-module technical filter suite. Validated signals are organized in an interactive on-chart dash
Relative Vigor Index RVI All Pair and Timeframe Scanner Dashboard Overview RVI Scanner Dashboard is a multi-pair and multi-timeframe technical indicator and interactive scanner panel for MetaTrader 4 (MT4). Built around the Relative Vigor Index (RVI) oscillator, it continuously monitors multiple currency pairs, commodities, or indices across selected timeframes from one chart window. The tool detects directional momentum crossovers, validates setups through an optional 15-module technical conf
RSI Parabolic Overbought Oversold Multi pair Timeframe Scanner 1. Overview - RSI Parabolic Scanner Dashboard is a multi-symbol, multi-timeframe technical analysis indicator and real-time market scanner engineered for MetaTrader 4 (MT4). - It continuously monitors user-defined currency pairs, metals, or visible Market Watch instruments across multiple chart timeframes to identify momentum reversals and overbought or oversold market conditions. - The indicator combines two selectable RSI-based si
RSI Divergence Multi Pair Timeframe Scan Dashboard Overview - Product Type: Multi-symbol, multi-timeframe technical analysis indicator and interactive market dashboard scanner for MetaTrader 4 (MT4). - Core Purpose: Continuously monitors configured currency pairs, precious metals, indices, or active Market Watch symbols across multiple chart timeframes simultaneously to identify Regular and Hidden Relative Strength Index (RSI) divergence setups in one unified terminal window. - Structured Trade
Overview - Product Identity: Pola MultiCandle Scanner Dashboard is a multi-pair and multi-timeframe technical analysis indicator and market scanner developed for MetaTrader 4 (MT4). - Core Purpose: Continuously monitors user-defined currency pairs, precious metals, or Market Watch instruments across multiple timeframes to detect structured multi-candle price action formations, validate setups through a modular 15-indicator confluence suite, calculate volatility-adjusted Stop Loss (SL) and dual
MACD Signal Trend Cross Scanner All Pair Dashboard Overview MACD Scanner Dashboard is a technical analysis utility and multi-symbol, multi-timeframe dashboard indicator designed for MetaTrader 4[cite: 1]. Its primary objective is to monitor MACD crossover events across multiple currency pairs and chart timeframes simultaneously from a single active chart window[cite: 1]. Instead of manually switching between dozens of charts, traders can observe real-time market momentum, directional bias, calc
MA Moving Average Cross Scanner All Pair Timeframe Dashboard Overview MA Cross Scanner is an analytical multi-symbol and multi-timeframe technical indicator equipped with an interactive on-chart dashboard panel for MetaTrader 4[cite: 1]. The tool is engineered to monitor Moving Average (MA) crossover events across multiple currency pairs and timeframes simultaneously, consolidating signal detection, modular trend/momentum filtering, and Average True Range (ATR) risk-reward level calculations in
Ichimoku Tenkan Kijun Cross Scanner All Pair TimeFrame Overview TK Cross Scanner Dashboard is a technical analysis indicator and multi-asset market scanner engineered for the MetaTrader 4 platform. The utility monitors multiple currency pairs, commodities, and timeframes simultaneously to detect Ichimoku Tenkan-sen and Kijun-sen crossovers (TK Cross). In addition to automated signal scanning, the software calculates dynamic Stop Loss (SL) and dual Take Profit (TP1 and TP2) reference levels usin
Ichimoku Senkou Span B Scanner All Pair Timeframe Overview Senkou Span B Scanner Dashboard MT4 is a technical analysis indicator and multi-asset market scanner designed for MetaTrader 4. The tool monitors multiple currency pairs, commodities, and timeframes simultaneously from a single chart window to detect price interactions with the Ichimoku Kinko Hyo Senkou Span B boundary. In addition to scanning for signal candidates, the indicator integrates a 15-module secondary confirmation suite, calc
Heiken Ashi Multi Currency Pair Time Frame Scan Dashboard Overview Heiken Ashi Multi Timeframe Scanner Dashboard is a technical analysis utility and multi-symbol, multi-timeframe market scanner developed for the MetaTrader 4 platform. The tool is designed to monitor multiple currency pairs, commodities, or indices simultaneously from a single chart window. Instead of manually switching between dozens of charts and timeframes to inspect Heiken Ashi candle formations, traders can view active dire
Pro Harmonic Pattern Scanner All Pair Time Frame Dashboard Harmonic Pattern Scanner Dashboard MT4 is an analytical multi-symbol and multi-timeframe technical indicator designed for MetaTrader 4. It automatically scans price action across selected currency pairs, metals, or Market Watch instruments to identify classic XABCD harmonic structures, calculate Fibonacci-based entry, Stop Loss, and Take Profit zones, and validate setups through an integrated modular trend and momentum filter suite. Op
Fractal Breakout Scanner Multi Pair Timeframe Dashboard Overview Fractal Breakout Scanner Dashboard is a technical analysis indicator and multi-symbol, multi-timeframe scanning utility designed for MetaTrader 4. The tool monitors multiple currency pairs, commodities, and indices simultaneously to detect price breakouts beyond confirmed Bill Williams Fractal swing highs and swing lows. Rather than requiring manual chart switching across dozens of instruments, the indicator aggregates real-time b
Institutional Candle Price Engulfing Scan All Pair Timeframe Engulfing Scanner Dashboard is a technical analysis utility and multi-symbol, multi-timeframe candlestick pattern scanner for MetaTrader 4. It detects Bullish Engulfing and Bearish Engulfing setups across multiple currency pairs and timeframes simultaneously, displaying active signals in an interactive on-chart table alongside ATR-based Stop Loss and Take Profit reference levels. 1. Overview and Technical Purpose - Product Category:
Pinbar Marubozu Rejection Candlestick Scanner All Pair Timeframe Overview Candle Pattern Scanner Dashboard is a technical analysis utility and multi-pair, multi-timeframe scanner indicator designed for MetaTrader 4. The indicator continuously monitors multiple currency pairs, commodities, or indices across selected timeframes to detect specific Japanese candlestick price action formations—namely Candle Rejection, Full-Body Marubozu, and Classic Pin Bar structures. When a valid candlestick forma
Chaikin Oscillator Scanner All Pair Timeframe Dashboard Overview Chaikin Oscillator Scanner Dashboard is a technical analysis utility and multi-symbol, multi-timeframe market scanner designed for MetaTrader 4 (MT4)[cite: 1]. The indicator monitors multiple currency pairs, commodities, or indices simultaneously across selected chart timeframes to identify Chaikin Oscillator zero-line crossover events[cite: 1]. Detected setups are presented in an interactive on-chart table complete with automated
CCI Signal Trend Overbought Oversold Scanner All Pair TimeFrame Dashboard CCI Multi Timeframe Scanner Dashboard is a technical analysis utility and multi-symbol market scanner developed for MetaTrader 4. The indicator monitors multiple currency pairs and timeframes simultaneously using Commodity Channel Index (CCI) calculations combined with an optional multi-indicator confirmation suite and Average True Range (ATR) volatility projections. 1. Operating Principle and Signal Validity - Core Cal
BB Bollinger Bands Breakout Scanner All Pair Time Frame Bollinger Bands Breakout Scanner Dashboard is a technical analysis utility and multi-symbol, multi-timeframe market scanner engineered for MetaTrader 4 (MT4). The software continuously monitors multiple currency pairs, commodities, or indices across user-defined timeframes to detect confirmed Bollinger Bands breakout setups. Every detected signal is evaluated through an optional modular confirmation suite and automatically paired with vola
ADX Multi Pair Timeframe Trend Scanner Dashboard Overview: ADX Scanner Dashboard Pro is a multi-symbol and multi-timeframe technical analysis indicator and market scanner designed for the MetaTrader 4 platform. The software continuously monitors Average Directional Index (ADX) directional movement across user-selected financial instruments and chart periods simultaneously. All detected trade setups, dynamic Average True Range (ATR) risk management levels, directional strength readings, and mult
필터:
리뷰 없음
리뷰 답변