Provlepsis Simple

Provlepsis 지표에 오신 것을 환영합니다.

"Provlepsis"는 MQL 마켓을 위해 개발된 고급 지표입니다. 같은 시간대의 이전 바를 분석하여 시장 움직임의 잠재적 범위를 정확하게 계산하여 향후 가격 변동에 대한 소중한 통찰력을 제공합니다. 전통적인 ATR 지표와 달리 "Provlepsis"는 시간 요소를 고려하여 다양한 시장 조건에 적응하는 더 강력한 도구입니다. 밤에는 좁은 범위를 예측하고 활발한 거래 시간대에는 더 넓은 범위를 예측합니다.

"Provlepsis"가 제공하는 포괄적인 범위 분석으로 거래 전략에서 경쟁 우위를 확보하세요.

여기에서 Provlepsis 지표의 길이와 시프트를 변경할 수 있는 전체 버전을 확인할 수 있습니다!
https://www.mql5.com/ko/market/product/98802
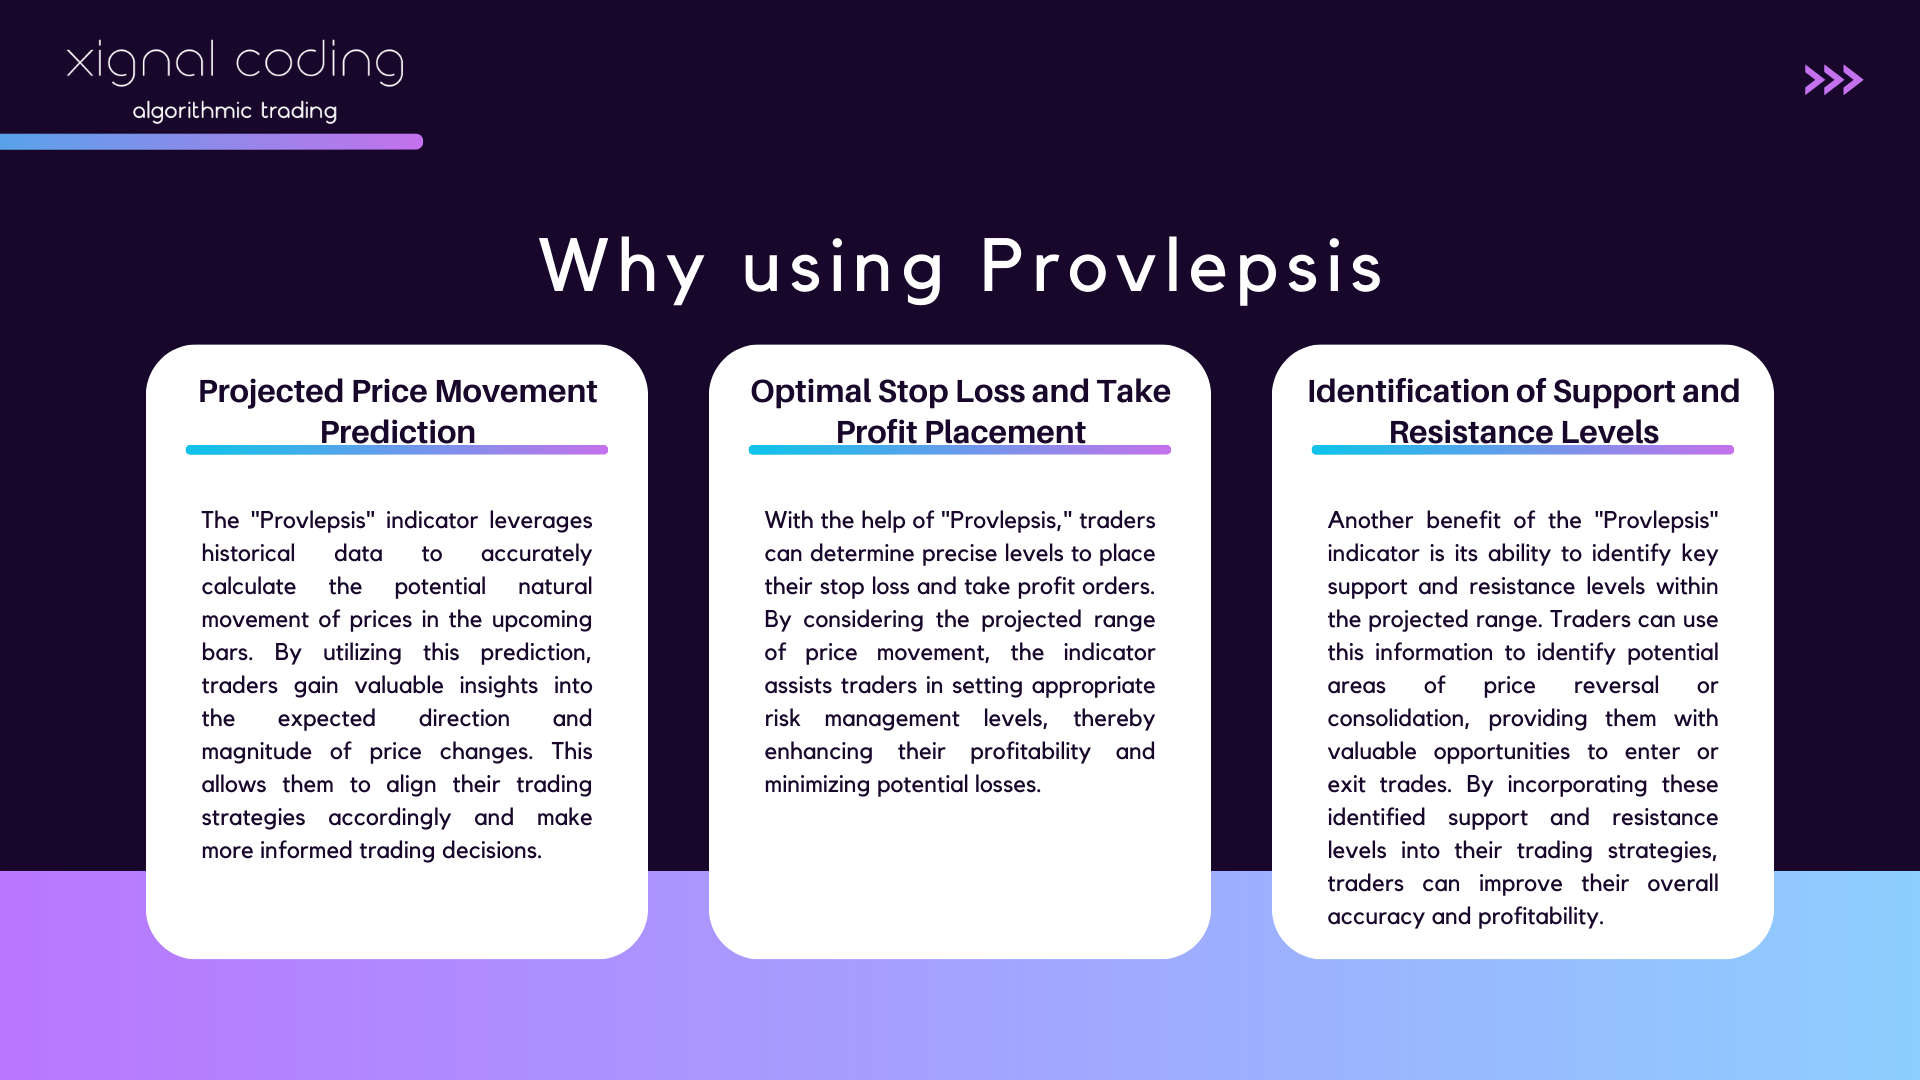

프로블렙시스 사용의 이유

  • 범위 기반 트레이딩: 이 지표는 시장 움직임의 잠재적 범위를 식별하는 능력으로 범위 기반 트레이딩 전략에 가치를 제공할 수 있습니다. 트레이더는 이 지표를 사용하여 예상 범위 내에서 주요 지지선과 저항선을 식별하고 그에 맞게 거래를 실행할 수 있습니다.
  • 변동성 분석: "프로블렙시스"는 시간 요소를 고려함으로써 시장의 변동성에 대한 통찰력을 제공할 수 있습니다. 트레이더는 이 지표를 사용하여 저변동 또는 고변동 기간을 파악하고 그에 따라 리스크 관리와 포지션 크기를 조정할 수 있습니다.
  • 시간에 민감한 전략: 이 지표는 특정 시간대에 집중함으로써 트레이더가 다양한 시장 세션에 맞춤화된 전략을 개발할 수 있게 합니다. 예를 들어, 트레이더는 이 지표가 좁은 범위를 나타내는 밤에는 거래 접근 방식을 조정하고, 넓은 범위가 예상되는 활발한 거래 시간에는 보다 공격적인 접근 방식을 채택할 수 있습니다.
  • 추세 확인: "프로블렙시스"는 추세 확인을 위한 보조 도구로 활용될 수 있습니다. 트레이더는 이 지표의 예측 범위와 추세의 방향을 비교하여 추세의 강도를 확인하고 보다 명확한 거래 결정을 내릴 수 있습니다.
  • 손실 제한 설정: 이 지표의 범위 추정은 적절한 손실 제한 수준을 결정하는 데 도움을 줄 수 있습니다. 트레이더는 예측 범위 외부에 손실 제한 주문을 설정하여 잠재적인 시장 변동을 수용하면서도 리스크 관리를 유지할 수 있습니다.


사용자 가이드

https://www.mql5.com/en/blogs/post/752850


추천 제품
Nyse Usdxy
Mitchell Dean Ede
5 (1)
Displays a USD DXY chart in a seperate window below the main chart. YOUR BROKER MUST HAVE THESE SYMBOLS FOR THE INDICATOR TO WORK Based on EUR/USD, USD/JPY, GBP/USD, USD/CAD, USD/CHF and USD/SEK All these pairs must be added to Market Watch for the indicator to work correctly As this is calculated using a formula based on the 6 pairs it will only work when the market is open. YOUR BROKER MUST HAVE THESE SYMBOLS FOR THE INDICATOR TO WORK Displays a USD DXY chart in a seperate window below the m
FREE
Multi TF Trend Dashboard
Watcharapon Sangkaew
Multi-TF Trend Dashboard Short Description / Slogan: See the entire market trend in a single glance! A simple, clean, and powerful dashboard for every trader. Full Description: (1. For Free Distribution) Hello MQL5 Community, I am excited to share the Multi-TF Trend Dashboard , a tool I developed to simplify trend analysis. This indicator is offered completely free as a contribution to this amazing community. (2. Indicator's Functionality) Are you tired of constantly switching between timeframe
FREE
This indicator uses a different approach from the previous version to get it's trendlines. This method is derived from Orchard Forex, and the process of making the indicator is demonstrated in there video   https://www.youtube.com/watch?v=mEaiurw56wY&t=1425s . The basic idea behind this indicator is it draws a   tangent line   on the highest levels and lowest levels of the bars used for calculation, while ensuring that the lines don't intersect with the bars in review (alittle confusing? I know
FREE
TilsonT3
Jonathan Pereira
5 (1)
Tillson's T3 moving average was introduced to the world of technical analysis in the article ''A Better Moving Average'', published in the American magazine Technical Analysis of Stock Commodities. Developed by Tim Tillson, analysts and traders of futures markets soon became fascinated with this technique that smoothes the price series while decreasing the lag (lag) typical of trend-following systems.
FREE
SMC Structure Markup
Seyed Mohammad Hosseini Hejazi
4.67 (15)
Overview The Smart Money Structure Markup Indicator for MetaTrader 5 is a powerful tool designed to help traders identify key market structures based on popular Smart Money Concepts (SMC) strategies. This indicator detects micro-market structures, providing insights into price movements and potential trend changes. It highlights important elements such as valid Break of Structure (BOS), Change of Character (CHoCH), and Inducement (IDM), helping traders to make informed decisions. Key Features Ma
FREE
Color Trend
Bruno Goncalves Mascarenhas
Combining the best of Price Action , Directional Movement , and Divergence / Convergence analysis, the Candle Color Trend is the easy and reliable way to identify the direction of the trend. The indicator automatically paints the candles according to the premise that the upward trend is defined by prices that form a series of ascending tops and bottoms. On the other hand, the downward trend is defined by prices that form a series of descending tops and bottoms. Color Trend is certainly one of
FREE
Time Dashboard
Pankaj Kushwaha
Time Dashboard MT5 is a powerful and user-friendly MetaTrader 5 indicator designed to provide real-time time zone and clock information directly on your trading chart. Ideal for forex traders and global market participants, this tool displays server time, local time, and the time difference between them, enhancing your ability to manage trades across different time zones. Key Features : Real-Time Time Display : Shows current server time, local time, and their respective time zones with precise o
FREE
Previous Day Close
Vincent Kipleting Burugo
The indicator is a line right at yesterday's closing price. With the indicator, there is no need for adding or deleting previous day close lines each new day. T he line gives you an instant visual reference point for support, resistance, and market sentiment.   Whether you are day trading or swing trading, this line helps you quickly gauge where the market closed last session and how current price action relates to that level. It works seamlessly across all timeframes - from 1-minute charts to d
FREE
Tabajara Ogro
JETINVEST
4.75 (12)
Setup Tabajara was created by a Brazilian trader known as  "The OGRO of Wall Street" . The idea of this setup is to indicate to the trader the current trend of prices and  the type of operation should be looked for in the graph. Operation It does this through the relation of the closing price position and the     of 20 periods, by painting the candles in 4 possible colors : Green -> Price rising in upward trend (Search entry points for PURCHASE) Black -> Price correcting in Bullish Trend (Sear
FREE
Candle Close Timer MT5
Abderrahmane Benali
Candle Close Timer – MT5 Utility indicator for MetaTrader 5 that displays the remaining time until the current candle closes directly on the chart. Real-time countdown Appears above the active candle Adjustable color and font size Works on all symbols and timeframes Provides clear candle timing information to support chart analysis and execution planning.
FREE
Hi Traders, The Volume Spike Alert Indicator is a lightweight, non-lagging tool designed to help traders identify unusual volume activity in real time. This indicator calculates the average tick volume over a user-defined number of previous bars and compares it with the current candle’s volume. When the current volume exceeds the average by a specified percentage, the indicator triggers alerts, allowing traders to quickly spot potential breakouts, institutional activity, or strong market interes
FREE
Koala Trend Line
Ashkan Hazegh Nikrou
4.33 (6)
Koala Trend Line Upgraded To Version 1.2 Last Upgrade Improvement : New Parameter Added that allow user to connect trend line to 2nd or 3th or Xth highest or lowest point. My Request : **Dear Customers Please Release Your Review On Koala Trend Line, And Let Me Improve By Your Feed Backs. Join Koala Trading Solution Channel in mql5 community to find out the latest news about all koala products, join link is below : https://www.mql5.com/en/channels/koalatradingsolution WHAT ABOUT OTHER FREE
FREE
CoioteCandlePVA
Alexandre Moraes De Souza Lima
5 (1)
Candle com coloração de Volume Price Analysis  (VPA) segundo as definições da Anna Coulling, é possível configurar períodos de  climax e rising, fator de extreme e fator de rising. Pode-se usar volume real ou volume de ticks. O VPA considera a variação de preço por volume do período, indicando se um movimento está recebendo ignição, está em seu climax ou se já não existe mais interesse.
FREE
Visual Order Book
Ricardo De Andrade Nakano
1 (1)
이 지표로 강력한 시장 통찰력을 얻으세요. Nelogica의 Profit의 Visual Book에서 영감을 받아 차트에 시각적 주문장(order book)을 표시합니다. 매수량(파란색)과 매도량(빨간색)을 수평 막대로 보여주며, 큰 거래량은 노란색으로 강조 표시되어 고유동성 구간을 쉽게 식별할 수 있습니다. 가격은 주문이 가장 많이 집중된 영역으로 이동하는 경향이 있어 지지 및 저항 구간을 파악하는 데 필수적인 도구입니다. 완전히 사용자 맞춤 설정이 가능해 모든 트레이딩 스타일에 적합하며, 실시간 업데이트로 시장의 동적 변화를 따라갈 수 있습니다. MetaTrader 5에서 외환, 주식 및 기타 금융 시장 분석에 이상적입니다. 이 지표는 직관적이고 사용이 간편해 시장의 돌파나 반전 기회를 포착하는 데 큰 도움이 됩니다. 브로커가 시장 깊이(주문장) 데이터를 제공해야 합니다. 지금 다운로드하여 명확하고 실용적인 분석으로 트레이딩을 강화하세요!
FREE
Candle Amplitude Oscillator
Daniel Naranjo Morales
캔들 진폭 오실레이터 (Candle Amplitude Oscillator) Candle Amplitude Oscillator를 통해 시장 변동성에 대한 명확한 관점을 얻으세요. 이 가볍고 효율적인 도구는 단순한 가격 분석을 넘어 각 캔들 안에 담긴 진정한 에너지를 보여주어, 더 나은 정보에 기반한 트레이딩 결정을 내릴 수 있도록 돕습니다. 시장이 활발한지 혹은 조용한지 추측하는 대신, 이 지표는 모든 종목과 모든 타임프레임에서 작동하는 정확하고 표준화된 변동성 측정값을 제공합니다. 캔들 진폭이란 무엇인가요? 캔들 진폭은 캔들 하나가 고점에서 저점까지 움직인 총 거리를 측정합니다. 그 후 지표는 이 범위를 보편적인 백분율 값으로 변환합니다. 이는 EUR/CHF와 같이 변동성이 적은 외환 페어부터 비트코인과 같은 변동성이 큰 암호화폐에 이르기까지, 완전히 다른 금융 상품들의 변동성을 표준화된 방식으로 비교할 수 있게 해주는 핵심적인 장점입니다. 2%의 진폭 바는 어디에서나 동일한 의미
FREE
BinaWin NoTouch
Juan Fernando Urrego Alvarez
BinaWin NoTouch is an indicator that sends an alert signal when the trade is in the right position to wait for the breakdown of a side market. It is specially designed to trade under the “No Touch” strategy of the Binary.Com platform with synthetic indexes N.10, N.25, N.50, N.75 and N.100 Similarly, trading can be done with the conventional CALL and PUT strategy of any Binary Options platform. Requirements to use the indicator: 1. Have an account at Binary.Com 2. Configure the Binary.Com d
FREE
Entry Pointz Pro
Thabang John Wotsa
This custom MT5 indicator automatically draws trading levels based on the previous H4 candlestick. It is designed to help traders quickly identify potential entry and take profit (TP) points according to a simple breakout strategy. What it does:- Draws Buy Entry line at the previous H4 High.- Draws Sell Entry line at the previous H4 Low.- Calculates the 50% range of the previous H4 candle and plots: • Buy TP line above the High. • Sell TP line below the Low.- Adds text labels directly on the cha
============== -- If you are a fan of FIBONACCI... then this is defenitely a tool for you -- Please master the optimal trade entry concept and you will become profitable -- Show me you comment about this tool and I will give you more tools: Tradelist Panel, Watermark, Reversal tool, ... ============== Hallo Trader, This is fibonacci system based on the previous day levels (low and high) and the current day levels. You can choose your favorite in settings. I use the Previous Day Fibo and use the
FREE
Dynamic SR and Trendline Indicator
Adebowale Adeniyi Adeleke
5 (1)
The MTF Support/Resistance & Trendline Analyzer is a powerful multi-timeframe indicator that automatically detects key support and resistance levels , draws dynamic trendlines , and provides a real-time market structure dashboard — all in one clean, lightweight display. It combines fractal logic and price action detection across three timeframes to give you a unified view of market direction and structure. Whether you trade reversals, breakouts, or trends, this tool highlights the zones that mat
FREE
Quarter EMA
Jithin Sajan Sajan
5 (2)
Kindly rate and comment about the product for upgradation & Support The 5 EMA is plotted in green color ( Lime ). The 14 EMA is plotted in red color ( Red ). The 20 EMA is plotted in blue color ( Blue ). The 200 EMA is plotted in yellow color ( Yellow ). The Quarter EMA that provided calculates and plots four Exponential Moving Averages (EMAs) on the chart using different periods: 5, 14, 20, and 200. Each EMA is represented by a different color on the chart. Here's a description of each EMA:
FREE
Quintet EMA
Jithin Sajan Sajan
Kindly rate and comment about the product for upgradation & Support The   5 EMA   is plotted in   green   color ( Lime ). The  14 EMA  is plotted in  red  color ( Red ). The   20 EMA   is plotted in   blue   color ( Blue ). The  200 EMA  is plotted in  black  color ( Black ). The   200 EMA   is plotted in   yellow   color ( Yellow ). The Quarter EMA that provided calculates and plots four Exponential Moving Averages (EMAs) on the chart using different periods: 5, 14, 20, and 200. Each EMA is
FREE
A useful dashboard that shows the RSI values for multiple symbols and Time-frames. It can be easily hidden/displayed with a simple click on the X top left of the dashboard. You can input upper and lower RSI values and the colours can be set to show when above/below these values. The default values are 70 and 30. You can choose whether the dashboard is displayed on the right or left of the chart. If you want to have 2 dashboards on the same chart you must input a different name for each. The sca
FREE
Price Predictor Pro
Emma-ekong Ben Eshiet
Price Predictor Pro Turn Market Patterns into Predictable Profits! Are you tired of guessing where the market will go next? With Price Predictor Pro , you’ll trade with confidence by spotting powerful chart patterns and receiving precise price projections —directly on your MT5 chart. What Price Predictor Pro Does: ️ Detects high-probability chart patterns like Double Tops, Double Bottoms, Head & Shoulders, Flags, Pennants, and more . ️ Instantly projects the next price target using adv
FREE
VolumesWithMedia
Jonathan Pereira
5 (1)
Volume is a widely used indicator in technical analysis, however there is a variation that is even more useful than Volume alone: the Moving Average of Volume. It is nothing more than a moving average applied to the popular Volume indicator. As the name says, Volume + MA serves to display the transacted volume (purchases and sales executed) of a certain financial asset at a given point of time together with the moving average of that same volume over time. What is it for? With the Volume + M
FREE
MT Monster
MASSINISSA AINOUZ
This EA has been backtested with real ticks since January 2012 untill March 2025, with no delay in execution, and then with a delay of 1000ms, the backtest showed a drawdown of 30% with a 10k USD backtest account. The EA default parameters are optimised to work best on EURUSD pair, but can work on other currencies and metals like XAUUSD. Before using this EA and in order to not lose all your money make sure you have at least 5000USD in your account. Do not use another EA with this one on the sam
VFI Quantum
Nikita Berdnikov
5 (1)
Introducing VFI (Volume Flow Indicator) – a trading indicator that analyzes the relationship between volume and price movement to identify key trading opportunities. The indicator displays the strength and direction of volume flow, providing clear signals about potential entry and exit points. Signals are formed based on zero line crossovers, crossovers between the VFI line and its exponential moving average (EMA), and when the indicator exits overbought and oversold zones. Attention! This stra
FREE
이 지표는 실제 거래에 완벽한 자동 파동 분석 지표입니다! 사례... 참고:   웨이브 그레이딩에 서양식 이름을 사용하는 데 익숙하지 않습니다. Tang Lun(Tang Zhong Shuo Zen)의 명명 규칙의 영향으로 기본 웨이브를   펜   으로 명명하고 2차 웨이브 밴드를   세그먼트   로 명명했습니다. 동시에, 세그먼트에는 추세 방향이 있습니다.   주요 추세 세그먼트에는   이름이 지정되지만(이 이름 지정 방법은 향후 노트에서 사용됩니다. 먼저 말씀드리겠습니다.) 알고리즘은 굴곡 이론과 거의 관련이 없으므로 그렇게 해서는 안 됩니다. 이는 나의 시장 분석을   통해 요약된 끊임없이 변화하고 복잡한 운영 규칙을   반영합니다. 밴드는 더 이상 사람마다 다르지 않도록 표준화되고 정의되었습니다. 인위적인 간섭의 드로잉 방법은 시장 진입을 엄격하게 분석하는 데 핵심적인 역할을 합니다. 이 지표를 사용하는 것은 거래 인터페이스의 미학을 개선하고 원래의 K-line 거래를
Time Levels for MT5
Yurij Izyumov
1 (1)
The indicator is designed for displaying the following price levels on the chart: Previous day's high and low. Previous week's high and low. Previous month's high and low. Each of the level types is customizable. In the indicator settings, you set line style, line color, enable or disable separate levels. Configurations ----Day------------------------------------------------- DayLevels   - enable/disable previous day's levels. WidthDayLines   - line width of daily levels. ColorDayLines   - line
FREE
Product Description PropFirm Risk Manager EA is a dedicated risk-control Expert Advisor designed for prop firm traders (FTMO, MyFunded, E8, and similar). This EA does NOT open trading strategies . Its only job is to protect your account by monitoring equity in real time and enforcing risk rules automatically. It helps you: Prevent daily and maximum drawdown violations Stop trading after reaching daily profit targets Control trading time windows Avoid accidental rule breaks due to emotions or ov
FREE
Follow The Line MT5
Oliver Gideon Amofa Appiah
4.6 (35)
This indicator obeys the popular maxim that: "THE TREND IS YOUR FRIEND" It paints a GREEN line for BUY and also paints a RED line for SELL. (you can change the colors). It gives alarms and alerts of all kinds. IT DOES NOT REPAINT and can be used for all currency pairs and timeframes. Yes, as easy and simple as that. Even a newbie can use it to make great and reliable trades. NB: For best results, get my other premium indicators for more powerful and reliable signals. Get them here: https://www.m
FREE
이 제품의 구매자들이 또한 구매함
이 지표를 구매하면 제 프로페셔널 트레이드 매니저를 무료로 드립니다. 우선 이 거래 시스템이 리페인팅, 리드로잉 및 레이그 인디케이터가 아니라는 점을 강조하는 것이 중요합니다. 이는 수동 및 로봇 거래 모두에 이상적인 것으로 만듭니다. 온라인 강좌, 설명서 및 프리셋 다운로드. "스마트 트렌드 트레이딩 시스템 MT5"은 새로운 및 경험이 풍부한 트레이더를 위해 맞춤형으로 제작된 종합적인 거래 솔루션입니다. 10개 이상의 프리미엄 인디케이터를 결합하고 7개 이상의 견고한 거래 전략을 특징으로 하여 다양한 시장 조건에 대한 다목적 선택이 가능합니다. 트렌드 추종 전략: 효과적인 트렌드 추이를 타기 위한 정확한 진입 및 손절 관리를 제공합니다. 반전 전략: 잠재적인 트렌드 반전을 식별하여 트레이더가 범위 시장을 활용할 수 있게 합니다. 스캘핑 전략: 빠르고 정확한 데이 트레이딩 및 단기 거래를 위해 설계되었습니다. 안정성: 모든 인디케이터가 리페인팅, 리드로잉 및 레이그가 아니므로 신뢰
SuperScalp Pro
Van Minh Nguyen
5 (6)
SuperScalp Pro – 고급 다중 필터 스캘핑 인디케이터 시스템 SuperScalp Pro는 클래식 Supertrend와 여러 지능형 확인 필터를 결합한 고급 스캘핑 인디케이터 시스템입니다. 해당 인디케이터는 M1부터 H4까지 모든 타임프레임에서 효율적으로 작동하며, 특히 XAUUSD, BTCUSD 및 주요 외환 통화쌍에 적합합니다. 독립형 시스템으로 사용하거나 기존 거래 전략에 유연하게 통합할 수 있습니다. 이 인디케이터는 11개 이상의 필터를 통합하며, 빠른/느린 EMA, 추세 판별용 3개의 EMA, EMA 기울기(EMA slope), RSI, ADX, 거래량(Volume), VWAP, 볼린저 밴드 돌파(Bollinger Bands Breakout) 및 MACD 다이버전스 필터 등을 포함합니다. 스마트 캔들 필터는 캔들 종가를 확인하여 약한 신호를 제거하고, 3 EMA와 MACD 다이버전스 필터를 결합한 추세 인식 메커니즘은 더 높은 승률의 신호를 선별하는 데 도움을 줍니
ARIPoint
Temirlan Kdyrkhan
ARIPoint is a powerful trading companion designed to generate high-probability entry signals with dynamic TP/SL/DP levels based on volatility. Built-in performance tracking shows win/loss stats, PP1/PP2 hits, and success rates all updated live. Key Features: Buy/Sell signals with adaptive volatility bands Real-time TP/SL/DP levels based on ATR Built-in MA Filter with optional ATR/StdDev volatility Performance stats panel (Success, Profit/Loss, PP1/PP2) Alerts via popup, sound, push, or email Cu
FX Trend MT5 NG
Daniel Stein
5 (3)
FX Trend NG: 차세대 멀티 마켓 트렌드 인텔리전스 개요 FX Trend NG 는 다중 시간 프레임 기반의 전문 트렌드 분석 및 시장 모니터링 도구입니다. 몇 초 만에 전체 시장 구조를 파악할 수 있도록 설계되었습니다. 여러 차트를 일일이 전환할 필요 없이, 어떤 종목이 추세에 있는지, 어디에서 모멘텀이 약화되고 있는지, 그리고 어떤 시간 프레임이 서로 정렬되어 있는지 즉시 확인할 수 있습니다. 출시 기념 특별 혜택 – FX Trend NG 를 $30 (6개월) 또는 $80 평생 라이선스 로 이용할 수 있습니다. 이미 Stein Investments 고객이신가요? -> 메시지를 보내 전용 고객 그룹에 참여하세요. 설정이나 사용 방법이 필요하신가요? -> Stein Investments 공식 페이지 를 방문하세요. 1. FX Trend NG가 특별한 이유 3단계 추세 로직 – 단순한 Buy / Sell이 아닙니다 • 대부분의 지표는 Buy 또는 Sell 두 가지 상태만 제
Entry In The Zone and SMC Multi Timeframe is a real-time market analysis tool developed based on Smart Money Concepts (SMC). It is designed to analyze market structure, price direction, reversal points, and key zones across multiple timeframes in a systematic way. The system displays Points of Interest (POI) and real-time No Repaint signals, with instant alerts when price reaches key zones or when signals occur within those zones. It functions as both an Indicator and a Signal System (2-in-1), c
Divergence Bomber
Ihor Otkydach
4.89 (82)
이 지표를 구매하신 분께는 다음과 같은 혜택이 무료로 제공됩니다: 각 거래를 자동으로 관리하고, 손절/익절 수준을 설정하며, 전략 규칙에 따라 거래를 종료하는 전용 도우미 툴 "Bomber Utility" 다양한 자산에 맞게 지표를 설정할 수 있는 셋업 파일(Set Files) "최소 위험", "균형 잡힌 위험", "관망 전략" 모드로 설정 가능한 Bomber Utility의 셋업 파일 이 전략을 빠르게 설치, 설정, 시작할 수 있도록 돕는 단계별 영상 매뉴얼 주의: 위의 모든 보너스를 받기 위해서는 MQL5 개인 메시지 시스템을 통해 판매자에게 연락해 주세요. 독창적인 커스텀 지표인 “Divergence Bomber(다이버전스 봄버)”를 소개합니다. 이 지표는 MACD 다이버전스(괴리) 전략을 기반으로 한 올인원(All-in-One) 거래 시스템입니다. 이 기술 지표의 주요 목적은 가격과 MACD 지표 간의 다이버전스를 감지하고, **향후 가격이 어느 방향으로 움직일지를 알려주는
Power Candles MT5
Daniel Stein
5 (6)
Power Candles – 모든 시장을 위한 강도 기반 진입 신호 Power Candles 는 Stein Investments의 검증된 강도 분석을 가격 차트에 직접 제공합니다. 가격 움직임에만 반응하는 대신, 각 캔들은 실제 시장 강도를 기준으로 색상화되어 모멘텀 형성, 강도 가속, 명확한 추세 전환을 즉시 파악할 수 있습니다. 모든 시장을 위한 단일 로직 Power Candles는 모든 거래 심볼 에서 자동으로 작동합니다. 현재 심볼이 Forex인지 비-Forex 시장인지 자동으로 감지하여 내부적으로 적절한 강도 모델을 적용합니다. Forex 및 Gold 는 FX Power Delta 값을 사용합니다 (절대값 범위 최대 100) 지수, 크립토 및 CFD 는 IX Power Strength 값을 사용합니다 (절대값 범위 최대 50) 필요한 강도 계산은 Power Candles에 완전히 내장되어 있습니다. 캔들 색상이나 신호 로직을 위해 추가 인디케이터는 필요하지 않습니다. 가격
Game Changer Indicator mt5
Vasiliy Strukov
4.79 (19)
Game Changer는 모든 금융 상품에 적용 가능한 혁신적인 추세 지표로, MetaTrader를 강력한 추세 분석 도구로 탈바꿈시켜 줍니다. 모든 시간대에서 작동하며 추세 식별, 잠재적 반전 신호 제공, 트레일링 스톱 기능, 그리고 신속한 시장 대응을 위한 실시간 알림 기능을 제공합니다. 숙련된 전문가든 이제 막 시작하는 초보자든, Game Changer는 추세의 역학을 명확하게 이해하고 자신감 있고 규율 있는 거래를 할 수 있도록 도와줍니다. 이 지표는 차트 재구성 기능을 지원합니다. 구매 후 즉시 연락 주시면 특별 보너스를 드립니다. Strong Support 및 Trend Scanner 지표를 무료로 제공해 드립니다. [email protected]으로 메시지를 보내주세요. 참고로, 저는 텔레그램에서 EA나 특별 세트를 판매하지 않습니다. 모든 EA는 MQL5에서만 사용 가능하며, 세트 파일은 제 블로그(여기)에서만 다운로드하실 수 있습니다. 사기꾼을 조심하시고 다른 사
Smart Stop Indicator – 차트 위에서 직접 작동하는 지능형 스톱로스 시스템 개요 Smart Stop Indicator는 감이나 추측이 아닌 명확하고 체계적인 방식으로 스톱로스를 설정하고 싶은 트레이더를 위한 맞춤형 솔루션입니다. 이 도구는 클래식 프라이스 액션 논리(고점, 저점 구조)와 현대적인 브레이크아웃 인식을 결합하여 실제로 가장 논리적인 다음 스톱 레벨을 정확히 식별합니다. 추세, 박스권, 빠른 브레이크아웃 상황 등 어떤 시장에서도 인디케이터는 최적의 SL 구역과 상태(“new”, “broken”, “valid”)를 차트에 직접 표시합니다. 새로운 기능으로 SL 거리의 %ADR 표시가 추가되었습니다. 핵심 기능 자동 시장구조 기반 스톱 설정 • 시장 구조와 실시간 가격 움직임을 기반으로 의미 있는 스톱로스 레벨을 자동으로 탐지합니다. 스마트 브레이크아웃 감지 • 빠른 방향 변화나 돌파 상황에서도 불필요한 조기 스톱 조정을 강요하지 않으며 유연하게 반응합
Azimuth Pro
Ottaviano De Cicco
5 (4)
LAUNCH PROMO Azimuth Pro price is initially set at 299$ for the first 100 buyers. Final price will be 499$ . THE DIFFERENCE BETWEEN RETAIL AND INSTITUTIONAL ENTRIES ISN'T THE INDICATOR — IT'S THE LOCATION. Most traders enter at arbitrary price levels, chasing momentum or reacting to lagging signals. Institutions wait for price to reach structured levels where supply and demand actually shift. Azimuth Pro maps these levels automatically: swing-anchored VWAP, multi-timeframe structure lines, an
FX Power MT5 NG
Daniel Stein
5 (31)
FX Power: 통화 강세 분석으로 더 스마트한 거래 결정을 개요 FX Power 는 어떤 시장 상황에서도 주요 통화와 금의 실제 강세를 이해하기 위한 필수 도구입니다. 강한 통화를 매수하고 약한 통화를 매도함으로써 FX Power 는 거래 결정을 단순화하고 높은 확률의 기회를 발견합니다. 트렌드를 따르거나 극단적인 델타 값을 사용해 반전을 예측하고자 한다면, 이 도구는 귀하의 거래 스타일에 완벽히 적응합니다. 단순히 거래하지 말고, FX Power 로 더 스마트하게 거래하세요. 1. FX Power가 거래자에게 매우 유용한 이유 통화와 금의 실시간 강세 분석 • FX Power 는 주요 통화와 금의 상대적 강세를 계산하고 표시하여 시장 역학에 대한 명확한 통찰력을 제공합니다. • 어떤 자산이 앞서고 있고 어떤 자산이 뒤처지는지 모니터링하여 보다 현명한 거래 결정을 내릴 수 있습니다. 포괄적인 멀티 타임프레임 뷰 • 단기, 중기 및 장기 타임프레임에서 통화와 금의 강세를
Trend Screener Pro MT5
STE S.S.COMPANY
4.84 (100)
트렌드 표시기, 트렌드 트레이딩 및 필터링을 위한 획기적인 고유 솔루션, 하나의 도구 안에 내장된 모든 중요한 트렌드 기능! Forex, 상품, 암호 화폐, 지수 및 주식과 같은 모든 기호/도구에 사용할 수 있는 100% 다시 칠하지 않는 다중 시간 프레임 및 다중 통화 표시기입니다. Trend Screener는 차트에 점이 있는 화살표 추세 신호를 제공하는 효율적인 지표 추세 추종 지표입니다. 추세 분석기 표시기에서 사용할 수 있는 기능: 1. 트렌드 스캐너. 2. 최대 이익 분석이 있는 추세선. 3. 추세 통화 강도 측정기. 4. 경고가 있는 추세 반전 점. 5. 경고가 있는 강력한 추세 점. 6. 추세 화살표 Trend Screener Indicator가 있는 일일 분석 예, 일일 신호 성능...등은 여기에서 찾을 수 있습니다. 여기를 클릭하십시오. LIMITED TIME OFFER : Trend Screener Indicator는 50$ 및 평생 동안만 사용할 수 있습니다.
Atomic Analyst MT5
Issam Kassas
4.07 (28)
우선적으로 언급할 점은이 거래 지표가 다시 그리지 않고 지연되지 않으며 이를 통해 수동 및 로봇 거래 모두에 이상적이라는 점입니다. 사용자 매뉴얼: 설정, 입력 및 전략. Atomic Analyst는 가격의 강도와 모멘텀을 활용하여 시장에서 더 나은 이점을 찾는 PA Price Action Indicator입니다. 고급 필터를 장착하여 잡음과 거짓 신호를 제거하고 거래 잠재력을 높이는 데 도움이 됩니다. 복잡한 지표의 다중 레이어를 사용하여 Atomic Analyst는 차트를 스캔하고 복잡한 수학적 계산을 간단한 신호와 색상으로 변환하여 초보 트레이더가 이해하고 일관된 거래 결정을 내릴 수 있도록합니다. "Atomic Analyst"는 새로운 및 경험이 풍부한 트레이더를위한 종합적인 거래 솔루션입니다. 프리미엄 지표와 최고 수준의 기능을 하나의 거래 전략에 결합하여 모든 종류의 트레이더에 대한 다재다능한 선택지가되었습니다. 인트라데이 거래 및 스캘핑 전략 : 빠르고 정확한 일일
Entry Points Pro for MT5
Yury Orlov
4.48 (138)
다시 색을 칠하지 않고 거래에 진입할 수 있는 정확한 신호를 제공하는 MT5용 지표입니다. 외환, 암호화폐, 금속, 주식, 지수 등 모든 금융 자산에 적용할 수 있습니다. 매우 정확한 추정값을 제공하고 매수와 매도의 가장 좋은 시점을 알려줍니다. 하나의 시그널로 수익을 내는 지표의 예와 함께 비디오 (6:22)시청하십시오! 대부분의 거래자는 Entry Points Pro 지표의 도움으로 첫 거래 주 동안 트레이딩 결과를 개선합니다. 저희의   Telegram Group 을 구독하세요! Entry Points Pro 지표의 좋은점. 재도색이 없는 진입 신호 신호가 나타나고 확인되면(시그널 캔들이 완성된 경우) 신호는 더 이상 사라지지 않습니다. 여타 보조지표의 경우 신호를 표시한 다음 제거되기 때문에 큰 재정적 손실로 이어집니다. 오류 없는 거래 게시 알고리즘을 통해 트레이드(진입 또는 청산)를 할 이상적인 순간을 찾을 수 있으며, 이를 통해 이를 사용하는 모든 거래자의 성공률이
Gold Entry Sniper
Tahir Mehmood
5 (4)
Gold Entry Sniper – 골드 스캘핑 & 스윙 트레이딩을 위한 전문 다중 시간 프레임 ATR 대시보드 Gold Entry Sniper 는 XAUUSD 및 기타 종목에 대해 정확한 매수/매도 신호 를 제공하는 고급 MetaTrader 5 지표입니다. ATR 트레일링 스톱 로직 과 다중 시간 프레임 분석 을 기반으로 설계되어 스캘핑과 스윙 트레이딩 모두에 적합합니다. 주요 기능 및 장점 다중 시간 프레임 분석 – M1, M5, M15 추세를 한눈에 확인. ATR 기반 트레일링 스톱 – 변동성에 따라 자동 조정. 전문 차트 대시보드 – 신호 상태, ATR 레벨, 회귀선, 매매 방향 표시. 명확한 매수/매도 마커 – 자동 화살표와 텍스트 라벨. 종료 알림 & 거래 관리 – 수익 보호를 위한 자동 종료 감지. 완전 사용자 설정 가능 – 대시보드 위치, 색상, ATR/회귀선 파라미터 조정. 골드(XAUUSD) 최적화 – M1~M15 스캘핑에 완벽, 외환/지수/암호화폐에도 적용 가능.
Grabber System MT5
Ihor Otkydach
4.82 (22)
탁월한 기술적 지표인 Grabber를 소개합니다. 이 도구는 즉시 사용 가능한 “올인원(All-Inclusive)” 트레이딩 전략으로 작동합니다. 하나의 코드 안에 강력한 시장 기술 분석 도구, 매매 신호(화살표), 알림 기능, 푸시 알림이 통합되어 있습니다. 이 인디케이터를 구매하신 모든 분들께는 다음의 항목이 무료로 제공됩니다: Grabber 유틸리티: 오픈 포지션을 자동으로 관리하는 도구 단계별 영상 매뉴얼: 설치, 설정, 그리고 실제 거래 방법을 안내 맞춤형 세트 파일: 인디케이터를 빠르게 자동 설정하여 최고의 성과를 낼 수 있도록 도와줍니다 다른 전략은 이제 잊어버리세요! Grabber만이 여러분을 새로운 트레이딩의 정점으로 이끌어 줄 수 있습니다. Grabber 전략의 주요 특징: 거래 시간 프레임: M5부터 H4까지 거래 가능한 자산: 어떤 자산이든 사용 가능하지만, 제가 직접 테스트한 종목들을 추천드립니다 (GBPUSD, GBPCAD, GBPCHF, AUDCAD, AU
FX Levels MT5
Daniel Stein
5 (13)
FX Levels: 모든 시장을 위한 뛰어난 정확도의 지지와 저항 간단 요약 통화쌍, 지수, 주식, 원자재 등 어떤 시장이든 믿을 만한 지지·저항 레벨을 찾고 싶나요? FX Levels 는 전통적인 “Lighthouse” 기법과 첨단 동적 접근을 결합해, 거의 보편적인 정확성을 제공합니다. 실제 브로커 경험을 반영하고, 자동화된 일별 업데이트와 실시간 업데이트를 결합함으로써 FX Levels 는 가격 반전 포인트를 파악하고, 수익 목표를 설정하며, 자신 있게 트레이드를 관리할 수 있게 돕습니다. 지금 바로 시도해 보세요—정교한 지지/저항 분석이 어떻게 여러분의 트레이딩을 한 단계 끌어올릴 수 있는지 직접 확인하세요! 1. FX Levels가 트레이더에게 매우 유용한 이유 뛰어난 정확도의 지지·저항 존 • FX Levels 는 다양한 브로커 환경에서도 거의 동일한 존을 생성하도록 설계되어, 데이터 피드나 시간 설정 차이로 인한 불일치를 해소합니다. • 즉, 어떤 브로커를 사용하
우선적으로, 이 거래 도구는 전문적인 거래에 이상적인 비-다시 그리기 및 지연되지 않는 지표입니다.  온라인 강좌, 사용자 매뉴얼 및 데모. 스마트 가격 액션 컨셉트 인디케이터는 신규 및 경험 많은 트레이더 모두에게 매우 강력한 도구입니다. Inner Circle Trader Analysis 및 Smart Money Concepts Trading Strategies와 같은 고급 거래 아이디어를 결합하여 20가지 이상의 유용한 지표를 하나로 결합합니다. 이 인디케이터는 스마트 머니 컨셉트에 중점을 두어 대형 기관의 거래 방식을 제공하고 이동을 예측하는 데 도움을 줍니다.  특히 유동성 분석에 뛰어나 기관이 어떻게 거래하는지 이해하는 데 도움을 줍니다. 시장 트렌드를 예측하고 가격 변동을 신중하게 분석하는 데 탁월합니다. 귀하의 거래를 기관 전략에 맞추어 시장의 동향에 대해 더 정확한 예측을 할 수 있습니다. 이 인디케이터는 시장 구조를 분석하고 중요한 주문 블록을 식별하고 다양
Quantum TrendPulse
Bogdan Ion Puscasu
5 (20)
SuperTrend   ,   RSI   ,   Stochastic   의 힘을 하나의 포괄적인 지표로 결합하여 트레이딩 잠재력을 극대화하는 궁극의 트레이딩 도구   인 Quantum TrendPulse를   소개합니다. 정밀성과 효율성을 추구하는 트레이더를 위해 설계된 이 지표는 시장 추세, 모멘텀 변화, 최적의 진입 및 종료 지점을 자신 있게 식별하는 데 도움이 됩니다. 주요 특징: SuperTrend 통합:   주요 시장 추세를 쉽게 따라가고 수익성의 물결을 타세요. RSI 정밀도:   매수 과다 및 매도 과다 수준을 감지하여 시장 반전 시점을 파악하는 데 적합하며 SuperTrend 필터로 사용 가능 확률적 정확도:   변동성이 큰 시장에서 숨겨진 기회를 찾기 위해 확률적 진동   을 활용하고 SuperTrend의 필터로 사용 다중 시간대 분석:   M5부터 H1 또는 H4까지 다양한 시간대에 걸쳐 시장을 최신 상태로 유지하세요. 맞춤형 알림:   맞춤형 거래 조건이 충족되면
매일 많은 트레이더들이 공통적인 도전에 직면합니다: 가격이 주요 레벨을 돌파하는 것처럼 보여 거래에 진입하면, 시장이 반전하여 스톱로스가 발동됩니다. 이것을 거짓 돌파(False Breakout)라고 합니다 — 가격이 지지 또는 저항 수준을 잠시 넘어선 후 방향을 반전하는 움직임입니다. 이러한 움직임은 실제 가격 방향이 명확해지기 전에 스톱로스가 발동되는 결과를 초래할 수 있습니다. 기술적 분석에서 이 현상은 일반적으로 "유동성 스윕"(liquidity sweep) 또는 "스톱 헌팅"(stop hunt)이라고 합니다. Mirage Trading System은 거짓 돌파 패턴을 감지하도록 설계된 지표입니다. "Mirage"(신기루)라는 이름은 시장에서 빈번하게 발생하는 기만적인 가격 움직임이라는 환상을 의미합니다. 거짓 돌파가 많은 트레이더를 당황하게 할 수 있지만, Mirage Trading System은 이러한 패턴이 언제 형성되는지 식별하고 후속 가격 움직임의 잠재적 방향을 나
Pointer Trend Switch — precision trend reversal indicator Pointer Trend Switch is a high-precision arrow indicator designed to detect key moments of trend reversal based on asymmetric price behavior within a selected range of bars. It identifies localized price impulses by analyzing how far price deviates from the opening level, helping traders find accurate entry points before a trend visibly shifts. This indicator is ideal for scalping, intraday strategies, and swing trading, and performs equa
Trend indicator AI mt5
Ramil Minniakhmetov
5 (15)
트렌드 인공 지능 지표는 실행 가능한 진입 점 및 반전 경고와 추세 식별을 결합하여 상인의 시장 분석을 향상시킬 훌륭한 도구입니다. 이 표시기는 사용자가 자신감과 정밀도로 외환 시장의 복잡성을 탐색 할 수 있도록 지원합니다 기본 신호 외에도 트렌드 인공 지능 지표는 풀백 또는 되돌림 중에 발생하는 2 차 진입 점을 식별하여 거래자가 기존 트렌드 내에서 가격 수정을 활용할 수 있도록합니다. 중요한 장점: ·작동 4 및 5 *명확한 구매 또는 판매 신호 *다시 칠하지 않습니다 *모든 자산에서 작동 나는 전보 사기에 개 또는 세트를 판매하지 않도록주의. 모든 설정은 블로그에 여기에 무료.  중요! 지침 및 보너스를 얻기 위해 구입 후 즉시 저에게 연락! 진짜 가동 감시는 뿐 아니라 나의 다른 제품 여기에서 찾아낼 수 있습니다: https://www.mql5.com/en/users/mechanic/seller&nbsp ; 설정 및 입력: 모든 자산에 대해 기본 설정을 권
Crystal Heikin Ashi Signals - Professional Trend & Signal Detection Indicator Advanced Heikin Ashi Visualization with Intelligent Signal System for Manual & Automated Trading Final Price: $149 ---------> Price goes up $10 after every 10 sales . Limited slots available — act fast . Overview Crystal Heikin Ashi Signals is a professional-grade MetaTrader 5 indicator that combines pure Heikin Ashi candle visualization with an advanced momentum-shift detection system. Designed for both manual traders
ATrend
Zaha Feiz
4.82 (17)
ATREND: 작동 방식 및 사용 방법 ### 작동 방식 MT5 플랫폼을 위한 "ATREND" 지표는 기술 분석 방법론의 조합을 활용하여 트레이더에게 강력한 매수 및 매도 신호를 제공하도록 설계되었습니다. 이 지표는 주로 변동성 측정을 위해 평균 진폭 범위(ATR)를 활용하며, 잠재적인 시장 움직임을 식별하기 위한 트렌드 탐지 알고리즘과 함께 사용됩니다. 구매 후 메시지를 남기면 특별 보너스 선물을 받게 됩니다. ### 주요 특징: - 동적 트렌드 탐지: 이 지표는 시장 트렌드를 평가하고 신호를 조정하여 트레이더가 현재 시장 상황에 맞춰 전략을 조정할 수 있도록 돕습니다. - 변동성 측정: ATR을 사용하여 시장의 변동성을 측정하며, 이는 최적의 손절매(SL) 및 이익 실현(TP) 수준을 결정하는 데 중요합니다. - 신호 시각화: 이 지표는 차트에 매수 및 매도 신호를 시각적으로 표시하여 트레이더의 의사 결정을 향상시킵니다. ### 운영 단계 #### 입력 및 설정 - TimeFr
소개       Quantum Breakout PRO   , 브레이크아웃 존 거래 방식을 변화시키는 획기적인 MQL5 지표! 13년 이상의 거래 경험을 가진 숙련된 트레이더 팀이 개발한       퀀텀 브레이크아웃 PRO       혁신적이고 역동적인 브레이크아웃 존 전략으로 거래 여정을 새로운 차원으로 끌어올리도록 설계되었습니다. Quantum Breakout Indicator는 5개의 이익 목표 영역이 있는 브레이크아웃 영역의 신호 화살표와 브레이크아웃 상자를 기반으로 한 손절 제안을 제공합니다. 초보자 거래자와 전문 거래자 모두에게 적합합니다. Quantum EA 채널:       여기를 클릭하세요 중요한! 구매 후 설치 매뉴얼을 받으려면 개인 메시지를 보내주십시오. 추천: 기간: M15 통화쌍: GBPJPY, EURJPY, USDJPY,NZDUSD, XAUUSD 계정 유형: 스프레드가 매우 낮은 ECN, Raw 또는 Razor 브로커 시간: GMT +3 중개인 :
Suleiman Levels
Suleiman Alhawamdah
5 (3)
اسم المصدر:   مؤشر أسعار الأسهم الخاص بمؤشر القوة النسبية 2 "مستويات سليمان" 지표와 "RSI Trend V" شكرا جزيلا. يبلغ عدد مستويات سليمان 9,800 مليون جنيه إسترليني، وهو ما يزيد عن 9,800 مليون دولار أمريكي شكرا جزيلا. شكرا جزيلا. مستويات سليمان في اللعبة: 노란색 박스 (자금 흐름 감지)   - 노란색 박스 설명: ""الحصول على معلومات إضافية عن العمل" 기능 - 처음부터 개발됨": 특정 캔들에서 은행 및 기관의 자금 유입을 감지합니다. هذا هو السبب في أن هذا هو ما يحدث في المستقبل. اسم المنتج: """"""""""""""   " 지표 기능 - 처음부터 개발됨": 재표시되지 독창적인 컬러 레벨 시스템. "هذا هو السبب
Transaction Speed MT5
Ivan Stefanov
5 (3)
이 지표는 시장에서 관심이 나타나는 영역 을 강조 표시한 후, 주문이 누적되는 영역 을 보여줍니다. 이는 **대규모 오더북(호가창)**처럼 작동합니다. 이것은 거대한 자금 을 위한 인디케이터입니다. 성능은 탁월하며, 시장에서 어떤 관심이 있든 반드시 포착할 수 있습니다 . (이것은 완전히 새로 작성되고 자동화된 버전 입니다 – 이제 수동 분석은 필요하지 않습니다.) **거래 속도(Transaction Speed)**는 새로운 개념의 인디케이터로, 시장에 대규모 주문이 언제, 어디에 쌓이는지를 보여주며 , 그 이점을 분석합니다. 매우 초기 단계에서 트렌드 전환 을 감지할 수 있습니다. FX 시장에서 흔히 사용하는 "거래량(volume)"은 오해입니다. 실제로는 시간당 가격 변화량 이므로, 올바른 용어는 거래 속도 입니다. 우리가 어떻게 사고하고, 행동하며, 분석하느냐 가 가장 중요합니다. 분석 패러다임의 전환 은 필수적입니다. 이 인디케이터는 외환 시장에서의 볼륨 개념을 논리적으로
TrendMaestro5
Stefano Frisetti
note: this indicator is for METATRADER4, if you want the version for METATRADER5 this is the link:  https://www.mql5.com/it/market/product/108106 TRENDMAESTRO ver 2.5 TRENDMAESTRO recognizes a new TREND from the start, he never makes mistakes. The certainty of identifying a new TREND is priceless. DESCRIPTION TRENDMAESTRO identifies a new TREND in the bud, this indicator examines the volatility, volumes and momentum to identify the moment in which there is an explosion of one or more of these da
트렌드 라인즈 프로       이 지표는 시장이 실제로 어떤 방향으로 전환되는지 파악하는 데 도움이 됩니다. 실제 추세 반전 지점과 주요 시장 참여자들이 다시 진입하는 지점을 보여줍니다. 보시다시피       BOS 라인       복잡한 설정이나 불필요한 노이즈 없이 더 높은 시간대의 추세 변화와 주요 레벨을 확인할 수 있습니다. 신호는 차트에 다시 그려지지 않고 캔들이 마감된 후에도 계속 표시됩니다. MT4 버전   -   RFI LEVELS PRO   표시기   와 결합 시 최대 잠재력을 발휘합니다. 지표가 보여주는 내용: 실제 변화       추세(BOS 라인) 한 번 신호가 나타나면 그 신호는 계속 유효합니다! 이는 신호를 발생시킨 후 변경될 수 있는 리페인팅 방식의 지표와 중요한 차이점입니다. 리페인팅 방식의 지표는 잠재적으로 자금 손실로 이어질 수 있습니다. 이제 더욱 높은 확률과 정확도로 시장에 진입할 수 있습니다. 또한 화살표가 나타난 후 목표가(익절)에 도달하거나
Dark Support Resistance  is an Indicator for intraday trading. This Indicator is programmed to identify  Support and Resistance Lines , providing a high level of accuracy and reliability. Key benefits Easily visible lines Only the most important levels will be displayed Automated adjustment for each timeframe and instrument Easy to use even for beginners Never repaints, never backpaints, Not Lag 100% compatible with Expert Advisor development All types of alerts available: Pop-up, Email, Push
제작자의 제품 더 보기
Easy Correlations
Ioannis Xenos
5 (4)
상관 기호 거래의 단순함을 발견하십시오 Easy Correlations와 함께 상관 기호 거래를 쉽게 마스터하고 싶으셨나요? 'Easy Correlations'을 만나보세요 - 시장 상관 관계의 복잡한 세계를 탐색하는 데 있어 새로운 최고의 친구입니다. 우리의 도구는 거래의 복잡성을 단순화하도록 설계되었으며, 도전적인 전략을 접근하기 쉽고 수익성 있는 경험으로 바꾸어 줍니다. 간단한 개념: 'Easy Correlations'의 핵심은 간단한 아이디어에 기반합니다. 일반적으로 동기화되어 움직이는 두 기호를 찾고, 그들의 경로가 갈라질 때 - 그것이 당신의 신호입니다. 하나를 사고 다른 하나를 판매하세요. 하지만 올바른 도구가 없다면 이것은 어려운 작업이 될 수 있습니다. 여기에서 우리가 도움을 줍니다. 기술 해독: '피어슨 상관관계' 및 'RSI 지표'와 같은 용어가 압도적일 수 있다는 것을 알고 있습니다. 'Easy Correlations'은 이러한 복잡한 개념을 쉽게 이해할 수 있
Simple CCI by Ioannis Xenos
Ioannis Xenos
4.33 (15)
Insta: @xignalcoding New release:   Delta Quantum EA Xignal-Coding에서는 거래자들이 시장에서 성공할 수 있도록 열심히 돕고 있습니다. 이번에 공유하려는 것은 새로 개발한 Simple CCI 트레이딩 로봇/도구입니다. 이 로봇의 주요 목표는 거래자들이 CCI 지표를 이해하고 원하는 자산의 거래에서 이를 활용할 수 있는 안전하고 신뢰할 수 있는 도구를 제공하는 것입니다. Simple CCI를 사용하면 거래 전략을 완전히 제어할 수 있습니다. 추세 지속 전략이나 평균 회귀 전략으로 사용하여 과매도 및 과매수 수준에서 쉽게 거래할 수 있습니다. 구매 및 판매 주문에 대한 CCI 레벨 및 교차 방향(위 또는 아래)을 선택하면 됩니다. 또한 로봇에는 모든 자산에 적용 가능한 동적 및 범용적인 방식으로 스탑 로스 및 테이크 프로핏 레벨을 설정하는 ATR 옵션이 포함되어 있습니다. Xignal-Coding에서는 우선적으로 안전하고 안정적인
FREE
Advanced CCI 거래 봇 및 도구에 오신 것을 환영합니다. 이 도구는 선호하는 자산을 연구하고 거래하기 위한 완벽한 솔루션입니다. 이 다재다능한 도구를 사용하면 전략을 완전히 제어할 수 있습니다. 다양한 매개변수를 조정하여 CCI 지표를 기반으로 한 고유한 전략을 만들 수 있으며, MA 필터, 동적 로트 크기, 켈리 기준 계산기, 동적 및 추적 SL 및 TP 레벨, FTMO 또는 기타 프롭 펀드 거래 도전을 수행하는 사람들을 위해 특별히 설계된 계정 보호, 분석, 통계 및 기본 심볼 정보가 포함됩니다. 스캘퍼, 브레이크아웃 거래자, 평균 회귀 거래자, 추세 추종자 또는 기타 유형의 거래자라면 Advanced CCI 거래 봇이 모두 다 갖춰져 있습니다. 이제 공을 잡으세요. Advanced CCI 거래 봇 및 도구로 거래를 다음 레벨로 끌어올리세요. xignal-coding에서는 안전하고 책임감 있는 거래를 우선으로 합니다. 이로 인해 계정을 위협할 수 있는 마틴게일 또는 고위
Master Oscillators를 만나보세요, 이것은 거래를 단순하고 유연하게 만드는 봇입니다! RSI, CCI, 또는 Stochastic 신호 중에서 선택하고 당신만의 전략을 구축하세요. 이 봇은 MA 필터, 동적 로트 크기, Kelly Criterion 계산기, 동적 SL 및 TP 레벨 등 많은 도구를 제공합니다. 당신의 거래 스타일에 관계없이, Master Oscillators는 여기에 있습니다. 이것은 중요한 정보, 통계 등을 제공하면서 항상 당신의 거래를 안전하게 유지합니다. 만약 당신이 언제나 당신만의 거래 봇을 만들고 싶었지만 방법을 몰랐다면, Master Oscillators가 도와줄 수 있습니다. 오늘부터 Master Oscillators를 사용해보시고 당신의 거래를 향상시켜보세요! 사용자 가이드:  https://www.mql5.com/en/blogs/post/753361 신제품!!! 안티 마틴게일 시스템 도입! 이제 매우 낮은 리스크로 높은 수익을 얻을 수 있
Easy Correlations Indicator The Easy Correlations Indicator is designed to help traders analyze the relationship between two correlated instruments. By monitoring the distance between their Relative Strength Index (RSI) values, the indicator highlights situations where one instrument has moved significantly further than the other. This creates potential trading opportunities: Sell the stronger instrument (overstretched RSI) Buy the weaker instrument (lagging RSI) Because the positions are opened
FREE
XC Trade Manager
Ioannis Xenos
5 (1)
XC Trade Manager for MT5  Manage Your Trades with Precision and Ease Welcome to XC Trade Manager, the ultimate solution for traders seeking efficient and intuitive trade management on the MT5 platform. Developed by xignalcoding.com, our seventh product in the MQL5 Market lineup, the XC Trade Manager is designed to streamline your trading experience, allowing you to focus on what truly matters—making informed trading decisions. Key Features 1. Orders Tab Effortlessly place and manage your trades
Provlepsis
Ioannis Xenos
Provlepsis 지표에 오신 것을 환영합니다. "Provlepsis"는 MQL 마켓을 위해 개발된 고급 지표입니다. 같은 시간대의 이전 바를 분석하여 시장 움직임의 잠재적 범위를 정확하게 계산하여 향후 가격 변동에 대한 소중한 통찰력을 제공합니다. 전통적인 ATR 지표와 달리 "Provlepsis"는 시간 요소를 고려하여 다양한 시장 조건에 적응하는 더 강력한 도구입니다. 밤에는 좁은 범위를 예측하고 활발한 거래 시간대에는 더 넓은 범위를 예측합니다. "Provlepsis"가 제공하는 포괄적인 범위 분석으로 거래 전략에서 경쟁 우위를 확보하세요. 최초 20개 다운로드 가격: 35.00달러 다음 가격: 60.00달러 프로블렙시스 사용의 이유 범위 기반 트레이딩: 이 지표는 시장 움직임의 잠재적 범위를 식별하는 능력으로 범위 기반 트레이딩 전략에 가치를 제공할 수 있습니다. 트레이더는 이 지표를 사용하여 예상 범위 내에서 주요 지지선과 저항선을 식별하고 그에 맞게 거래를 실행할
Prop Grid
Ioannis Xenos
5 (1)
XignalCoding Prop Grid EA Build your own strategy. Pass prop firm challenges with confidence. The XignalCoding Prop Grid EA is a highly flexible and powerful trading tool designed for traders who want full control over their strategy, grid system, and risk. Whether you're testing ideas or aiming to pass prop firm challenges like FTMO, this EA gives you the structure and safety you need. Main Features Custom Strategy Creation Choose your entry signal: RSI, CCI, Stochastic, Williams, Bollinger Ba
Welcome to Correlation Signals by Xignal Coding! Unlock hidden opportunities in the markets with our powerful correlation matrix . Whether you trade Forex, Cryptos, Indices, or Commodities, Correlation Signals helps you spot assets that move together — and tells you when their relationship creates a trade-worthy opportunity. The program continuously monitors your selected assets. When a temporary distance appears between correlated pairs, you get a clear signal: Buy the weaker asset Sell the st
Welcome to the Pair Spread Oscillator by Xignal Coding! Ever wondered if you could monitor one asset against another—typically correlated—and spot opportunities? That’s exactly what you can do with the Pair Spread Oscillator! The Pair Spread Oscillator calculates the distance between your selected instruments and provides the mean distance and the standard deviation of your choice. This way, you can easily identify when these two instruments are moving in different directions and act before the
Delta Quantum
Ioannis Xenos
Delta Quantum EA by Xignal Coding This price is for the first 20 purchases. Next price -> 100$ Delta Quantum is a mean reversion Expert Advisor designed for traders who want both simplicity and power. It calculates the Delta (distance) – a unique measurement that highlights potential turning points in the market – and uses this as a signal for precise entries. Why choose Delta Quantum? Beginner-friendly with ready-to-use defaults for EURUSD H1. Advanced customization for traders who want to take
필터:
Lenia_Krou
59
Lenia_Krou 2023.07.08 22:39 
 

사용자가 평가에 대한 코멘트를 남기지 않았습니다

Ioannis Xenos
12682
개발자의 답변 Ioannis Xenos 2023.07.08 22:45
Thank you for your kind review!
리뷰 답변