TrendStrengthDeviationSub
- 지표
- 버전: 1.4

TrendStrengthDeviationSub
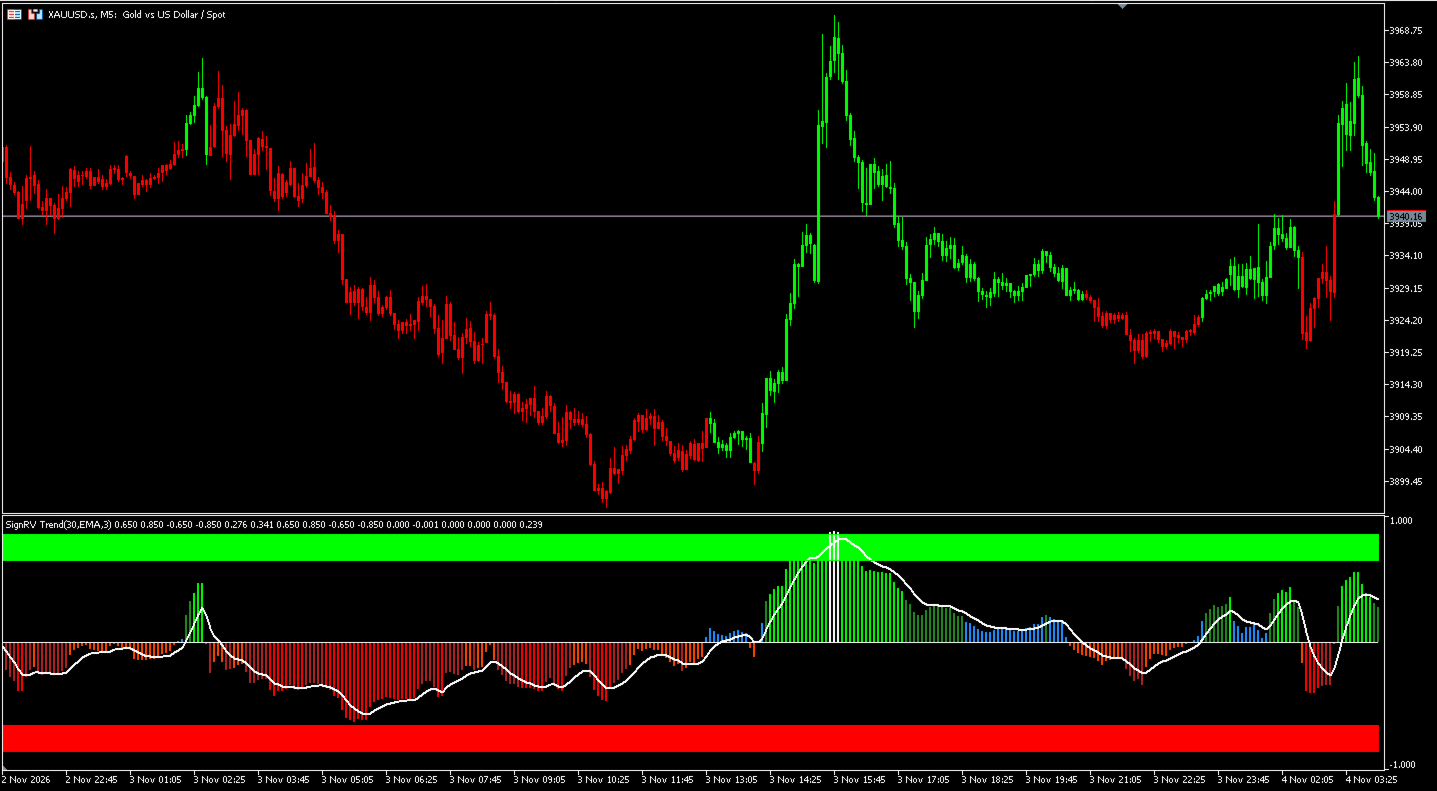
TrendStrengthDeviationSub is a visual indicator package for MetaTrader 5. It summarizes recent price movement into a trend strength reading between -1 and +1, together with a confirmed trend state. The package contains two indicators that can be used together or on their own: a main-chart candle coloring indicator and a separate-window oscillator. It is an indicator only and does not open, manage or close orders.
What is included
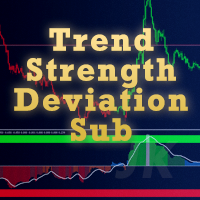
The main-chart indicator colors each candle according to the active trend state. Two user-defined colors are used, one for the bullish state and one for the bearish state. A confirmation level is applied before the state changes, which reduces frequent color changes while the reading stays near zero.
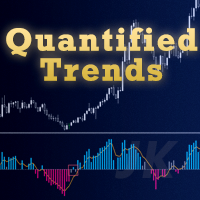
The separate-window indicator shows the trend strength reading as a colored histogram. A positive reading indicates bullish dominance, a negative reading indicates bearish dominance, and the absolute value shows how strong that dominance is. The histogram color changes in steps as the strength of the reading increases. An optional smoothed reference line, a zero line, strong and extreme levels on both sides, and shaded zones between those levels can be displayed. A set of auxiliary readings is also available in the Data Window for manual inspection.
When the trend state changes, an optional terminal alert can be shown for the current symbol and timeframe.
How to use
Install the product in MetaTrader 5 and attach either indicator to a chart, or attach both to keep the candle colors and the oscillator in view at the same time. Both indicators share the same common inputs, so keeping the common settings equal is recommended when they are used together.
The product works on any symbol and timeframe available in your terminal. Choose the timeframe that matches your own routine. The reading is updated with each incoming price. Values on the current, still forming bar can change until that bar closes, so the state and the histogram color of the latest bar should be treated as final after the bar closes. Alerts are checked on the latest bar and can therefore change during its formation.
Before using the product on a live account, test it on a demo account or in the visual mode of the Strategy Tester with your own broker data and your own settings.
Input parameters
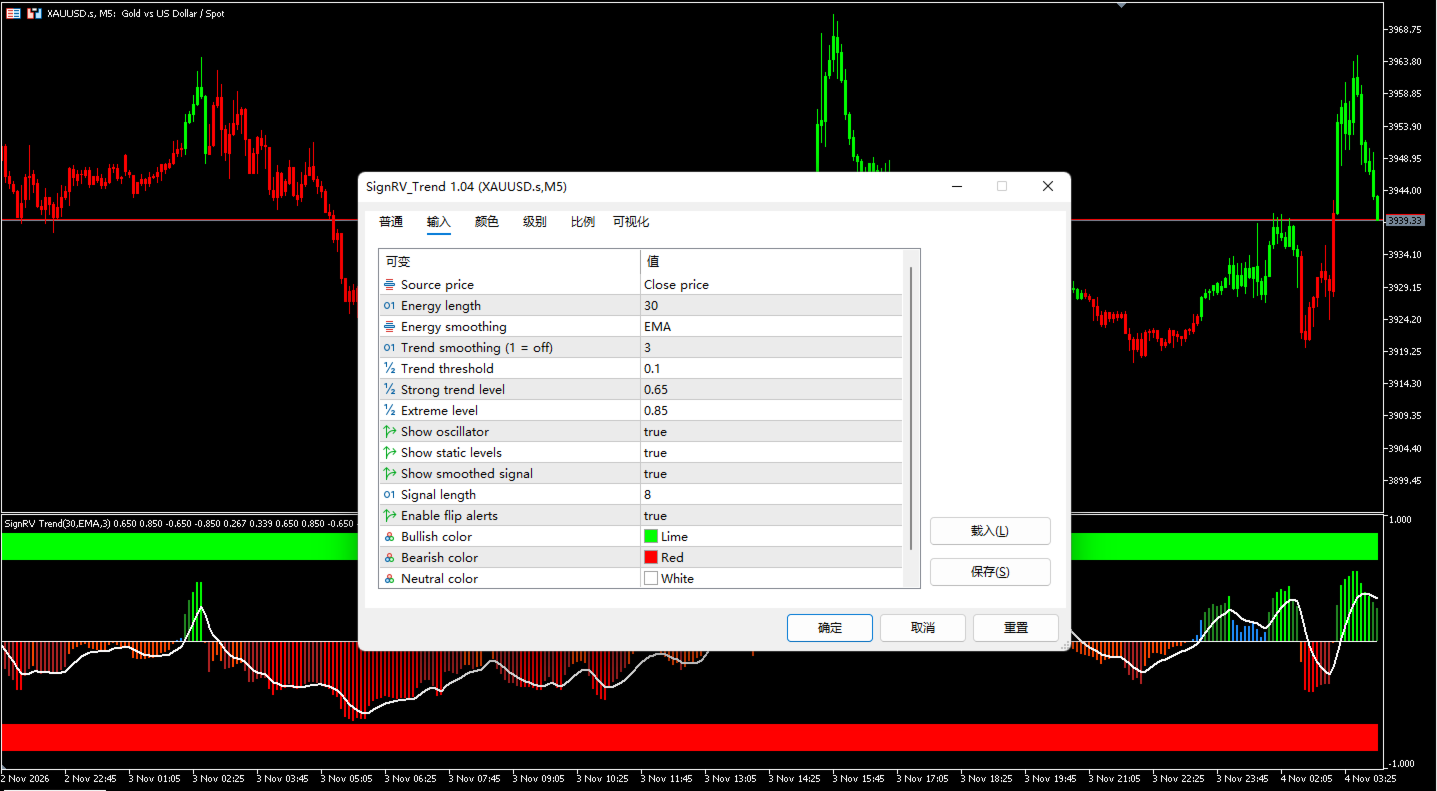
All parameter names below are shown exactly as they appear in the terminal. The five inputs in the first group are present in both indicators with the same names and default values.
Common settings (both indicators)
InpSource — PRICE_CLOSE. Price used for the calculation. Available values: PRICE_CLOSE, PRICE_OPEN, PRICE_HIGH, PRICE_LOW, PRICE_MEDIAN, PRICE_TYPICAL, PRICE_WEIGHTED.
InpEnergyLength — 30. Length of the evaluation window. Minimum value is 2. Larger values produce a smoother reading and a slower response.
InpEnergySmoothing — EMA. Smoothing mode, EMA or RMA (Wilder).
InpTrendSmoothing — 3. Additional smoothing of the trend reading. Set to 1 to turn it off. Minimum value is 1.
InpFlipThreshold — 0.10. Confirmation level required before the trend state changes. Allowed range is 0.00 to 1.00. Higher values require a stronger reading to change the state.
Main-chart indicator
InpBullColor — clrLime. Candle color for the bullish state.
InpBearColor — clrRed. Candle color for the bearish state.
Separate-window indicator: reading levels
InpStrongLevel — 0.65. Level that marks a strong reading. Allowed range is greater than 0.00 and less than 1.00.
InpExtremeLevel — 0.85. Level that marks an extreme reading. It must be greater than InpStrongLevel and not greater than 1.00.
Separate-window indicator: display options
InpShowOscillator — true. Show or hide the histogram.
InpShowStaticLevels — true. Show or hide the strong and extreme levels and the shaded zones.
InpShowSignal — true. Show or hide the smoothed reference line.
InpSignalLength — 8. Smoothing length of the reference line. Minimum value is 1.
InpEnableAlerts — true. Enable or disable terminal alerts on a trend state change.
Separate-window indicator: colors
InpBullColor — clrLime. Color used for bullish elements.
InpBearColor — clrRed. Color used for bearish elements.
InpNeutralColor — clrWhite. Color used for neutral elements.
Limitations
This product is a technical indicator for visual chart analysis. It is not an automated trading system, it does not place orders, and it does not guarantee any trading outcome. No result is promised or implied. Past readings and past performance do not determine future results. Trading on financial markets involves risk, and all decisions remain with the trader. Please evaluate the product on a demo account before live use.