EA Slipstream
- 유틸리티
-
Stephen J Martret
 With over 23 years of experience trading Forex, Gold, and other financial markets, I have worked extensively with both discretionary (manual) and algorithmic trading strategies across a wide range of market conditions.
 - 버전: 1.2
- 업데이트됨: 21 9월 2026
- 활성화: 10
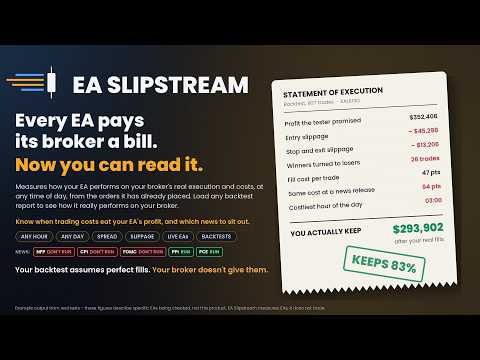
Your backtest filled every order at the price it asked for. Your account does not. EA Slipstream measures what execution costs your EA, using your own fills, slippages and spreads to show you the true performance of your EA.
Special launch price of $99 for this week only. Price rises to $149 from the 26h September (when market closes)
A backtest prices every trade at the level the EA named. In live trading a pending order fills at whatever price is available when it triggers, a stop closes wherever the market is when it is hit, and the spread at that moment is whatever the account was quoting. The difference between those two things is not an opinion or a model — it is already recorded in the orders your EAs have placed and in the price history your terminal holds.
EA Slipstream reads both. It measures what your account gives up on a fill, what the spread was at the minute each trade opened, and what happens to the spread in the seconds after a high-impact news release. It then applies those measurements to the trades themselves: to the EAs already running on your account, and to any Strategy Tester report you load. The result is the same EA seen a second time, priced at your own execution rather than at perfect fills.
Execution conditions differ from one account to another and from one symbol to another. This tool does not judge them and does not compare one provider with another. It measures what your account did, and shows what that costs the strategy.
Three Steps
- Pick a source. Your live account history, or a Strategy Tester report saved into MQL5\Files. Either way, the spreads and fills used are your own.
- Pick what to measure. Everything the EA trades, all high-impact news releases graded one by one, or a single report such as the last 24 NFPs. Choose 12, 24 or 36 months.
- Pick the settings. It reads each EA's pending distance, stop, target and trailing from the orders it left behind, or you type in a setup you want to test. Then it runs.
What It Measures
Slippage, from real fills. For a pending order it compares the price the order named with the price it actually got. For a stop or target exit it compares the level with the fill. These are measured, not modelled.
Spread, from your own history. The spread at the minute each trade opened is read from M1 history. Around news releases it is read from tick data, second by second.
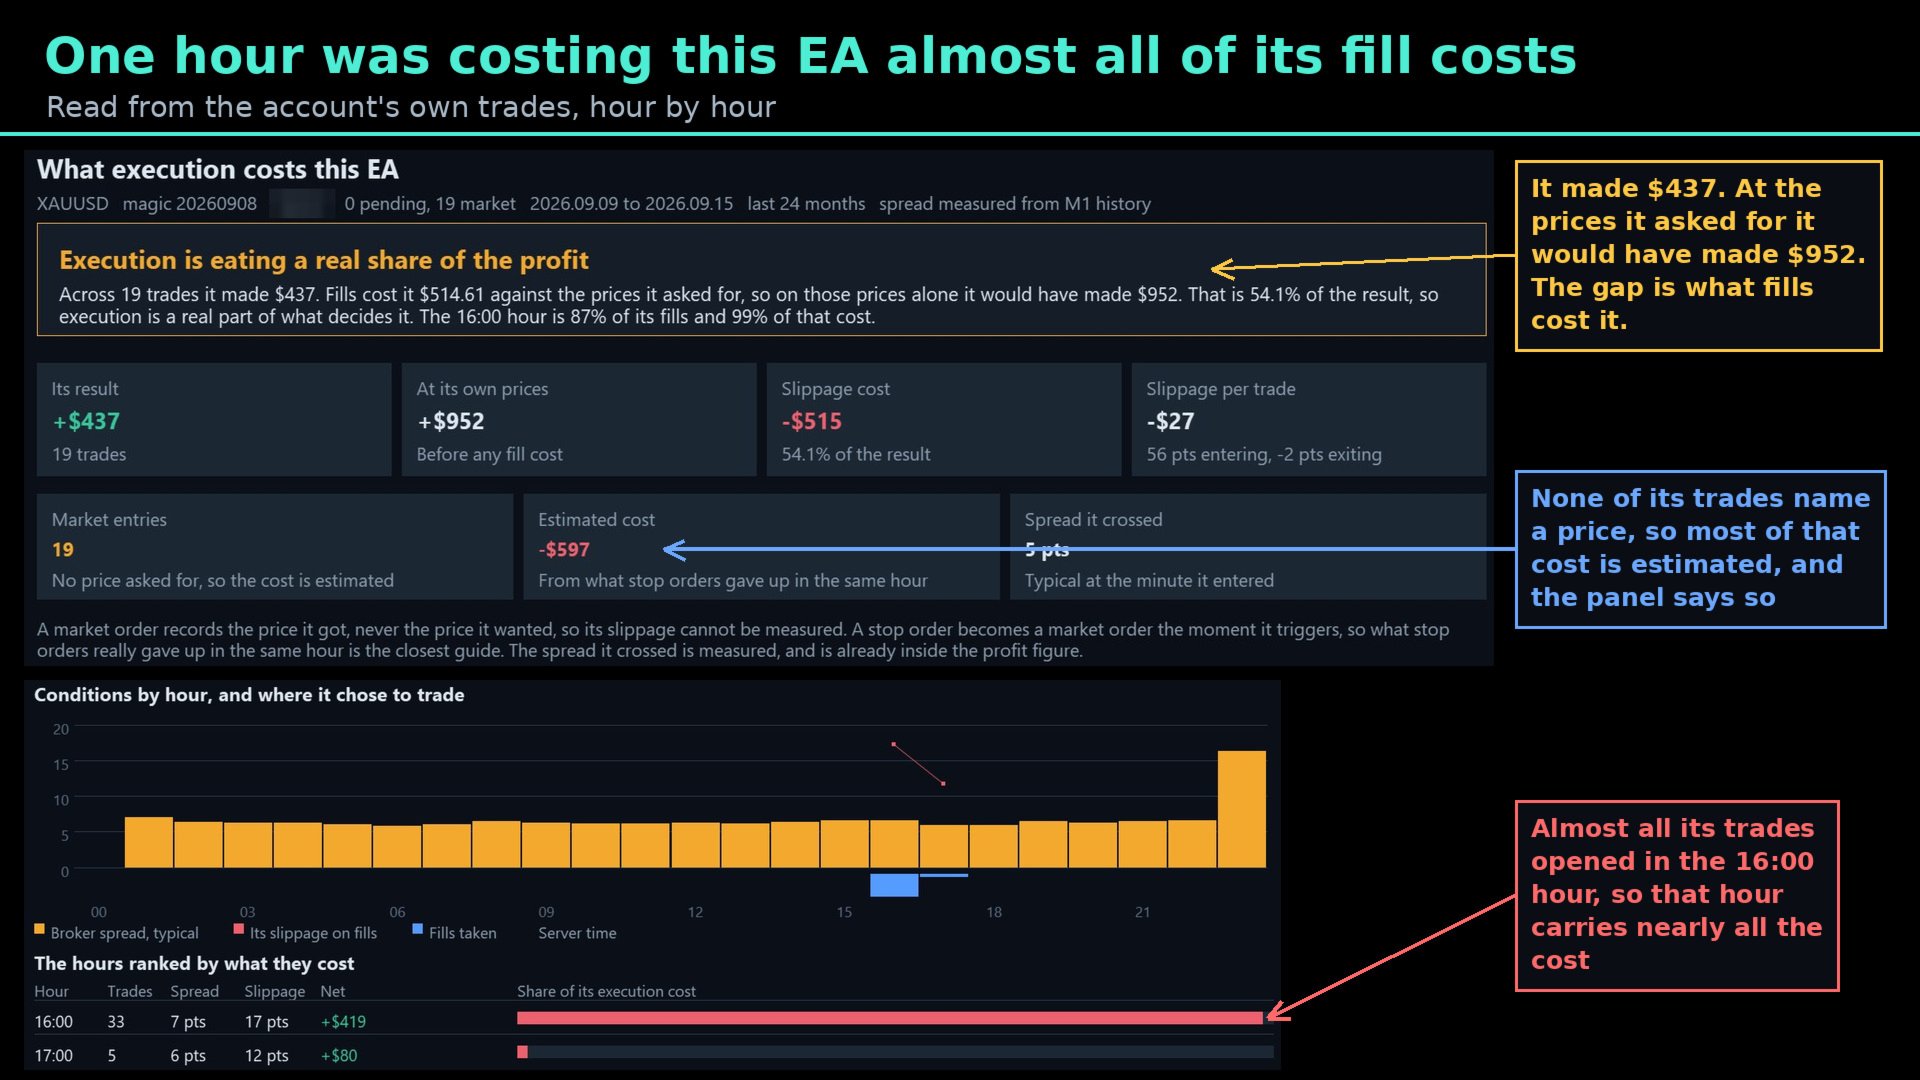
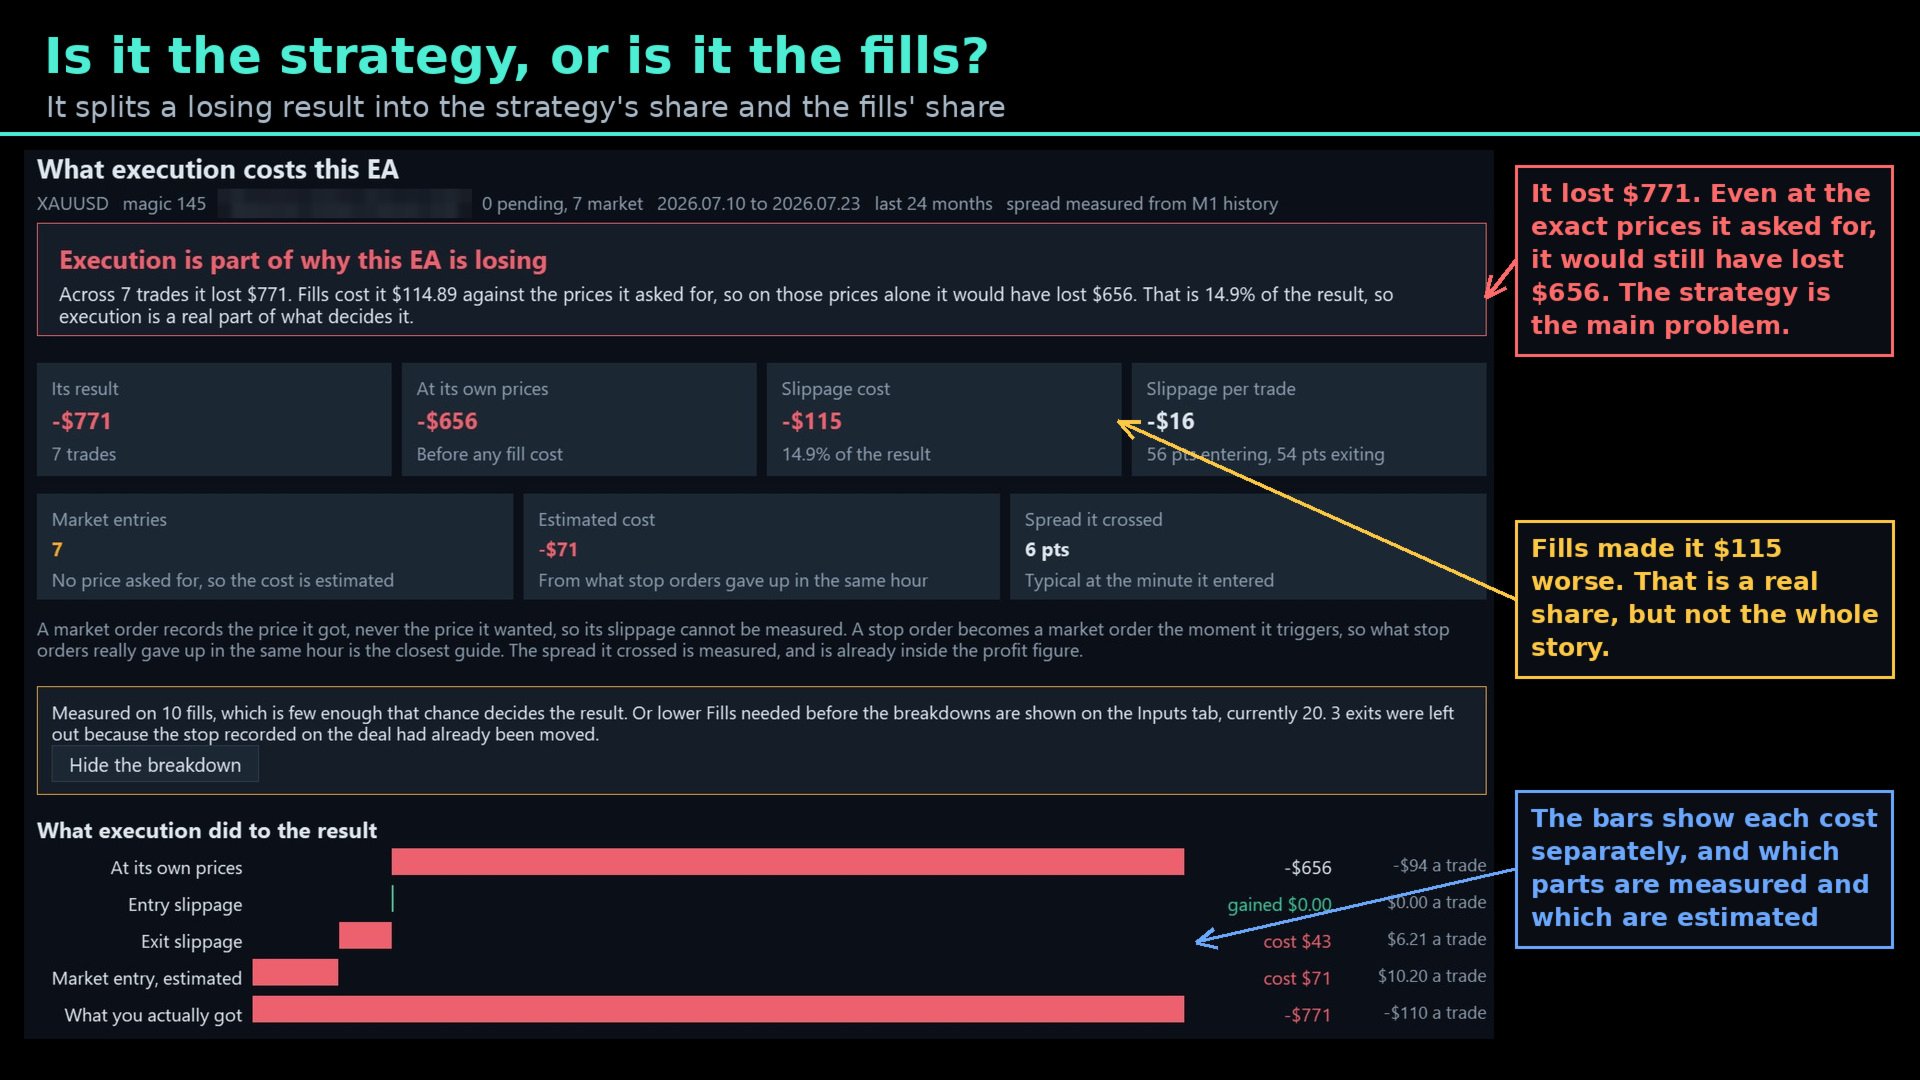
Market entries are estimated, and labelled as such. A market order never records the price it wanted, so its slippage cannot be measured. The tool estimates it from what stop orders gave up in the same hour, and every figure on screen says whether it was measured or estimated.
What You See
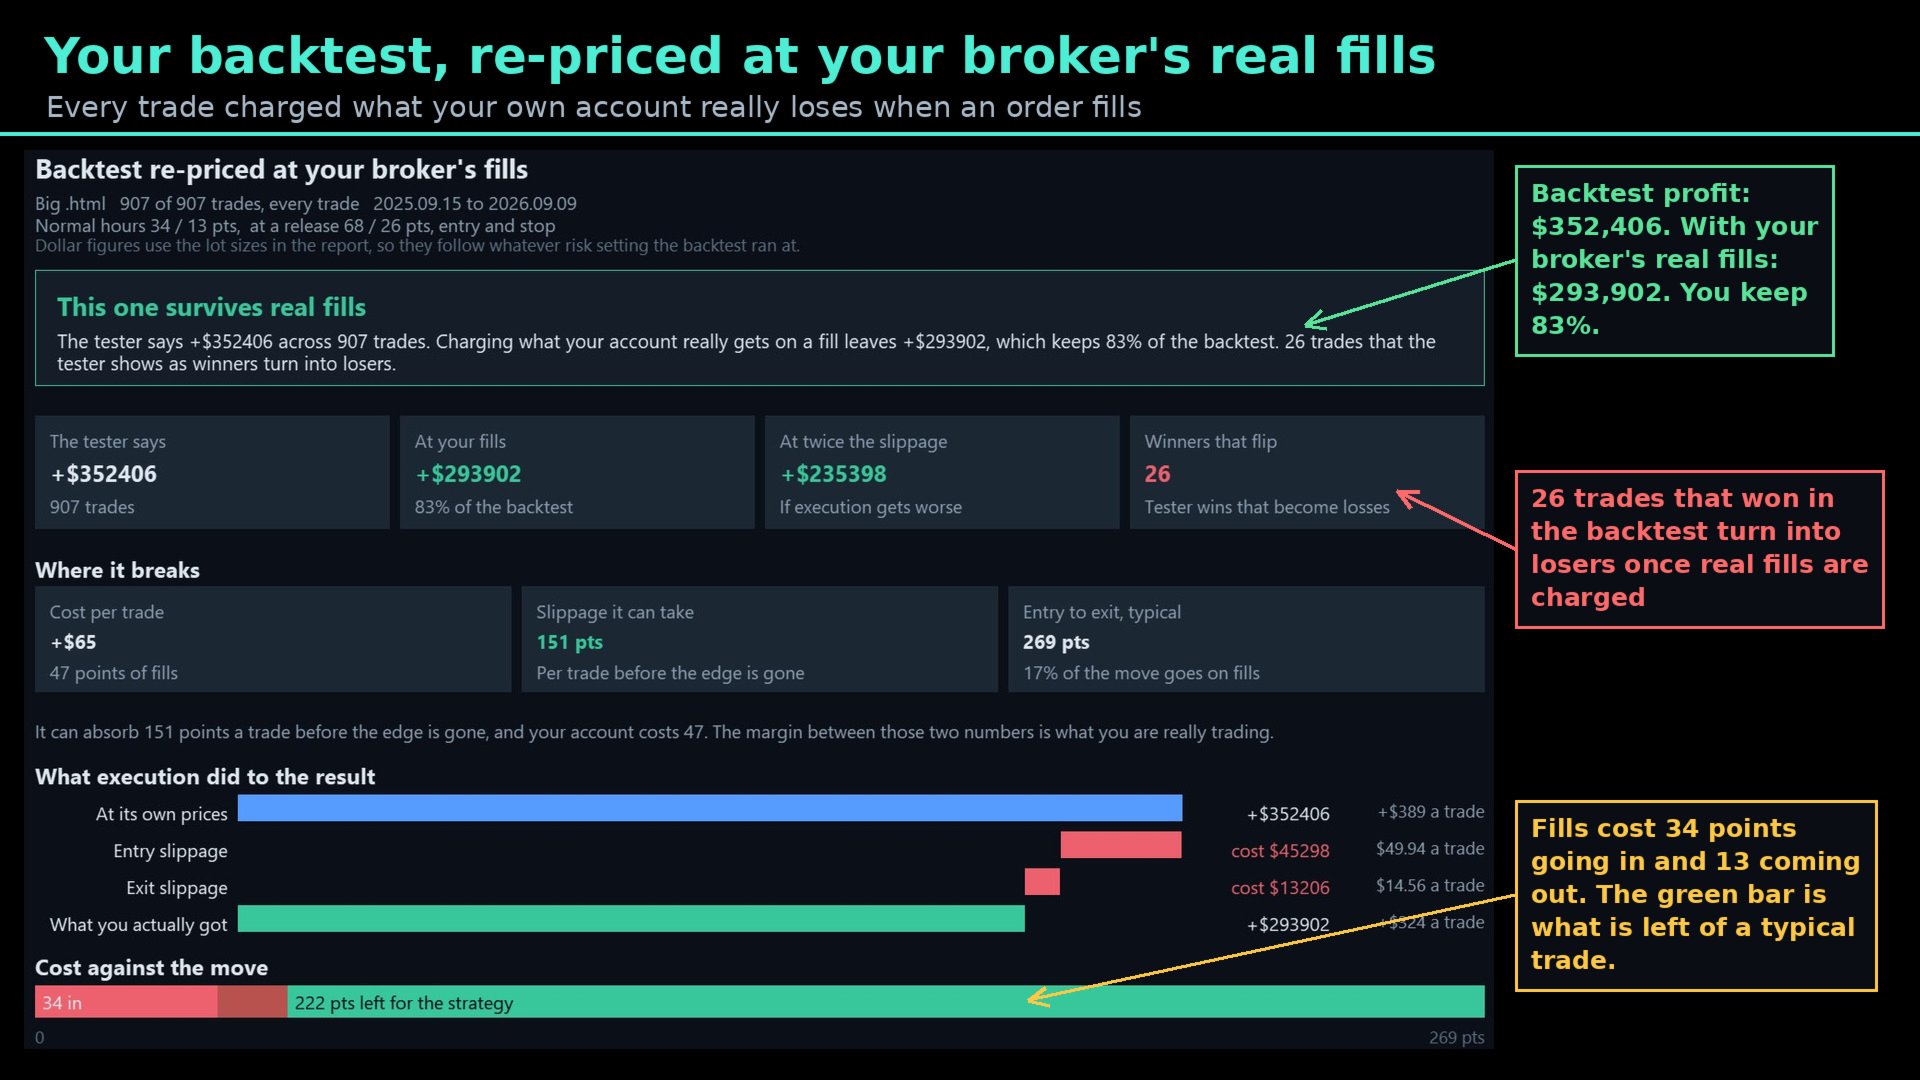
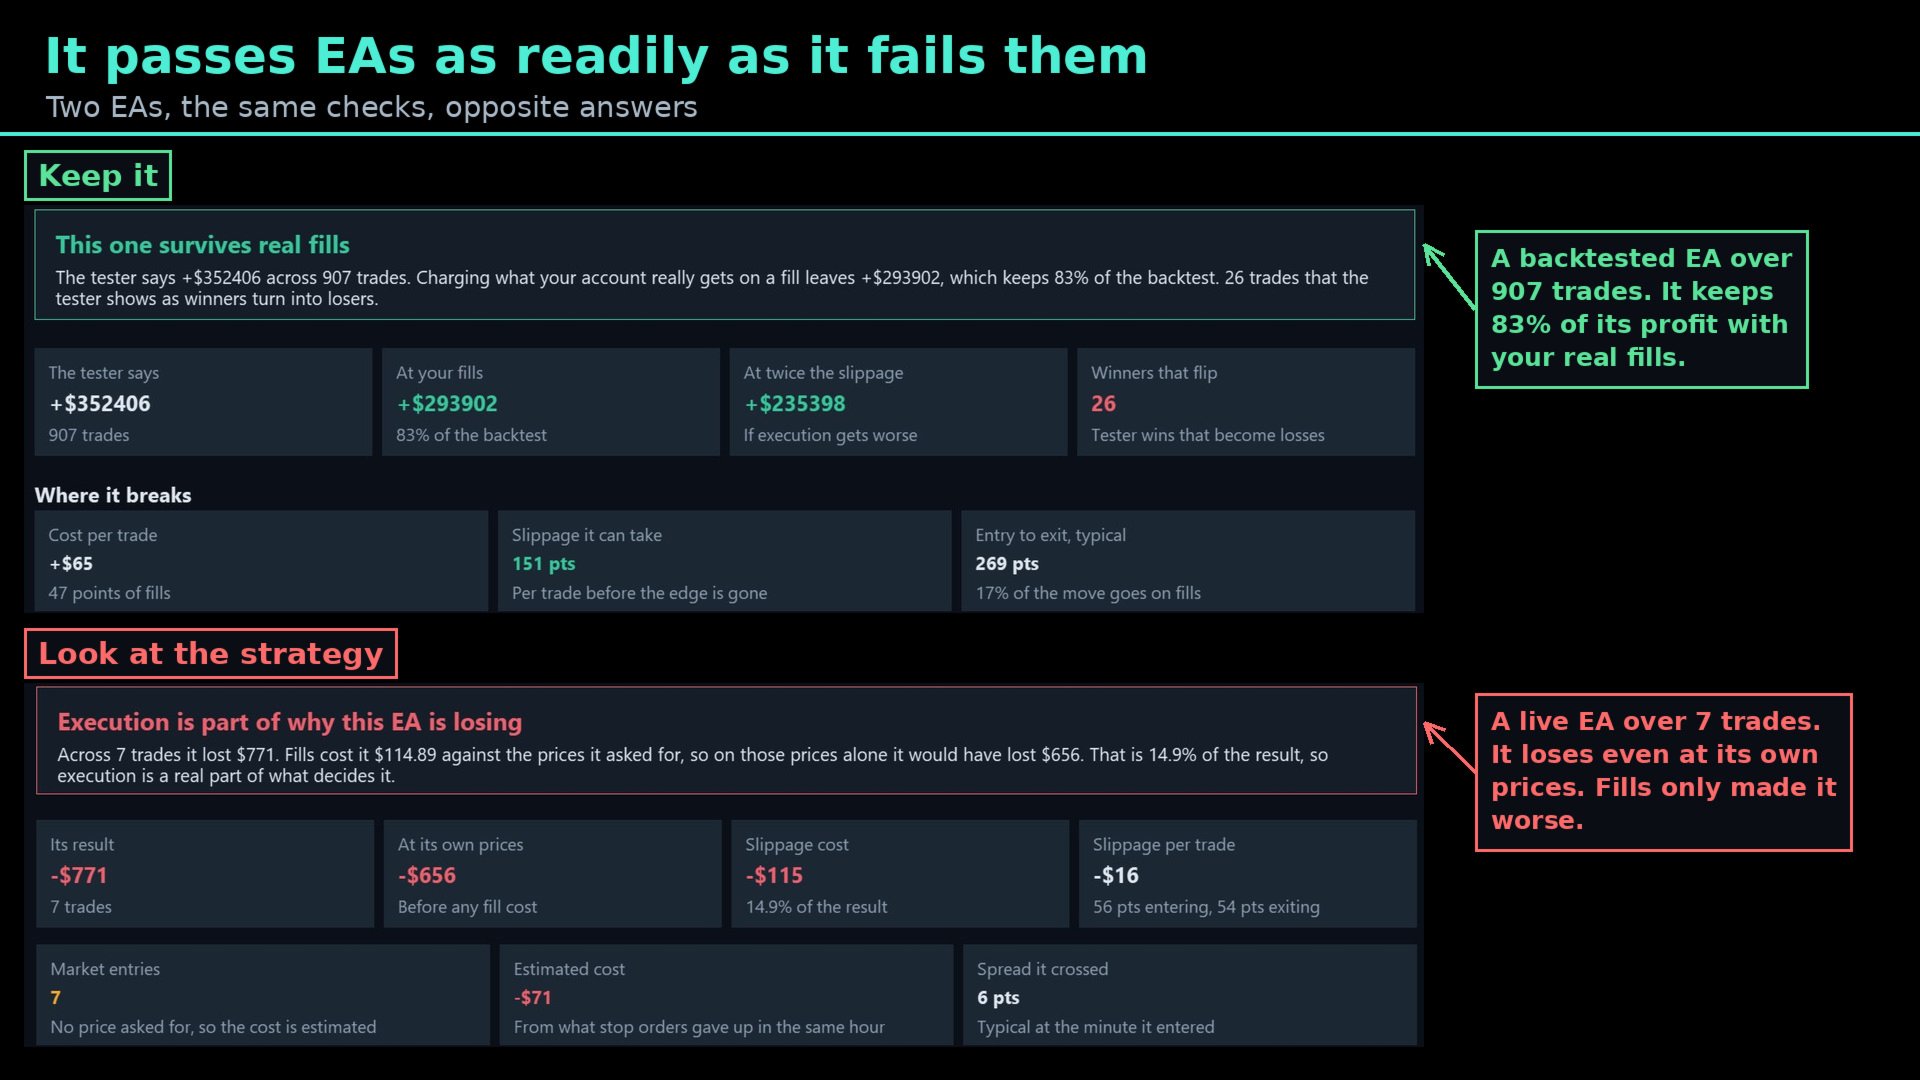
A backtest re-priced. What the tester said, what the same trades are worth at your fills, what happens at twice the slippage, and how many winning trades turn into losers.
Cost against the move. How far a typical trade travels from entry to exit, how much of that goes on fills, and what is left for the strategy. An EA whose trades run a long way can carry wide fills; one whose trades run a few points cannot.
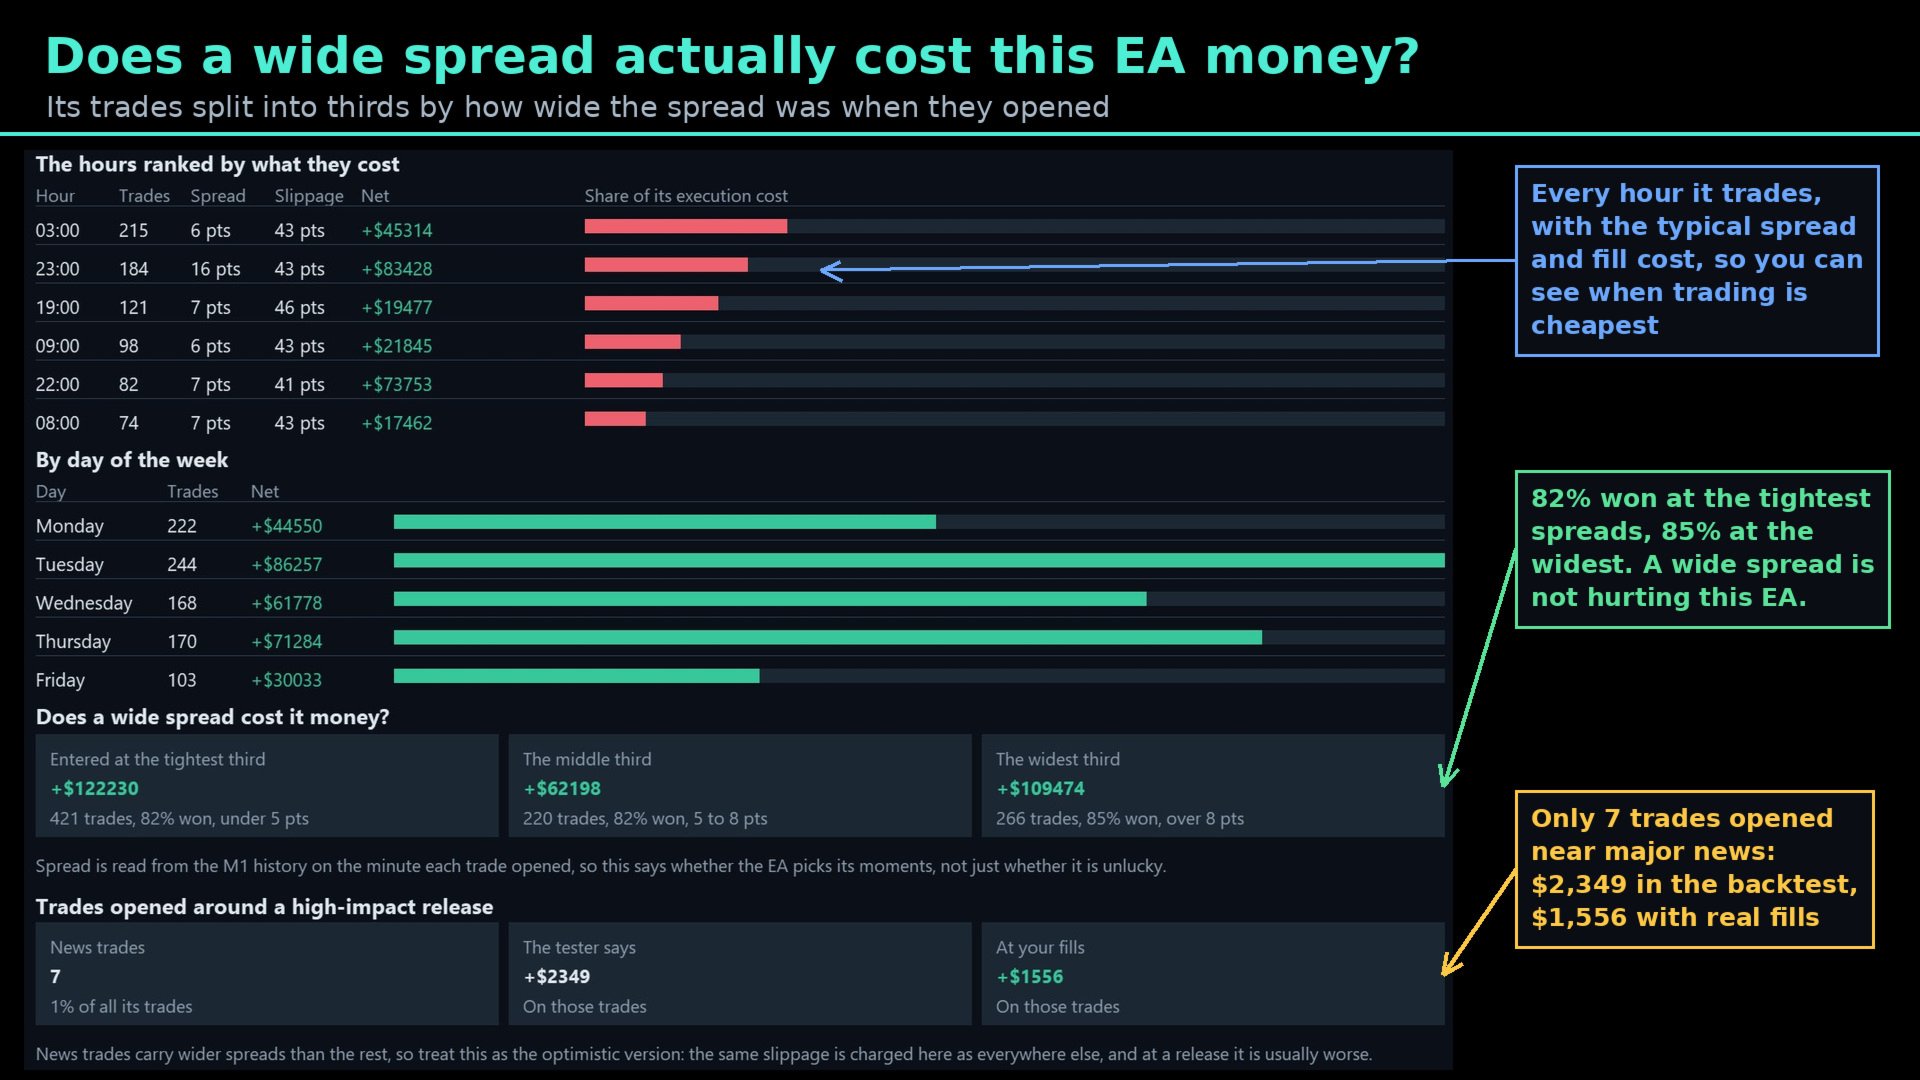
When it trades. Every hour ranked by what execution costs there, the result by day of the week, and its trades split into thirds by the spread they entered at — so you can see whether wider spreads actually cost this EA money, or whether it is unaffected.
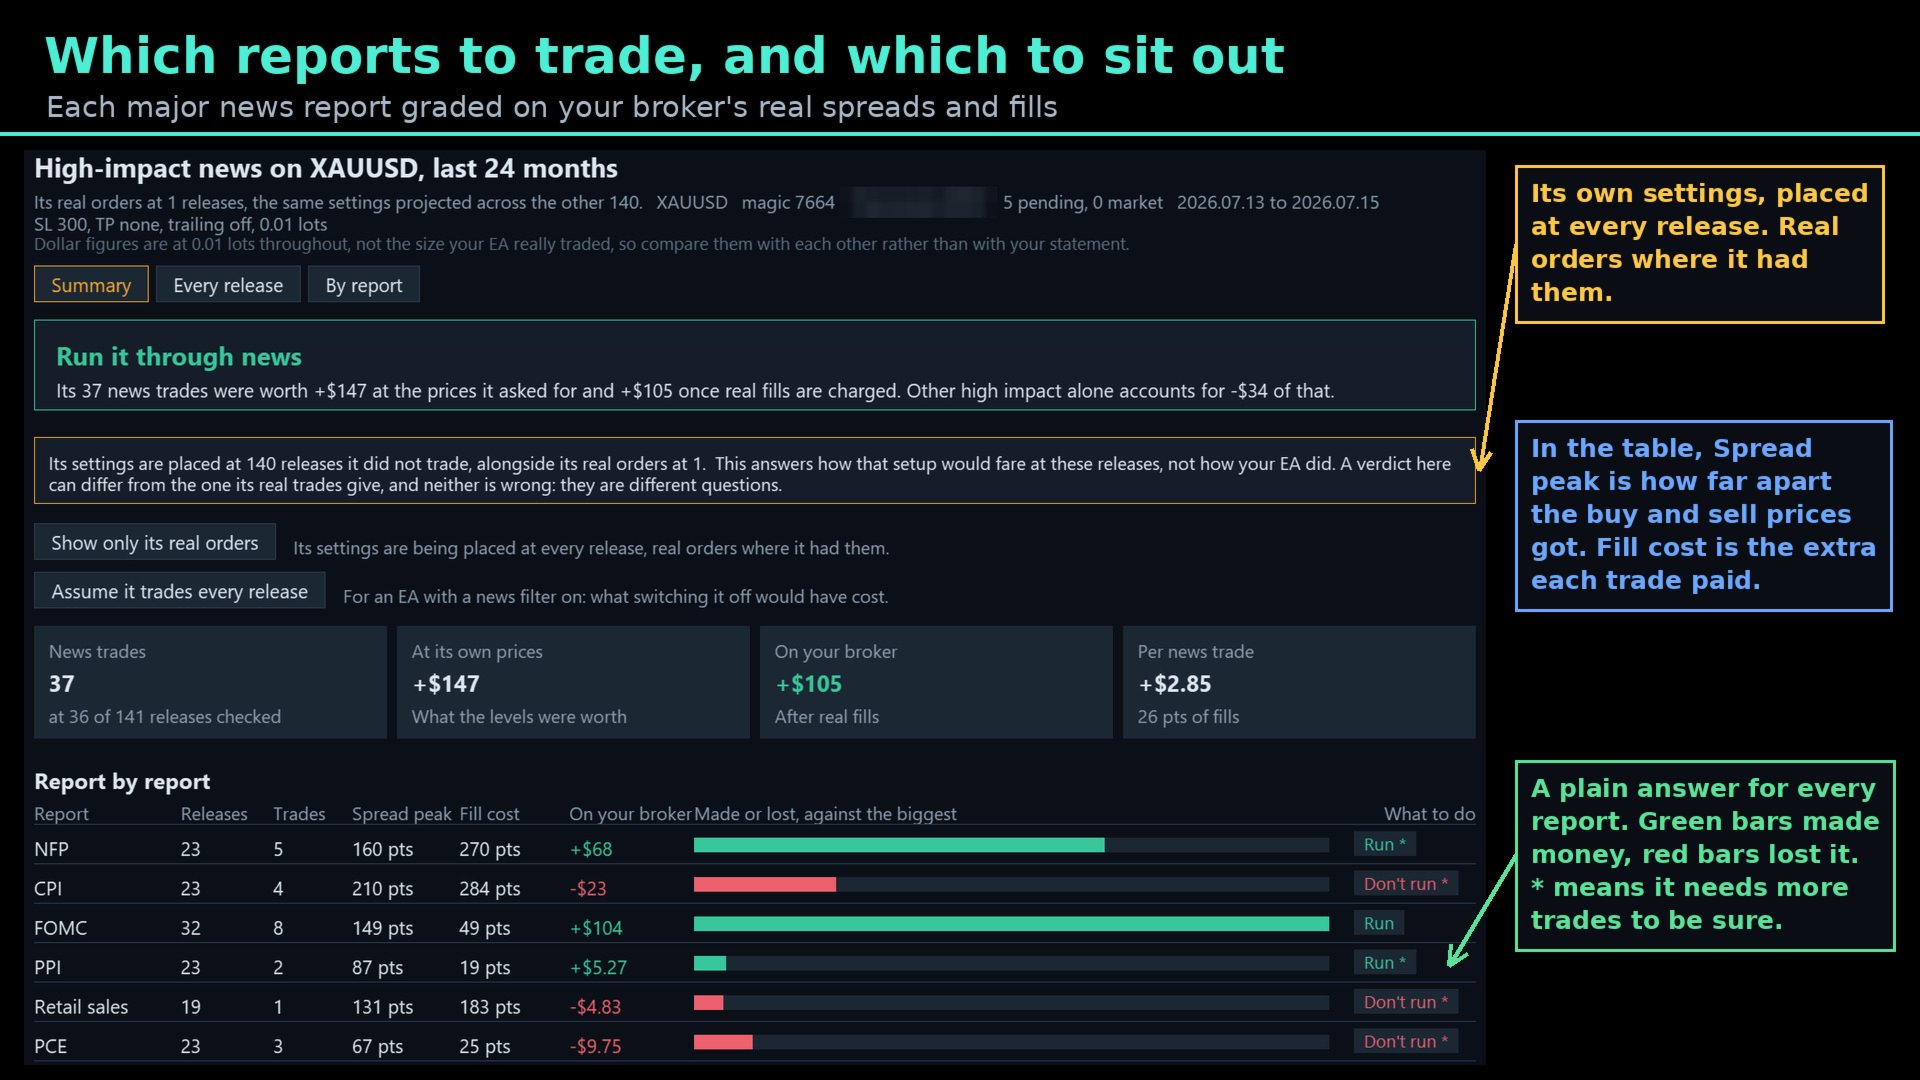
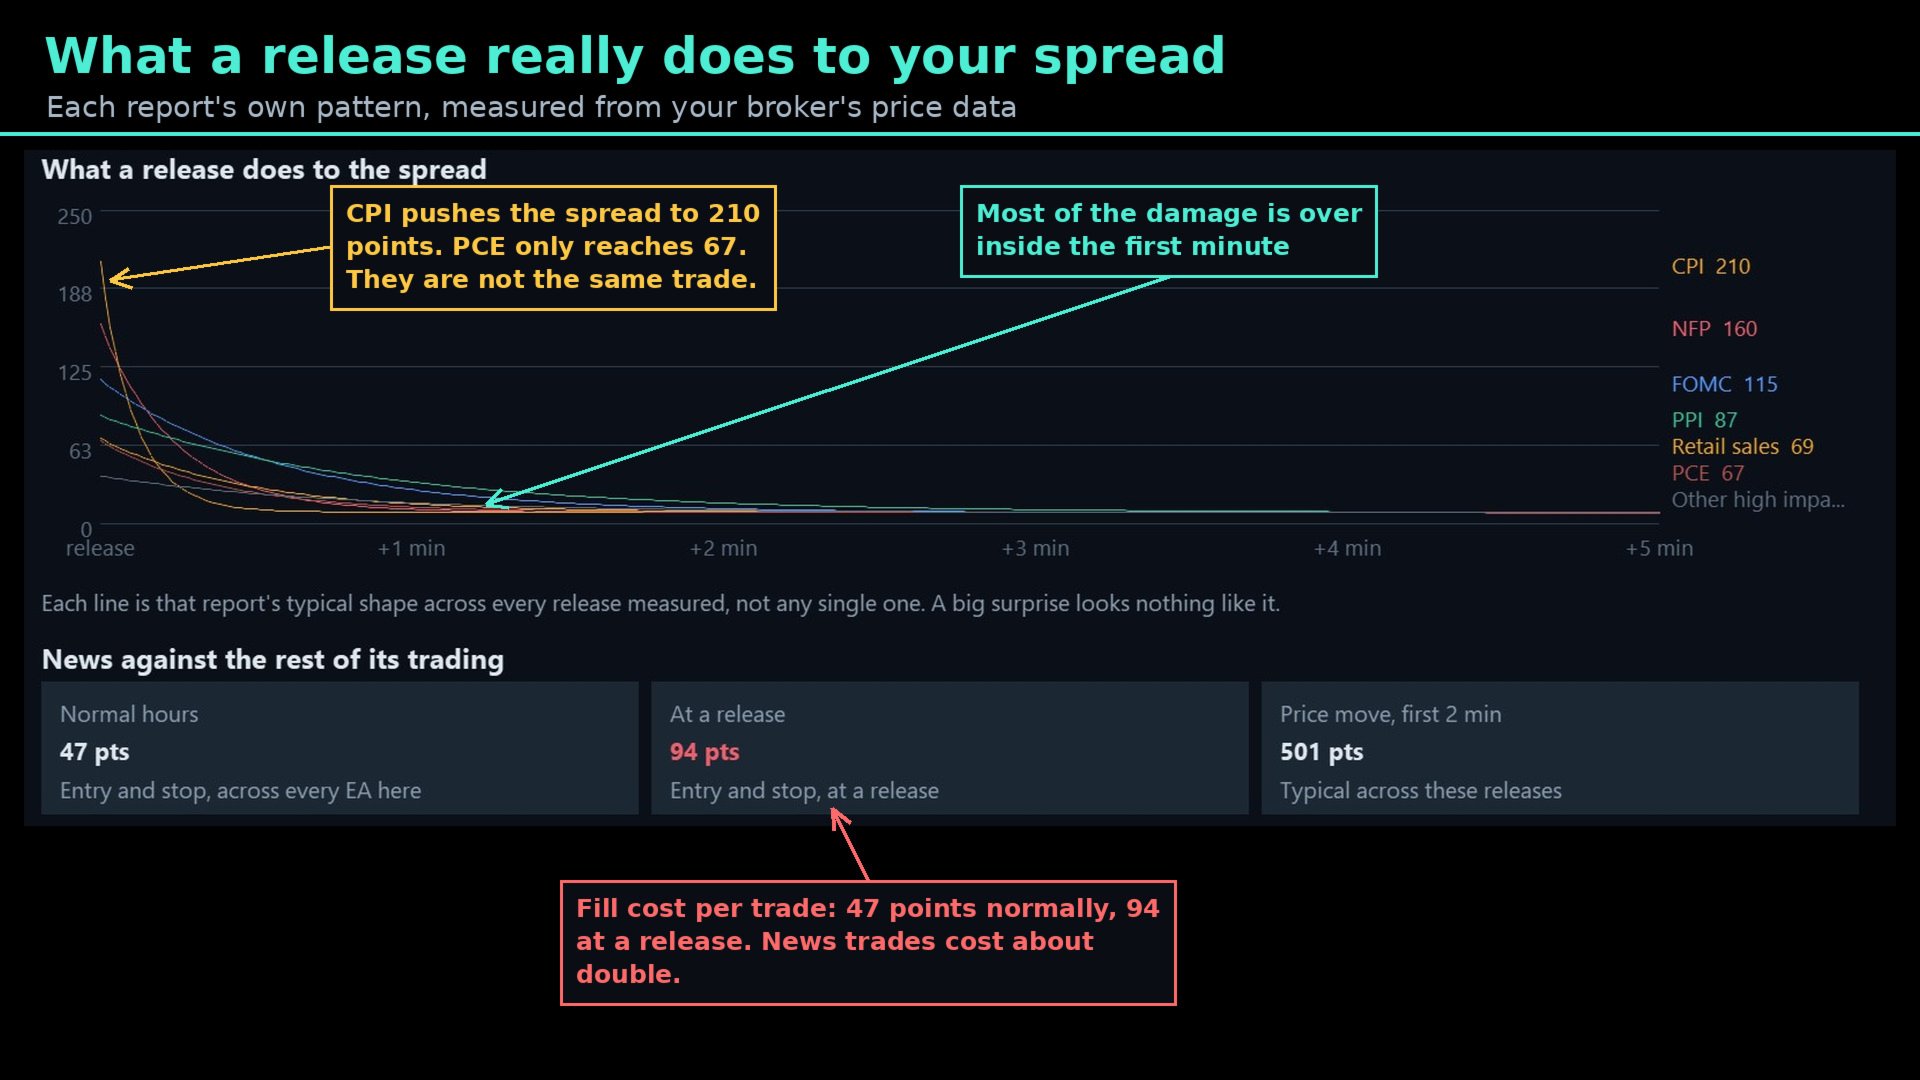
News, report by report. NFP, CPI, FOMC, PPI, retail sales, PCE and the rest, each with its own spread peak, fill cost, result on your account and a plain verdict: run it, run it smaller, or sit that one out.
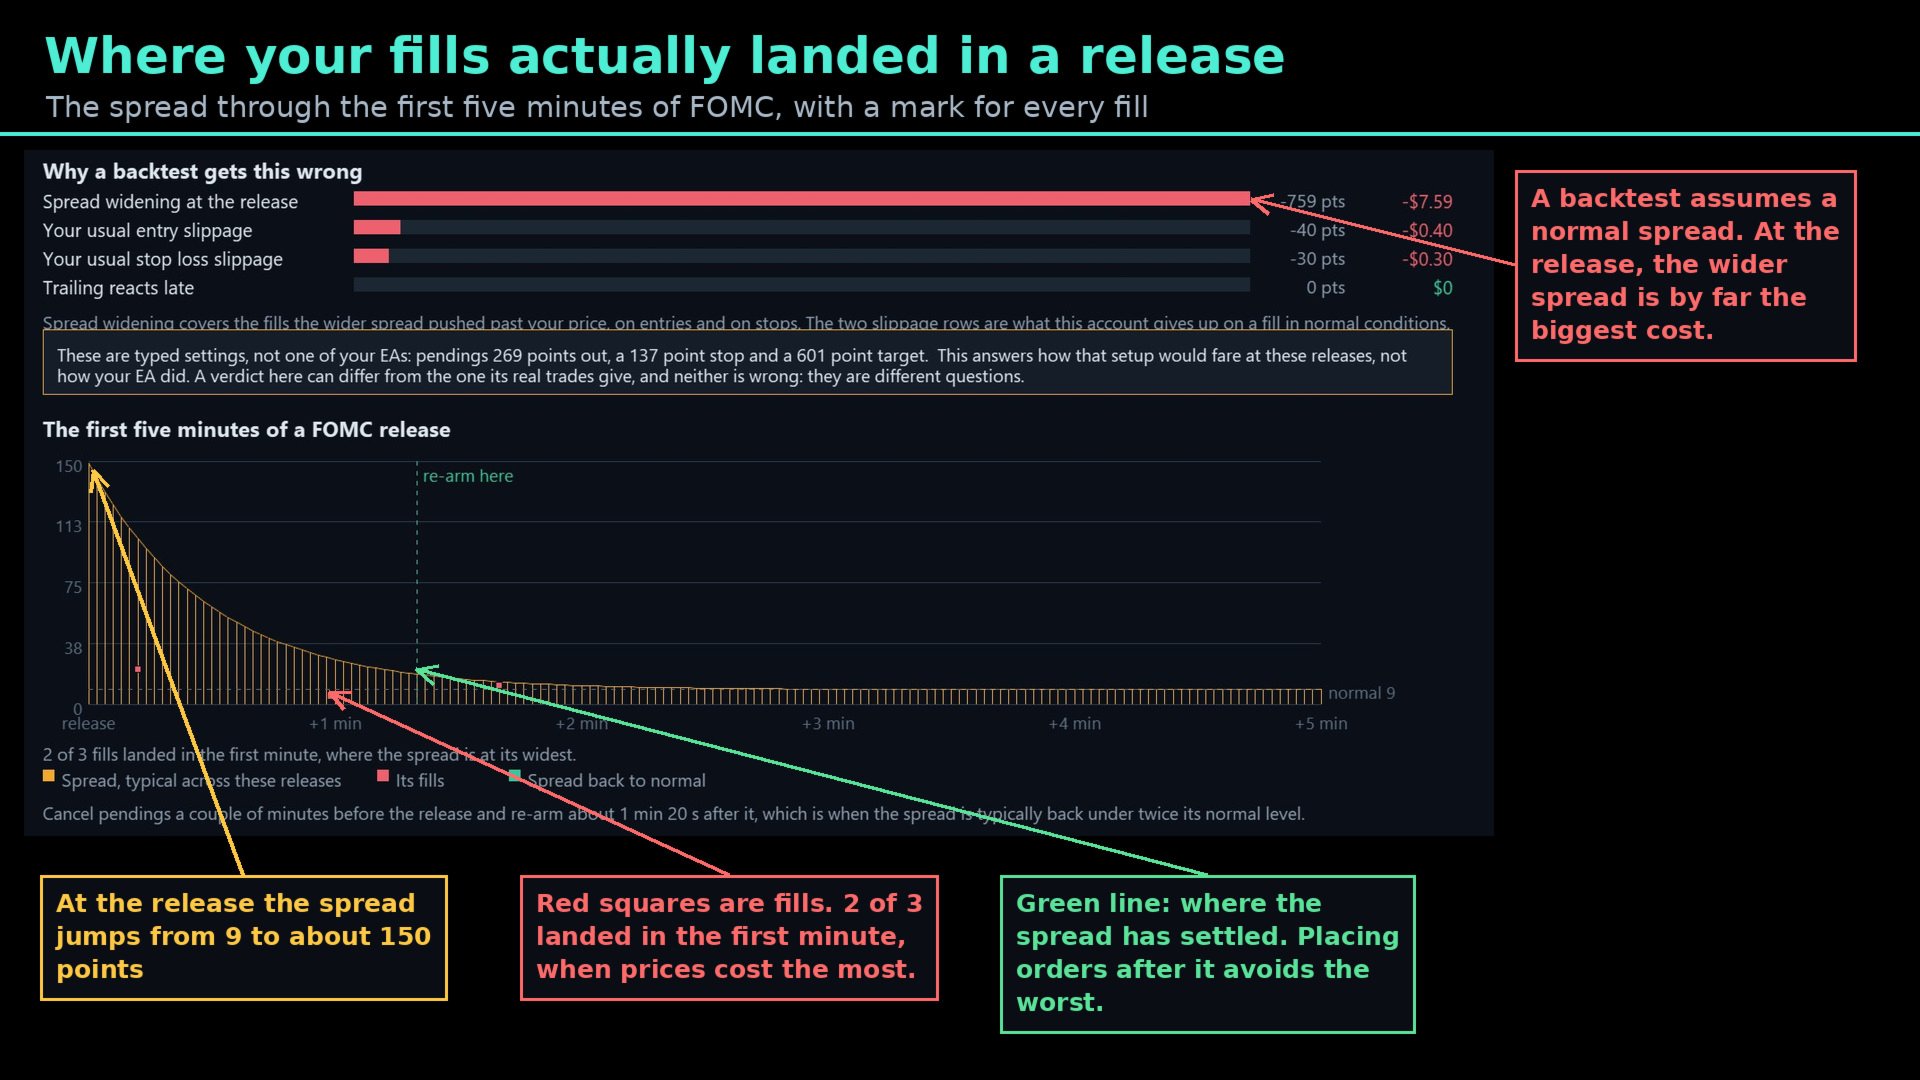
The first five minutes. The spread through a release drawn from tick data, with a marker for every fill the EA got, and the point at which the spread has typically settled again.
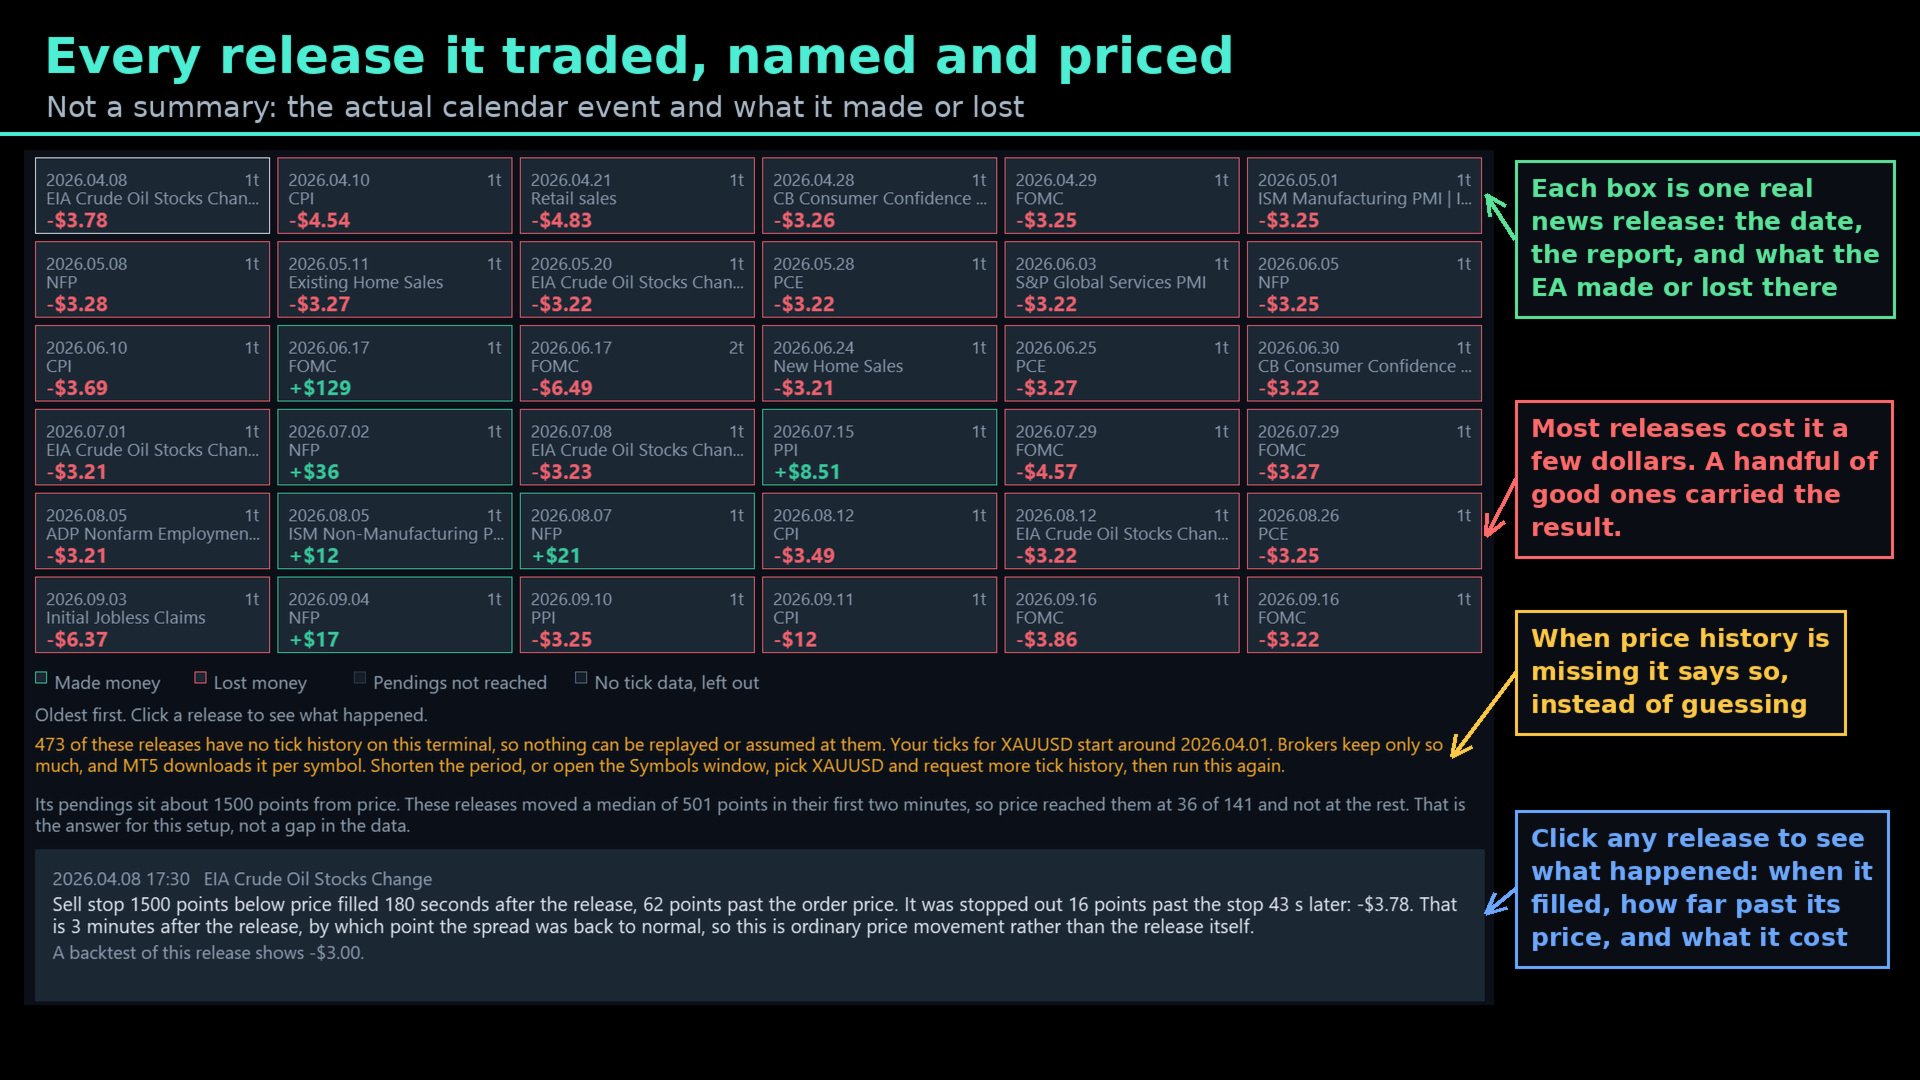
Every release, named and priced. The actual calendar event, the date, the trades and what they made or lost. Click one to see each order: how long after the release it filled, how far past its price, and what that cost.
Plain-English verdicts. Each one says what the number means and what to do next. Where the evidence is thin, it says so.
It Tells You When Something Is Wrong
A number produced from too little data is worse than no number. EA Slipstream marks a verdict with an asterisk when there are too few trades to be confident, when the two halves of the history disagree, or when a figure rests on settings projected onto releases the EA did not actually trade. It says how many releases had no tick history on the terminal and how to fetch more. It separates measured figures from estimated ones everywhere they appear, and it tells you when a result comes from a typed setup rather than from an EA's own orders.
What It Needs
- A live chart. The MetaTrader economic calendar is not available in the Strategy Tester, so the panel does not run there.
- Trade history on the account, for the live side. The more fills an EA has, the firmer the numbers.
- M1 history for the symbol, and tick history for the news work. The panel says when more is needed and where to request it.
- A Strategy Tester report saved as HTML or Open XML, for the backtest side. The optimisation tab's report lists passes rather than trades and cannot be used.
- EA Slipstream does not trade. It measures other EAs.
Who It Is For
Anyone running an EA they did not write. The backtest was produced somewhere else, on some other account. This shows what the same trades are worth with your own fills charged to them.
Traders deciding whether to trade through news. Instead of a blanket news filter, you get a release-by-release answer measured on your own account, and the point after a release at which conditions have typically settled.
Traders running the same EA in more than one place. Execution is part of what decides a result. Two accounts can produce different outcomes from identical logic, and this puts a number on that difference for the account you are looking at.
Developers. Know how much slippage your strategy can absorb before its edge is gone, and publish figures that already account for execution.
Getting Started
Attach EA Slipstream to a live chart of the symbol you want to check, then follow the three steps on screen. Nothing is typed unless you want to test a setup by hand — the scan finds every EA that has traded on the account and reads its settings from its own orders.
What's Included
EA Slipstream with the full live-history and backtest workflow, the news analysis with per-report verdicts, the release calendar with per-order detail, explanations on every page, and updates through the MQL5 comments section. Message me for the full detailed manual.
How This Differs From EA Auditor and EA Overfitter
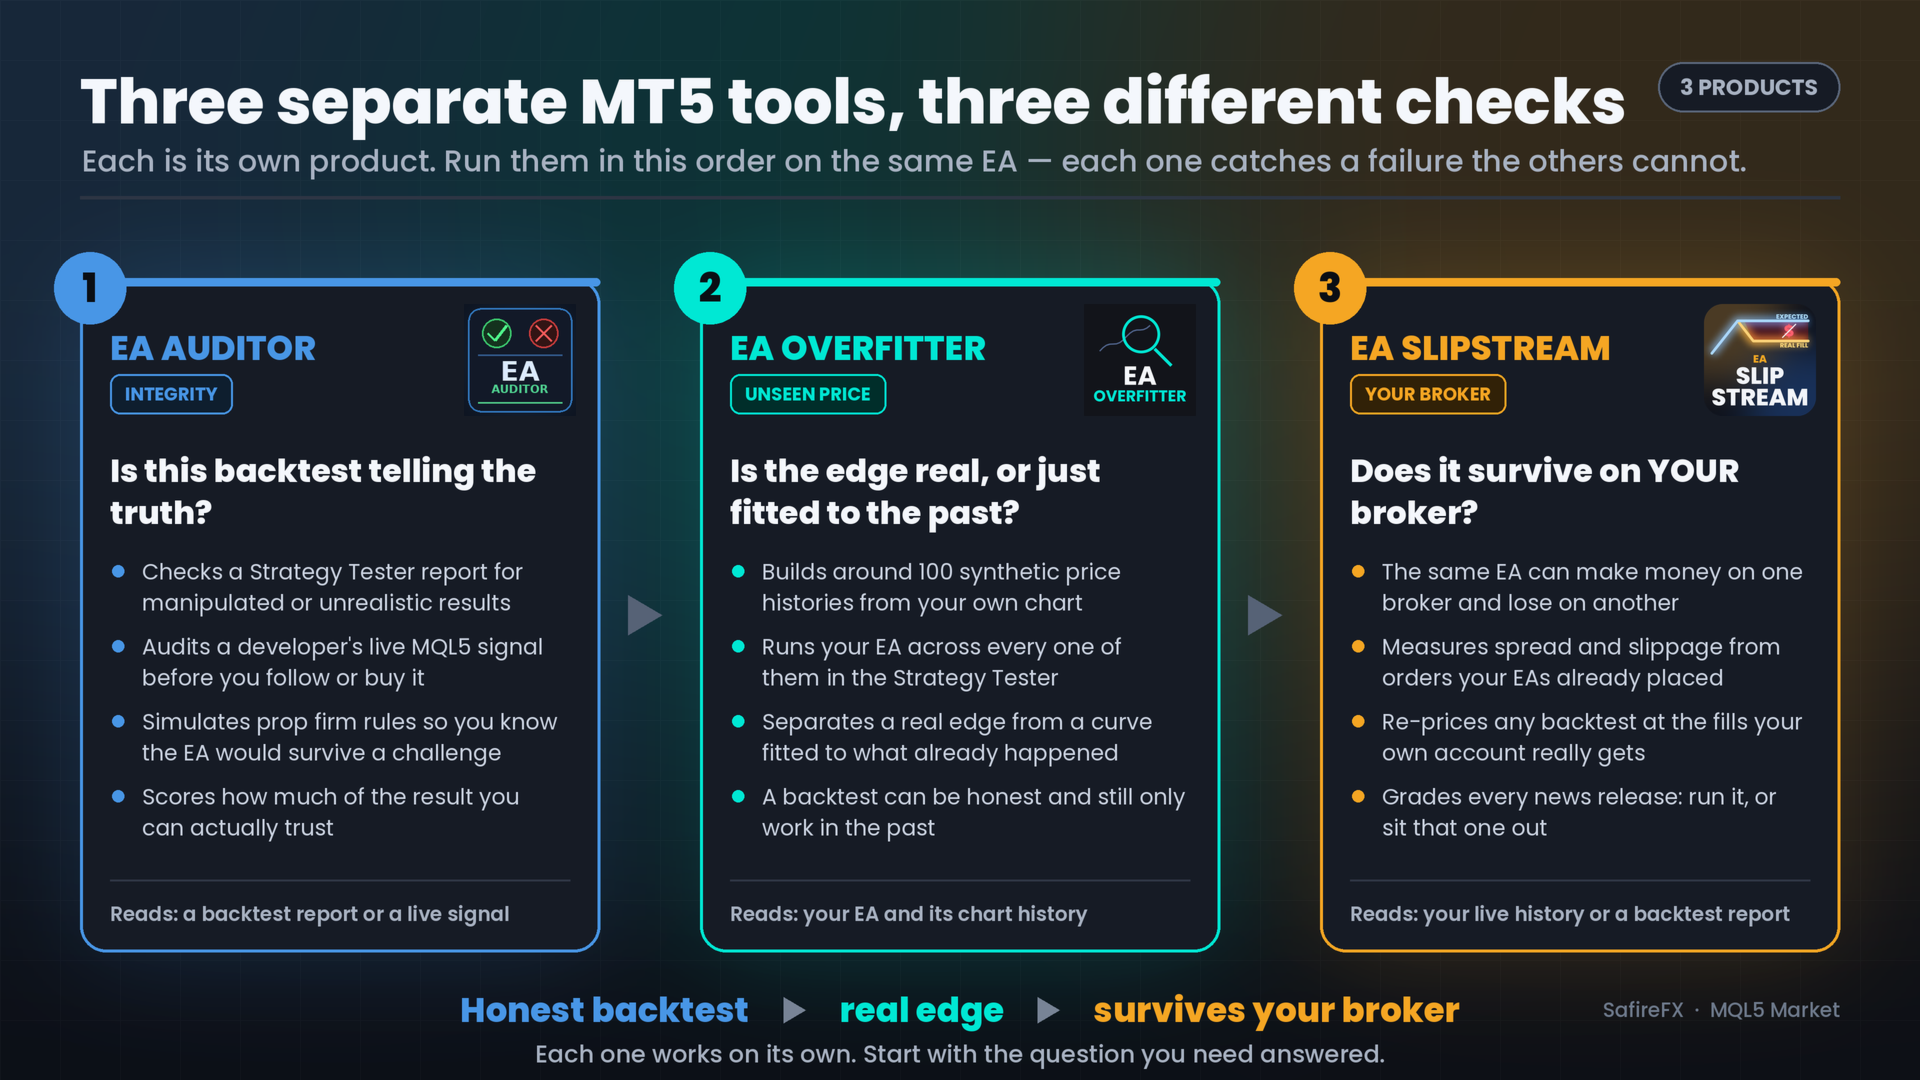
EA Auditor and EA Overfitter are my other MQL5 products — you will find them on my profile alongside this one. The three ask different questions about the same EA, and none replaces another.
EA Auditor asks whether the backtest is honest. It reads a backtest report or a live MQL5 signal and looks for the things that make a good-looking result untrustworthy, audits live signals, and simulates prop firm rule sets.
EA Overfitter asks whether the strategy holds up. It re-runs the EA on up to 100 price histories it has never traded and scores how much of the edge survives on unfamiliar data.
EA Slipstream asks what the trades are worth once execution is charged to them. The trades are real, the price history is your own, and the question is what is left of the result after the spread and the fills your account actually gets.
A backtest can be honest, and the edge behind it can be real, and the strategy can still be spending most of that edge on execution. Each of the three answers a different question, and each works on its own.